Significance
Kirsten rat sarcoma (KRAS) mutant tumors are believed to depend on autophagy for growth and survival. This study details the unexpected finding that autophagy-related 7, an enzyme essential for macroautophagy, can be deleted in several KRAS-driven cancer lines without affecting growth in vitro or in vivo. These data indicate that KRAS mutation status does not predict cell-autonomous addiction to autophagy. Furthermore, this report addresses a long-standing question regarding the mechanism of chloroquine, a lysosomotropic agent often used to interrogate effects of autophagy inhibition. Although chloroquine is antiproliferative and synergizes with targeted anticancer drugs, these effects are independent of macroautophagy. Future studies are needed to identify appropriate genetic stratification parameters to predict efficacy toward chloroquine and to characterize such agents further as anticancer combination partners.
Keywords: autophagy, chloroquine, cancer, KRAS, ATG7
Abstract
Macroautophagy is a key stress-response pathway that can suppress or promote tumorigenesis depending on the cellular context. Notably, Kirsten rat sarcoma (KRAS)-driven tumors have been reported to rely on macroautophagy for growth and survival, suggesting a potential therapeutic approach of using autophagy inhibitors based on genetic stratification. In this study, we evaluated whether KRAS mutation status can predict the efficacy to macroautophagy inhibition. By profiling 47 cell lines with pharmacological and genetic loss-of-function tools, we were unable to confirm that KRAS-driven tumor lines require macroautophagy for growth. Deletion of autophagy-related 7 (ATG7) by genome editing completely blocked macroautophagy in several tumor lines with oncogenic mutations in KRAS but did not inhibit cell proliferation in vitro or tumorigenesis in vivo. Furthermore, ATG7 knockout did not sensitize cells to irradiation or to several anticancer agents tested. Interestingly, ATG7-deficient and -proficient cells were equally sensitive to the antiproliferative effect of chloroquine, a lysosomotropic agent often used as a pharmacological tool to evaluate the response to macroautophagy inhibition. Moreover, both cell types manifested synergistic growth inhibition when treated with chloroquine plus the tyrosine kinase inhibitors erlotinib or sunitinib, suggesting that the antiproliferative effects of chloroquine are independent of its suppressive actions on autophagy.
Macroautophagy is a catabolic pathway that shuttles cytoplasmic components via double-membrane vesicles (autophagosomes) into lysosomes for degradation and recycling. Autophagosome formation and elongation are facilitated by ubiquitin-like molecules such as MAP1LC3A/B (herein referred to as “LC3”) and its homologs which are directly conjugated to phosphatidylethanolamine (PE), a reaction which requires the ubiquitin E1-like activity of autophagy-related 7 (ATG7), the E2-like activity of ATG3, and the E3-like activity of the ATG5–ATG12–ATG16L1 complex (1). Autophagy cargo receptors such as p62/SQSTM1 bind both LC3 and ubiquitinated cargo, enabling cargo recruitment into autophagosomes and delivery to lysosomes (2, 3).
Basal levels of macroautophagy control cellular homeostasis by clearing misfolded proteins or damaged organelles (4, 5). Upon starvation, macroautophagy can be induced above basal levels to supply the cell with nutrients (6, 7). This prosurvival function of macroautophagy is also used by cancer cells under conditions of metabolic stress (8). However, the role of autophagy in cancer is complex and context dependent, because the pathway has been reported to have tumor-suppressing as well as tumor-promoting properties (9–11). Liver-specific deletion of ATG7 results in increased formation of liver tumors through the activation of the Nrf2 pathway (12). Furthermore, the essential autophagy component beclin-1 inhibits tumorigenesis of breast carcinoma cells, and monoallelic deletion of beclin-1 is associated with an enhanced risk of breast cancer (13–15). Increased levels of beclin-1 are associated with reduced proliferation, survival, and tumorigenesis in Ras-driven cells (16–18), suggesting that autophagy may be antitumorigenic in this context.
Conversely, macroautophagy also has been reported to promote tumorigenesis of Ras-driven cancers, and inhibition of macroautophagy by either chloroquine or shRNA-mediated knockdown of ATG5 or ATG7 suppresses the proliferation of Ras-driven cancer lines in vitro and in vivo (19–21). Loss of ATG5 or ATG7 delays spontaneous tumorigenesis in genetically modified mouse models of lung and pancreatic Kirsten rat sarcoma (KRAS)-driven cancer (22–26); however, the loss of autophagy accelerated tumor onset if combined with a codeletion of p53 (25). It has been suggested that up-regulation of macroautophagy in Ras-transformed cells maintains cellular energy supply and mitochondrial function to combat the metabolic stress associated with transformation (19, 20, 22) and may be caused by the dysregulation of a transcriptional program that drives lysosomal biogenesis and function (27). Targeting this autophagy-addiction phenotype of Ras-driven tumors represents an attractive therapeutic approach with high unmet clinical need because no effective Ras inhibitors have been clinically approved (28). One approach to inhibit macroautophagy is treatment with chloroquine or its analogs (29), which disrupt lysosome function, and hydroxychloroquine is being tested in various clinical cancer trials (30).
In this study, we investigated whether KRAS mutation status correlates with sensitivity or resistance to the inhibition of macroautophagy. Unbiased profiling of 47 human cancer lines revealed that mutant KRAS lines do not show enhanced sensitivity to the chloroquine derivative Lys01 or shRNA-mediated depletion of ATG7, Unc-51-like autophagy activating kinase 1 (ULK1), or phosphatidylinositol 3-kinase, class 3/vacuolar protein sorting 34 (VPS34). Furthermore, in several KRAS-driven tumor lines the complete loss of ATG7 inhibited macroautophagy but did not affect tumor cell proliferation in vitro or in vivo. Interestingly, wild-type and ATG7-deficient cells were equally sensitive to the antiproliferative effects of chloroquine, and we determined that chloroquine, but not ATG7 depletion, enhanced the antiproliferative effects of certain kinase inhibitors. These results raise significant questions regarding the proposed role of tumor cell-intrinsic macroautophagy as a driver of KRAS-mediated tumorigenesis and reveal that chloroquine inhibits proliferation and sensitizes cells to certain targeted therapies independently of the canonical macroautophagy pathway.
Results
KRAS Mutation Status Does Not Predict the Sensitivity of Cancer Cells to Macroautophagy Inhibition.
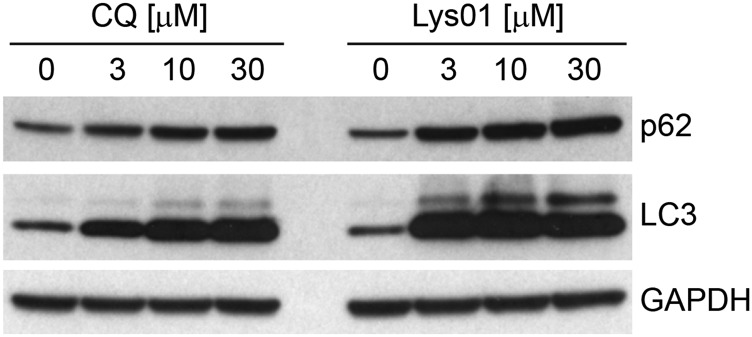
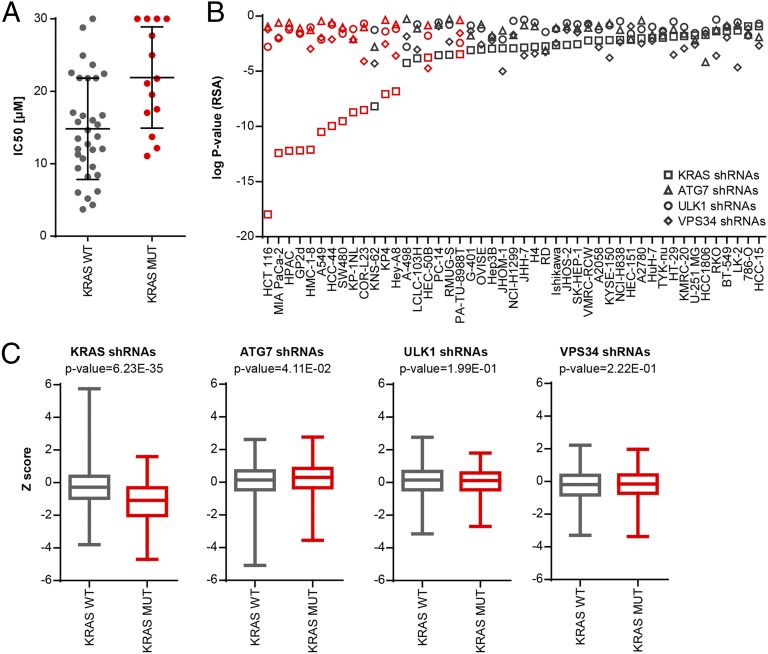
To test if oncogenic mutations in KRAS can predict autophagy addiction, we profiled the chloroquine analog Lys01 (29) in a panel of human cancer cell lines by high-throughput cell proliferation screening, an approach that has been used successfully to stratify specific cancer genotypes with antitumor therapies (31). Lys01 was chosen for its superior potency over chloroquine in blocking macroautophagy and increasing levels of the macroautophagy markers LC3 and p62 (Fig. S1). The panel of human cancer cells contained 47 lines from the cancer cell line encyclopedia (31) representing different primary tissues of origin and genetic backgrounds. Exposure of the cell panel to Lys01 for 3 d resulted in broad inhibition of proliferation (Table S1). Surprisingly, cell lines harboring oncogenic mutations in KRAS were less sensitive than wild-type KRAS cell lines to Lys01 (Fig. 1A).
Fig. S1.
Antiautophagic activity of Lys01. Panc 10.05 cells were treated for 24 h with the indicated doses of chloroquine or Lys01 and were probed by Western blot.
Table S1.
IC50 values of Lys01 in the panel of 47 cell lines
| Cell line | KRAS mutation status | Lys01 IC50, μM |
| 786-O | Wild type | 13.8 |
| A2058 | Wild type | 8.2 |
| A2780 | Wild type | 12.7 |
| A-498 | Wild type | 6.2 |
| A549 | Mutant | 30.0 |
| BT-549 | Wild type | 10.7 |
| COR-L23 | Mutant | 30.0 |
| G-401 | Wild type | 3.7 |
| GP2d | Mutant | 11.1 |
| H4 | Wild type | 6.0 |
| HCC-15 | Wild type | 21.8 |
| HCC1806 | Wild type | 21.8 |
| HCC-44 | Mutant | 25.0 |
| HCT 116 | Mutant | 21.1 |
| HEC-151 | Wild type | 14.6 |
| HEC-50B | Mutant | 19.5 |
| Hep3B | Wild type | 9.6 |
| Hey-A8 | Mutant | 12.2 |
| HMC-1–8 | Mutant | 13.7 |
| HPAC | Mutant | 17.5 |
| HT-29 | Wild type | 15.4 |
| HuH-7 | Wild type | 4.3 |
| Ishikawa | Wild type | 11.3 |
| JHH-7 | Wild type | 8.4 |
| JHOM-1 | Wild type | 17.1 |
| JHOS-2 | Wild type | 22.5 |
| KMRC-20 | Wild type | 12.0 |
| KNS-62 | Wild type | 22.4 |
| KP-1NL | Mutant | 27.7 |
| KP4 | Mutant | 30.0 |
| KYSE-150 | Wild type | 23.7 |
| LCLC-103H | Wild type | 16.7 |
| LK-2 | Wild type | 16.0 |
| MIA PaCa-2 | Mutant | 17.0 |
| NCI-H1299 | Wild type | 28.8 |
| NCI-H838 | Wild type | 24.9 |
| OVISE | Wild type | 30.0 |
| PaTu-8988T | Mutant | 30.0 |
| PC-14 | Wild type | 13.5 |
| RD | Wild type | 11.9 |
| RKO | Wild type | 16.6 |
| RMUG-S | Wild type | 12.1 |
| SK-HEP-1 | Wild type | 21.8 |
| SW480 | Mutant | 21.8 |
| TYK-nu | Wild type | 5.2 |
| U-251 MG | Wild type | 15.8 |
| VMRC-RCW | Wild type | 9.4 |
IC50 proliferation values of Lys01 correspond to Fig. 1A.
Fig. 1.
KRAS mutation status does not predict the sensitivity of cancer cells to autophagy inhibition. (A) Forty-seven cell lines were treated with Lys01, cell proliferation was measured after 3 d using CellTiter-Glo, and IC50 values were determined relative to vehicle control (0%) and MG132 (100%). Each dot represents the IC50 value for a cell line binned based on KRAS mutation status. The horizontal line and whiskers represent the mean ± SD. Note that KRAS wild-type lines are more sensitive to Lys01 with a lower mean IC50 (P = 0.006, Wilcoxon test). IC50 proliferation values for individual cell lines are displayed in Table S1. (B) The panel of 47 cell lines was subjected to a proliferation-based pooled shRNA screen using the DECODER shRNA library. Depletion of KRAS, ATG7, ULK1, and VPS34 shRNAs was determined after five population doublings and is depicted as gene-centric log P value of all 17 shRNAs calculated with the RSA statistic. The waterfall plot is sorted by log P values of KRAS shRNAs; cell lines harboring known oncogenic mutations in KRAS are highlighted in red. (C) The fold changes of all KRAS, ATG7, ULK1, and VPS34 shRNAs were calculated and represented as Z score binned based on KRAS mutation status. Box plots represent the mean ± quartiles with bars indicating maximal and minimal values. P values were calculated using the t-test for each gene comparing cell lines harboring wild-type or mutant KRAS.
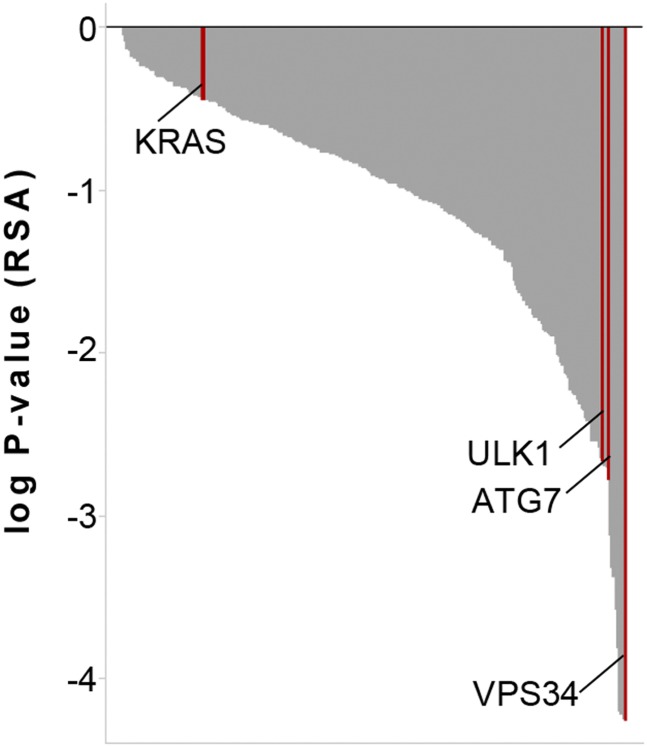
Chloroquine and Lys01 are lysosomotropic agents which may inhibit pathways other than macroautophagy. Therefore, we tested whether genetic inhibition of macroautophagy by shRNA-mediated depletion of core components could reveal autophagy-addicted cells in the panel of 47 cell lines. We analyzed the results from a proliferation-based pooled shRNA screen which used the deep coverage design shRNA (DECODER) library containing hairpins directed against ATG7, ULK1, and VPS34. The DECODER shRNA library contains 17 hairpins per gene and has been used successfully to identify synthetic lethal targets in cancer cells (32). Knockdown of KRAS significantly inhibited the growth of tumor cell lines containing oncogenic mutations in KRAS (Fig. 1 B and C), as described previously (32). Knockdown of ATG7, ULK1, and VPS34 did not robustly impair cell proliferation after five cell-population doublings and did not show any significant differential response between cell lines harboring wild-type or mutant KRAS (Fig. 1 B and C). All cell lines in this panel were amenable to lentiviral infection and gene silencing, because knockdown of the proteasomal subunit PSMA3 was globally cytotoxic (32). Screening of the DECODER shRNA library with a FACS-based GFP-p62 autophagy reporter assay (33) identified ATG7, ULK1, and VPS34 shRNAs enriched in cells harboring high GFP-62 fluorescence (Fig. S2), as is consistent with the inhibition of macroautophagy preventing degradation of the GFP-p62 reporter. These data suggest that ATG7, ULK1, and VPS34 shRNAs can inhibit macroautophagy but that KRAS-mutated cells are not more dependent on autophagy than their wild-type counterparts.
Fig. S2.
DECODER shRNA library screen with FACS-based GFP-p62 autophagy reporter assay. H4 Tet-Off GFP-p62 cells were infected with the DECODER shRNA library, expanded for 4 d, treated with DOX for 24 h, harvested, and then subjected to FACS sorting. Enrichment of shRNAs in cells with high versus low GFP was used to calculate gene-level log P values with the RSA statistic. Note that hairpins directed against ATG7, ULK1, and VPS34 are significantly enriched in cells with high GFP levels, in keeping with the inhibition of autophagy and the cellular accumulation of GFP-p62.
ATG7 Is Dispensable for KRAS-Driven Cell Proliferation in Vitro.
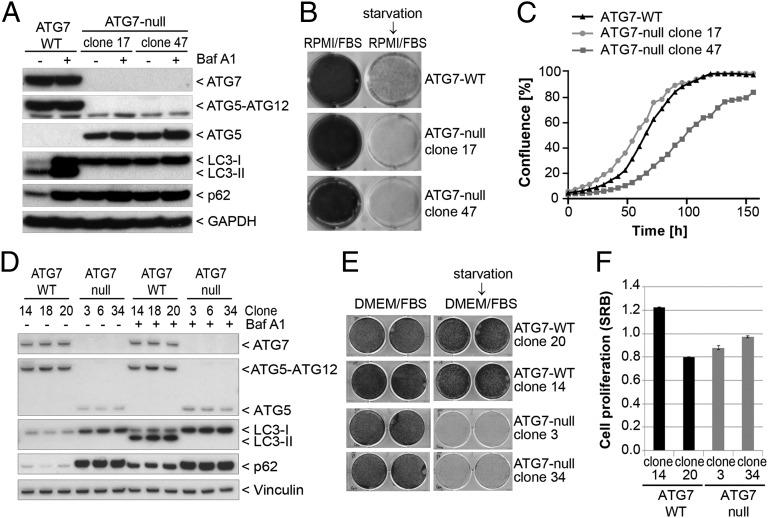
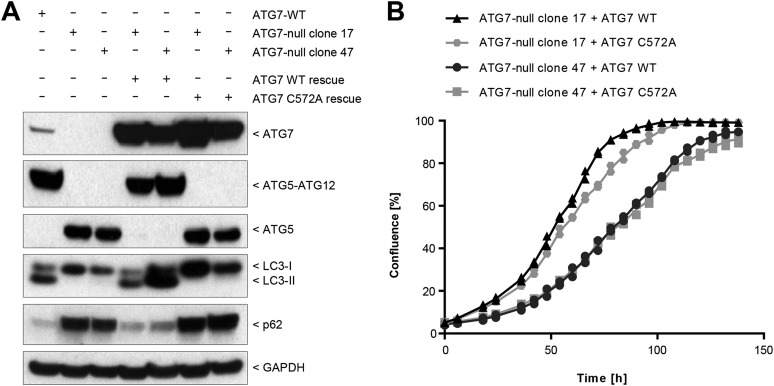
To confirm the results obtained in the shRNA screen, we next applied genome-editing tools to knock out ATG7 to achieve complete inhibition of the autophagy pathway. ATG7 is essential for the formation of the ATG5–ATG12 and LC3–PE conjugates, both of which are required for autophagosome assembly (6). Zinc finger nucleases were first used to knock out ATG7 in the pancreatic tumor line Panc 10.05 which harbors a G12D mutation in KRAS, is sensitive to shRNA-mediated depletion of KRAS (34), and maintains high basal levels of autophagic flux (20). Two clonal lines (clones 17 and 47) were identified with undetectable levels of ATG7 and ATG5–ATG12 conjugate and an accumulation of free ATG5, nonlipidated LC3 (LC3-I), and p62 (Fig. 2A). Macroautophagy was fully inhibited in these lines because treatment with the vacuolar H+-ATPase inhibitor bafilomycin A1 did not lead to additional accumulation of lipidated LC3 (LC3-II) or to an increase in p62 (Fig. 2A). In contrast to parental Panc 10.05 cells, ATG7-deficient clones were unable to form any visible colonies when deprived of serum and amino acids for 3 d followed by a 2-d recovery period (Fig. 2B). These data confirm the functional loss of ATG7 during nutrient starvation when macroautophagy induction confers a growth advantage. Under nutrient-rich conditions, we observed no consistent inhibition of cell proliferation in ATG7-deficient cells (Fig. 2C), with clone 17 growing faster and clone 47 growing more slowly than parental cells. Re-expression of ATG7 restored LC3 lipidation and p62 levels in ATG7-deficient clones but did not rescue cell proliferation (Fig. S3). These results suggest that the growth difference between the clones is caused by clonal variation and is independent of ATG7 activity.
Fig. 2.
Deletion of ATG7 sensitizes cells to starvation without impacting proliferation under nutrient-replete conditions. (A) Panc 10.05 ATG7-null clones were generated using zinc finger nucleases as described in Materials and Methods. ATG7-WT and ATG7-null clones 17 and 47 were treated for 24 h in the absence or presence of 50 ng/mL bafilomycin A1 and steady-state levels of endogenous markers visualized by Western blot. (B) Cells were cultured for 5 d in six-well dishes in regular growth medium (RPMI/FBS) or were starved for 3 d in HBSS followed by recovery for 2 d in regular growth medium. Cells then were fixed and stained with Crystal Violet. (C) Cells were grown in 96-well plates, and confluence was measured at the indicated time points by the IncuCyte imaging system. (D) A549 ATG7 wild-type or ATG7-null clonal cell lines generated by TALEN genomic editing were treated with or without 10 nM bafilomycin A1 for 24 h and then were lysed and assessed for modulation of ATG7 function. Vinculin was probed as a loading control. (E) A549 ATG7 wild-type and ATG7-null cell lines seeded in six-well dishes were maintained in regular growth medium (DMEM/FBS) or were subjected to starvation in HBSS for 5 d followed by recovery. Cells were stained with sulforhodamine B (SRB). (F) Equal cell numbers of A549 ATG7 wild-type or ATG7-null cells were plated, and proliferation was assessed after 4 d by SRB staining.
Fig. S3.
Characterization of Panc 10.05 ATG7-null lines rescued with ATG7 wild type or ATG7C572A. (A) ATG7 wild-type or catalytic-inactive ATG7C572A constructs were stably expressed in Panc 10.05 ATG7-null lines 17 and 47. Cells were lysed and probed by Western blot analysis. (B) Cells were grown in 96-well plates, and confluence was measured at the indicated time points by IncuCyte. Data points from two replicates are shown.
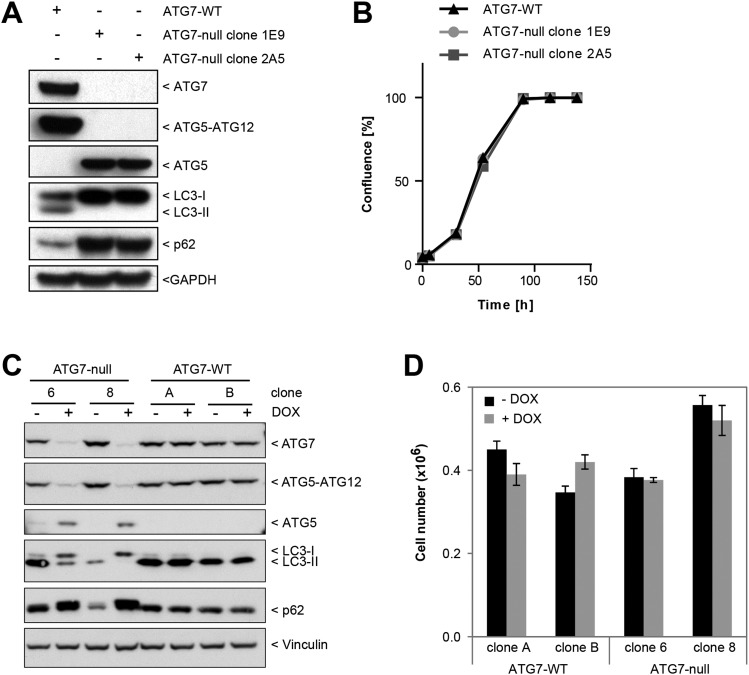
We next used transcription activator-like effector nucleases (TALENs) to knock out ATG7 in the nonsmall cell lung cancer cell line A549, which in the pooled shRNA screen was identified as one of the lines most sensitive to KRAS depletion (Fig. 1B). Loss of ATG7 in A549 cells prevented the formation of the ATG5–ATG12 conjugate and resulted in an accumulation of p62 and LC3-I (Fig. 2D). Autophagic flux was inhibited completely in the ATG7-deficient cells because bafilomycin A1 did not promote further accumulation of p62 or LC3-II. Similar to Panc 10.05 cells, ATG7-deficient A549 clones were sensitive to serum and nutrient deprivation (Fig. 2E) but did not show reduced proliferation under standard growth conditions (Fig. 2F). Cell proliferation was unaffected upon ATG7 knockout in two additional KRAS mutant cancer lines previously shown to have high autophagic flux (19, 20), namely the colorectal cancer cell line HCT116 (Fig. S4 A and B) and the pancreatic cancer line PaTu-8988T (Fig. S4 C and D). Collectively, these results suggest that KRAS-driven cancer cells do not depend on ATG7 and macroautophagy for proliferation in nutrient-replete conditions.
Fig. S4.
Loss of ATG7 in HCT116 or PaTu-8988T cells does not impact proliferation. (A) HCT116 ATG7 wild-type and the ATG7-null clones 1E9 and 2A5 were probed by Western blot. (B) Cells were grown in 96-well plates, and confluence was measured at the indicated time points by the IncuCyte imaging system. (C) PaTu-8988T cells expressing DOX-inducible TALENs targeting ATG7 were pretreated with DOX as described in Materials and Methods and then were lysed and immunoblotted for autophagy pathway components. (D) Equal numbers of inducible ATG7-null cells treated as in C were plated, and proliferation assessed after 4 d by cell counting after Trypan Blue exclusion.
Macroautophagy Does Not Contribute to KRAS-Dependent Tumor Growth in Vivo.
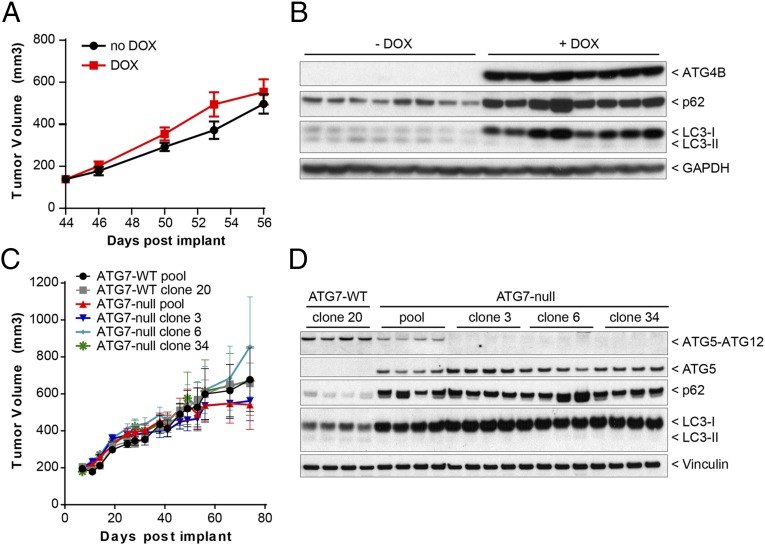
Because macroautophagy deficiency conferred a survival disadvantage under nutrient starvation in vitro (Fig. 2), we evaluated whether this finding would translate to a reduction in tumor growth in vivo. We first assessed whether macroautophagy loss would affect the growth of established tumors by using Panc 10.05 tumor cells harboring doxycycline (DOX)-dependent expression of the dominant-negative protease ATG4BC74A (33, 35) to allow inducible inhibition of macroautophagy in cells subsequent to tumor formation. Inducible expression of ATG4BC74A effectively blocked macroautophagy in Panc 10.05 cells and resulted in a striking accumulation of LC3-I and p62, durable inhibition of macroautophagy, and a small but reproducible decrease in cell growth in vitro (Fig. S5). In vivo, expression of ATG4BC74A for 12 d after tumor formation did not reduce Panc 10.05 tumor xenograft growth (Fig. 3A) despite robust inhibition of the macroautophagy pathway (Fig. 3B).
Fig. S5.
Inhibition of autophagy with dominant-negative ATG4B. (A) Panc 10.05 cells with DOX-inducible expression of ATG4BC74A were cultured in the absence or presence of DOX for 5 d, and bafilomycin A1 was added for the last 24 h where indicated. Cells were lysed and probed by Western blot. (B) Panc 10.05 ATG4BC74A cells were grown for the indicated times with or without DOX, and steady-state levels of ATG4B, p62, LC3, and GAPDH were visualized by Western blot. (C) Panc 10.05 ATG4BC74A cells were cultured in 96-well plates with or without DOX, and cell growth was assessed using CellTiter-Glo at the indicated time points. Cell growth is depicted relative to day 0; data points represent the mean ± SD from two independent experiments.
Fig. 3.
Autophagy is dispensable for in vivo growth of KRAS mutant tumors. (A) Panc 10.05 ATG4BC74A cells were grown as xenografts in mice which were dosed with or without DOX starting at day 44 after implantation. Tumor volume was measured at the indicated times. Each data point represents the mean from eight mice ± SEM. (B) Fifty-six days after implantation, tumors were dissected, lysed, and analyzed by Western blot. Each sample corresponds to a distinct tumor. (C) Polyclonal (pooled) and monoclonal (cloned) populations of A549 ATG7 wild-type or ATG7-null cells were grown as xenografts in nude mice. Tumor volume was measured at the indicated times. Each data point represents the mean from 15 mice ± SEM. (D) Forty-six days after implantation, tumors were isolated, lysed, and analyzed for autophagy modulation by immunoblotting. Each sample corresponds to a distinct tumor. The ATG5–ATG12 conjugate was visualized with antibodies against human-specific ATG12.
Because macroautophagy deficiency did not reduce the growth of established Panc 10.05 tumors, we examined the impact of constitutive autophagy loss on tumor initiation in a second model. Loss of ATG7 did not impact tumor initiation or growth in vivo either in the polyclonal population or in monoclonal A549 cell lines (Fig. 3C). In the harvested tumor samples, macroautophagy inhibition was evident, and loss of ATG7 activity was complete with no detection of the ATG5–ATG12 conjugate in the monoclonal lines using an antibody specific to human ATG12 (Fig. 3D). Thus, two independent methods of macroautophagy inhibition failed to alter the growth of A549 and Panc 10.05 tumor xenografts, demonstrating that cancer cell-autonomous macroautophagy is dispensable for the tumorigenesis of these KRAS-mutated cell lines.
Macroautophagy Is Not Generally Cytoprotective for Clinical Oncology Therapies.
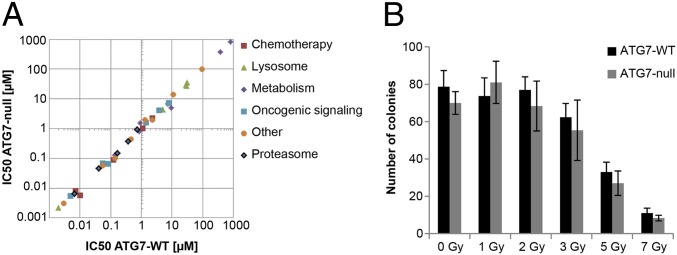
Induction of macroautophagy by cytotoxic agents used in chemotherapy has been reported to be cytoprotective (reviewed in refs. 36, 37). We therefore examined whether loss of ATG7 would result in sensitivity to clinically active anticancer agents and tested standard-of-care chemotherapies as well as mechanism-based inhibitors that affect processes that either are regulated by macroautophagy (nutrient metabolism, iron homeostasis, mitochondrial function) or demonstrate interactions with the autophagic pathways (proteasome, lysosome, oncogenic signaling and apoptosis). Notably, all drugs tested were equally cytotoxic to both wild-type and ATG7-deficient cells (Fig. 4A and Table S2). ATG7-deficient cells also were not sensitized to radiation treatment (Fig. 4B). The unchanged sensitivity resulting from ATG7 deletion suggests that macroautophagy is not a requisite cytoprotective response in vitro and also that autophagic cell death does not contribute to the cytotoxicity of these agents.
Fig. 4.
Autophagy is neither a cytoprotective nor a cytotoxic response to anticancer treatments. (A) A549 ATG7 wild-type (clone 20) or ATG7-null (clone 3) cells were treated with increasing concentrations of various chemotherapeutic agents for 5 d. Cells were fixed and stained with SRB. The IC50 value of each agent was calculated using GraphPad Prism. Each data point represents the IC50 of the ATG7 wild-type line plotted against the IC50 of the ATG7-null line. Individual IC50 values and drug identities are displayed in Table S2. (B) A549 ATG7 wild-type (clone 20) or ATG7-null (clone 3) cells were treated with the indicated amounts of radiation. After 10 d, the number of surviving colonies was quantified.
Table S2.
IC50 values of anticancer agents in A549 ATG7 wild-type and ATG7-null cell lines
| Compound | Inhibitor class | Target/pathway | ATG7-WT IC50, μM | ATG7-null IC50, μM | Conditions |
| 5-Fluorouracil | Chemotherapy | Thymidylate synthase | 1.116 | 0.991 | 10% FBS |
| Pemetrexed | Chemotherapy | Folate | 0.127 | 0.0884 | 10% dialyzed FBS |
| Raltitrexed | Chemotherapy | Folate | 0.0103 | 0.00567 | 10% dialyzed FBS |
| Cisplatin | Chemotherapy | DNA crosslinker | 2.33 | 2.168 | 2% FBS |
| Doxorubicin | Chemotherapy | DNA intercalator | 0.00721 | 0.00793 | 2% FBS |
| Bafilomycin A1 | Lysosome | Vacuolar H+ ATPase | 0.00194 | 0.00218 | 10% FBS |
| Terfenadine | Lysosome | Acid sphingomyleinase | 4.925 | 4.359 | 10% FBS |
| Amlodapine | Lysosome | Acid sphingomyleinase | 28.46 | 30.52 | 10% FBS |
| Desipramine | Lysosome | Acid sphingomyleinase | 30.08 | 26.92 | 10% FBS |
| Chloroquine | Lysosome | Lysosome | 30.76 | 36.31 | 10% FBS |
| AVN944 | Metabolism | IMPDH | 0.137 | 0.130 | 10% FBS |
| Mycophenolic acid | Metabolism | IMPDH | 0.855 | 0.803 | 10% FBS |
| 6-Diazo-5-oxo-l-norleucine | Metabolism | Glutamine analog | 9.451 | 4.99 | 10% FBS |
| BPTES | Metabolism | Glutaminase | 0.916 | 1.541 | 10% FBS |
| 2-Deoxyglucose | Metabolism | Glycolysis | 803.6 | 813.7 | 10% FBS |
| Phenformin | Metabolism | Oxidative phosphorylation | 7.459 | 6.816 | 2% FBS |
| Methyl-β-cyclodextrin | Metabolism | Cholesterol | 377.6 | 370 | 2% FBS |
| WYE-132 | Oncogenic Signaling | mTOR | 0.0559 | 0.0668 | 10% FBS |
| CCI-779 | Oncogenic Signaling | mTOR | 0.00493 | 0.00539 | 10% FBS |
| Sunitinib | Oncogenic Signaling | Multi-tyrosine kinase | 1.46 | 1.53 | 10% FBS |
| Erlotinib | Oncogenic Signaling | EGFR | 3.87 | 4.10 | 10% FBS |
| Gefitinib | Oncogenic Signaling | EGFR | 7.983 | 7.042 | 10% FBS |
| MLN-4924 | Oncogenic Signaling | NAE1 | 0.086 | 0.063 | 10% FBS |
| Vorinostat | Other | HDAC | 0.471 | 0.427 | 10% FBS |
| Entinostat | Other | HDAC | 11.25 | 13.46 | 10% FBS |
| Romidepsin | Other | HDAC | 0.00296 | 0.002997 | 10% FBS |
| Deferiprone | Other | Iron chelator | 97.72 | 97.39 | 10% FBS |
| Compound 1 | Other | Pan-E1 | 0.1408 | 0.1009 | 10% FBS |
| Cycloheximide | Other | Protein translation | 0.0563 | 0.0570 | 10% FBS |
| ABT-263 | Other | Bcl-2 | 2.36 | 1.92 | 10% FBS |
| MG-132 | Proteasome | 26S proteasome | 0.374 | 0.366 | 10% FBS |
| Salinosporamide | Proteasome | 20S proteasome | 0.76 | 0.898 | 10% FBS |
| Bortezomib | Proteasome | 26S proteasome | 0.0414 | 0.0453 | 10% FBS |
| Carfilzomib | Proteasome | 20S proteasome | 0.00687 | 0.00631 | 10% FBS |
| MLN-2238 | Proteasome | 20S proteasome | 0.171 | 0.145 | 10% FBS |
IC50 proliferation values in A549 ATG7-WT clone 20 and ATG7-null clone 3 cell lines. Inhibitor categorization of chemotherapeutic agents correspond to Fig. 4A. HDAC, histone deacetylase; IMPDH, inosine-5′-monophosphate dehydrogenase.
Chloroquine Inhibits Cell Proliferation Independently of Macroautophagy.
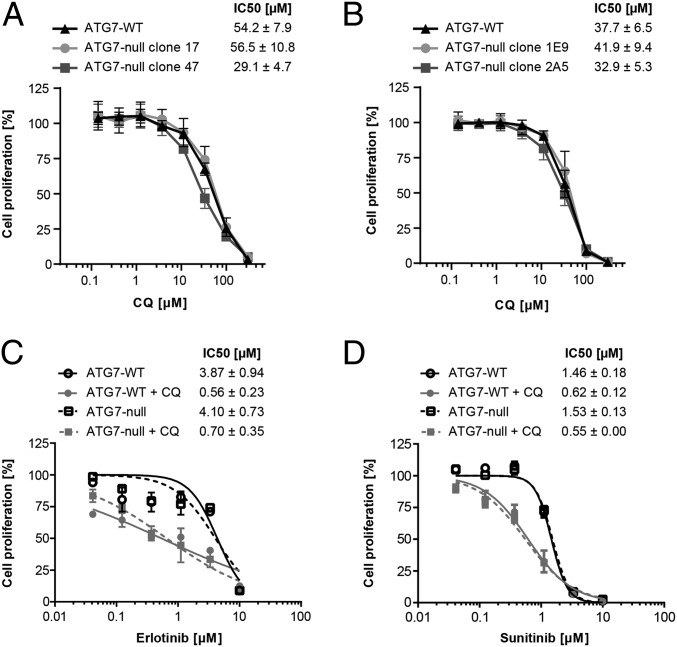
Chloroquine, part of the panel of anticancer drugs evaluated (Fig. 4A and Table S2), showed equivalent antiproliferative effects in wild-type and ATG7-deficient A549 cells. This result is surprising, given that chloroquine is broadly used as a chemical probe to investigate the cellular consequences of macroautophagy inhibition. We verified this finding in two additional cellular models and found that chloroquine similarly inhibited the proliferation of wild-type and ATG7-deficient Panc 10.05 and HCT116 cells (Fig. 5 A and B). Therefore, these results indicate that the antiproliferative effects of chloroquine can be dissociated from the inhibitory action of this compound on macroautophagy.
Fig. 5.
Chloroquine targets cancer cell proliferation and synergizes with tyrosine kinase inhibitors independently of macroautophagy. (A and B) Panc 10.05 (A) or HCT116 (B) ATG7 wild-type or ATG7-null cell lines were treated in 384-well format for 4 d with the indicated doses of chloroquine (CQ), and cell proliferation was measured using the CellTiter-Glo assay. Cell proliferation is depicted relative to vehicle-treated cells; data points represent mean ± SD from at least two independent experiments. (C and D) A549 ATG7 wild-type (clone 20) or ATG7-null (clone 3) cells were treated with increasing concentrations of erlotinib (C) or sunitinib (D) in the absence or presence of 4 μM chloroquine for 5–6 d. Cells were fixed and stained with SRB. Cell proliferation is depicted relative to vehicle-treated or chloroquine-treated cells; data points represent mean ± SEM from two independent experiments. Deletion of ATG7 did not significantly impact the sensitivity to erlotinib (P = 0.28) or sunitinib (P = 0.67). The addition of chloroquine significantly impacted the IC50 of both erlotinib (P < 0.0001) and sunitinib (P = 0.0001). ANOVA was performed using the generalized linear models procedure (PROC GLM) of SAS version 9.4.
Chloroquine and its analogs are currently being evaluated in clinical trials in combination regimens with other anticancer agents. To determine whether the combinatorial activity of chloroquine is dependent on macroautophagy inhibition, we tested chloroquine in wild-type and ATG7-deficient cells in combination with erlotinib and sunitinib, two tyrosine kinase inhibitors previously reported to synergize with chloroquine (38, 39). Chloroquine, but not ATG7 deficiency, sensitized cells to both erlotinib and sunitinib (Fig. 5 C and D). The extent of synergy was similar in both wild-type and ATG7-deficient cells. These findings support the continued clinical assessment of chloroquine combinations for cancer therapy but indicate that inhibition of autophagy may not be a relevant mechanism of action for chloroquine in these combinations.
Discussion
There has been much interest in the concept that oncogenic KRAS-dependent tumors are vulnerable to autophagy inhibition (19, 20). The present study raises significant questions regarding the assumption that oncogenic KRAS confers a cell-autonomous sensitivity to macroautophagy inhibition, because our unbiased profiling of 47 human cancer lines revealed that KRAS mutation status does not predict efficacy to macroautophagy inhibition. Furthermore, we demonstrate that deletion of ATG7 effectively blocks macroautophagy in several KRAS-dependent cancer lines but does not inhibit cell growth in vitro and in vivo.
In contrast to the tumor cell-autonomous inhibition of macroautophagy studied in the present report, previous studies in genetically modified mice were performed in the setting of ATG7 loss in both the tumor and normal host cells and demonstrated reduced growth of KRAS-driven lung and pancreatic tumors (22–26). Hence, it is possible that the suppressive effect of ATG7 deficiency on tumor growth reflects a primary effect on the ability of macroautophagy in host tissues to support tumor growth. Indeed, previous studies indicated that macroautophagy in stromal cells provides nutrients that support the growth of macroautophagy-deficient tumor cells under nutrient-limiting conditions (40). Additionally, up-regulation of macroautophagy in stromal cells could diminish p62 levels, perhaps resulting in enhanced proliferation and invasion of tumor cells mediated by stromal IL-6 production (41).
Immunosurveillance, which was absent in our immune-compromised mouse models, also may impact the host response to autophagy-deficient tumor cells. Increased infiltration of effector T cells in response to cytokine production in macroautophagy-deficient tumors (42, 43), and cytotoxic T lymphocyte-mediated cell death, observed in macroautophagy-deficient hypoxic cells (44), may contribute to immune-mediated tumor clearance in the setting of autophagy inhibition. Conversely, inhibition of autophagy in tumor cells may hamper the antitumor immune response by suppressing major histocompatibility complex-dependent antigen presentation (45), recruitment of immunosuppressive regulatory T cells (24), or inhibition of immunostimulatory ATP release after chemotherapy (46). Hence, although our findings do not rule out the possibility that pharmacological inhibitors of macroautophagy might have therapeutic benefits in cancer patients, they do suggest that tumor cell-intrinsic macroautophagy is not a key driver of KRAS-dependent tumor growth. Future studies will be needed to evaluate the contribution of factors such as stromal cells or immunosurveillance on the potential impact of macroautophagy inhibitors.
Our study also questions the role of autophagy in the antitumor activity of chloroquine. KRAS mutant cells did not exhibit enhanced sensitivity to the chloroquine analog Lys01, extending previous findings that chloroquine sensitivity does not correlate with KRAS mutation status in nonsmall cell lung cancer (47). Furthermore, we found that the antiproliferative effects of chloroquine in our cell models are independent of macroautophagy, because in multiple ATG7-deficient tumor cell lines with undetectable macroautophagic flux the sensitivity to chloroquine was equivalent to that of their parental counterparts. Chloroquine and its derivatives increase lysosomal pH and decrease lysosome-dependent catabolism. Although inhibition of lysosomal function by chloroquine does inhibit macroautophagy, our results in ATG7-deficient cell lines strongly suggest that inhibition of macroautophagy is not responsible for the antiproliferative effects and question the use of chloroquine as a tool for interrogating the effect of macroautophagy inhibition in cancer.
Interestingly, chloroquine, but not the loss of ATG7, synergized with certain tyrosine kinase inhibitors. Synergy between erlotinib and chloroquine has been observed previously (38, 48, 49) and could be caused by decreased lysosomal degradation of EGFR by chloroquine. Additionally, chloroquine-induced changes in lysosomal pH could reduce the lysosomal sequestration of lysosomotropic kinase inhibitors (such as sunitinib), resulting in an increased cytosolic drug concentration and enhanced inhibition of extralysosomal drug targets (50).
In summary, the results of this study demonstrate that chloroquine inhibits cell growth and sensitizes cells to select targeted therapies but does not do so by inhibiting macroautophagy. The mechanism of chloroquine’s antiproliferative effects may be multifactorial and could include defects in DNA synthesis and repair (51, 52), inhibition of topoisomerases (53), and mitochondrial membrane permeabilization (54) that may occur independently or as a consequence of lysosomal inhibition. Additional studies will be needed to define the antitumor mechanisms of chloroquine and related drugs and to identify predictive markers of tumor responsiveness to these agents in clinical studies.
Materials and Methods
All activities involving laboratory animals were carried out in strict accordance with federal, state, local, and institutional guidelines governing the use of laboratory animals in research and were reviewed and approved by the Pfizer or Novartis Institutional Animal Care and Use Committee.
Pooled shRNA Screening.
The design and construction of the DECODER shRNA library, viral packaging, infection, and proliferation-based pooled shRNA screening have been described previously (32). Analysis of the DECODER shRNA library screen was performed by calculating redundant siRNA activity (RSA) and Z score values after inclusion of the ULK1, ATG7, and VPS34 hairpins with the previously described epigenome and positive-control shRNAs (32). The GFP-p62 pooled shRNA screen is described in SI Materials and Methods.
Cell Line Generation.
HCT116 and Panc 10.05 ATG7-null clones were generated by cotransfecting plasmids encoding ATG7 CompoZr knockout zinc finger nucleases (CKOZFND1218; Sigma) and EGFP using FuGENE6 (Promega). At 24 h after transfection, GFP+ single cells were sorted into 96-well plates using the ARIA II flow cytometer (BD Biosciences), and clonal lines were expanded. ATG7-null clones were identified by screening clones for the absence of ATG7 protein by Western blotting. ATG7 rescue lines were generated by lentiviral-mediated delivery of pLenti6/V5-d-TOPO (ATG7) and pLenti6/V5-d-TOPO (ATG7C572A) followed by selection for stable integration using blasticidin. Panc 10.05 cells with DOX-inducible expression of ATG4BC74A were generated by lentiviral-mediated delivery of pLKO-TREX-On (HA-ATG4BC74A) followed by selection for stable integration using puromycin.
A549 and PaTu-8988T ATG7-null cell lines were generated using TALEN genomic editing. TALENs targeting ATG7 and a surrogate GFP reporter vector (for detection of TALEN endonuclease activity) were obtained from PNA BIO, Inc. ATG7-null A549 cells were generated by transient transfection of the TALEN pair and the GFP reporter with Lipofectamine 2000 and the isolation of the GFP+ population. Monoclonal cell lines were generated by single-cell sorting into a 96-well plate. Cell lines were screened for ATG7 loss by Western blotting. Inducible PaTu-8988T ATG7-null cells were generated by sequential stable transfection with plasmids encoding the tetracycline-repressor and left- and right-arm TALENs under a DOX-inducible promoter. After selection, single cells were sorted into 96-well plates to generate monoclonal populations. Nonpaired TALENs targeting ATG7 were used to generate the PaTu-8988T negative control cell lines. To promote induction of ATG7 loss, cells were treated with 10 ng/mL DOX for 4 d, after which DOX was removed for >4 d. Cells were used subsequently for biochemical or proliferation assays.
Details regarding reagents, mammalian cell culture, immunoblotting, in vitro growth assays, amino acid starvation assays, and in vivo xenograft studies can be found in SI Materials and Methods.
SI Materials and Methods
Reagents.
The following antibodies were used: ATG4B (Cell Signaling Technology), ATG5 (Cell Signaling Technology and Epitomics), ATG7 (Cell Signaling Technology), human-specific ATG12 (Cell Signaling Technology), GAPDH (Cell Signaling Technology), HA (Covance), LC3 (Novus Biologicals), p62 (BD Transduction Laboratories), and Vinculin (Sigma). The following chemicals were used: DMSO (Sigma), bafilomycin A1 (Tocris and EMD Millipore), chloroquine diphosphate (Tokyo Chemical Industry and Sigma), DOX (Clontech and Sigma), sulforhodamine B sodium salt (Sigma). Lys01 [N2-(7-Chloro-4-quinolinyl)-N1-[2-[(7-chloro-4-quinolinyl)amino]ethyl]-N1-methyl-1,2-ethanediamine] was synthesized at GVK Biosciences. The following plasmid was used: pLKO-TREX-On (HA-ATG4BC74A) (33). The ATG7 construct was generated by cloning full-length ATG7 cDNA into pLenti6/V5-d-TOPO (Invitrogen). The ATG7C572A mutant was generated by the QuikChange II XL Site-Directed Mutagenesis Kit (Stratagene).
Mammalian Cell Culture.
All cells were cultured in a humidified incubator at 37 °C and 5% CO2. Cell culture reagents were obtained from Invitrogen unless otherwise specified. Panc 10.05 cells (CRL-2547; ATCC) were maintained in RMPI 1640 supplemented with 10% (vol/vol) FBS. HCT116 (CCL-247; ATCC) and A549 (CCL-185; ATCC) cells were maintained in DMEM supplemented with 10% (vol/vol) FBS. PaTu-8988T cells (ACC162; Deutsche Sammlung von Mikroorganismen und Zellkulturen) were maintained in DMEM with 5% (vol/vol) HI-FBS and 5% (vol/vol) horse serum. H4 Tet-Off GFP-p62 cells (33) were maintained in DMEM supplemented with 10% (vol/vol) Tet system-approved FBS (Clontech).
Cell Line Profiling.
Cell lines (www.broadinstitute.org/ccle) were maintained in humidified incubators at 37 °C and 5% CO2 in DMEM or RPMI 1640 supplemented with 10% (vol/vol) FBS. Cells were seeded into 1,536-well plates, were allowed to adhere for 12–24 h, and then were treated with an 11-point concentration-response of Lys01 with a maximal final concentration of 30 μM. Each compound concentration was tested in duplicate. After 72 h, cell proliferation was assessed relative to 0.4% DMSO (0%) and 1 μM MG132 (100%) using CellTiter-Glo (Promega), and IC50 values were determined from a curve fitted to duplicate 11-point concentration-response datasets from two independent assay plates.
Pooled shRNA Screening.
For FACS-based GFP-p62 pooled shRNA screening, 20 million H4 Tet-Off GFP-p62 cells were infected with the DECODER shRNA library using lentiviral particles at a multiplicity of infection of 0.8. Cells were expanded for 4 d and then treated for 24 h with 100 ng/mL DOX to turn off GFP-p62 reporter synthesis. Cells were harvested by trypsinization and subjected to FACS sorting using a BD FACSAria II Cell Sorter (BD Biosciences). FACS gates were set to select single, RFP+ cells, and 5–10 million cells falling into the quarter with highest GFP intensity (GFP HIGH) or into the quarter with lowest GFP intensity (GFP LOW) were sorted. Genomic DNA was isolated from the GFP HIGH or GFP LOW cell populations, shRNA counts were quantified by next-generation sequencing, and enrichment in GFP HIGH versus GFP LOW cells calculated per gene using RSA as described previously (32).
Immunoblotting.
For Panc 10.05 and HCT116 samples, cells were lysed in radio immunoprecipitation assay (RIPA) lysis buffer supplemented with protease inhibitors (Sigma). Tumor tissue lysates were prepared in T-PER tissue protein extraction buffer (Thermo Scientific) supplemented with protease and phosphatase inhibitors (Sigma) using a Retsch MM300 TissueLyser (Qiagen). Frozen tissues of 50–100 mg were suspended in 500 μL lysis buffer with steel beads, homogenized three times for 30 s at a frequency of 30/s, and then cleared by centrifugation at 13,000 × g for 15 min at 4 °C. Protein concentrations were quantified using the DC protein assay kit (Bio-Rad) and SDS/PAGE, and immunoblotting was performed as described previously (33). For A549 and PaTu-8988T in vitro samples, total cellular lysates were prepared using NuPAGE-LDS sample buffer (Life Technologies). Cell lysates were water-bath sonicated four times for 30 s each time with the amplitude set at 25% (Qsonica Sonicator). To analyze A549-derived tumor samples, tissue extracts were prepared in RIPA buffer (Teknova) supplemented with protease and phosphatase inhibitor mixtures (Calbiochem). Homogenized samples were sonicated continuously for 3 min and then were cleared by centrifugation for 10 min at 500 × g at 4 °C. Protein concentrations were quantified using the RC DC protein assay kit (Bio-Rad). Equal amounts of proteins were subjected to immunoblotting analysis using the NuPAGE electrophoresis system. Immunoblots were probed with primary and secondary antibodies following the manufacturer’s instructions and were detected using HRP chemiluminescent substrate (Life Technologies).
In Vitro Growth Assays.
For Panc 10.05 and HCT116 assays, cells were plated in 96- or 384-well plates, and cell growth was determined at the indicated times using CellTiter-Glo (Promega) or by measuring cell confluence using the IncuCyte imaging system (Essen Bioscience). For compound treatments, cells were treated 1 d after plating with the indicated doses of chloroquine, Lys01, or vehicle control. For ATG4BC74A induction, cells were treated 1 d after plating with DOX, and DOX was replenished every 2–3 d. For A549 and PaTu-8988T proliferation assays, equal cell numbers were plated in multiwell dishes, and after 4 d cells were counted by Trypan Blue exclusion or were fixed and analyzed by SRB (Sigma) staining as described previously (55). For single-agent drug treatments, cells were plated in 96-well dishes and, beginning on the next day, were treated with the indicated concentrations of drug for 5 d. For combination treatments, cells were pretreated with 4 μM chloroquine (the concentration calculated to achieve 15% growth inhibition) for 5 h, followed by the addition of tyrosine kinase inhibitors. After 5–6 d of treatment, cells were fixed and quantified by staining with SRB. IC50 values were calculated by GraphPad Prism using the least squares method.
Amino Acid Starvation Assay.
Panc 10.05 cells were plated into six-well plates, were allowed to adhere for 24 h, and then were cultured for 5 d in RPMI 1640 supplemented with 10% (vol/vol) FBS or were starved for 3 d in HBSS (Invitrogen) followed by 2 d of recovery in RPMI 1640 supplemented with 10% (vol/vol)FBS. Colonies were fixed and stained in PBS containing 0.2% Crystal Violet (Fisher Scientific) and 4% formalin. A549 cells were plated in six-well dishes, were allowed to adhere for 24 h, and then were cultured in either serum-containing medium for 3 d or were starved in HBSS for 5 d. After HBSS starvation, cells were allowed to recover in growth medium for 6 d before fixing and staining with SRB.
In Vivo Xenograft Study.
All activities involving laboratory animals were carried out in strict accordance with federal, state, local, and institutional guidelines governing the use of laboratory animals in research and were reviewed and approved by Pfizer or Novartis Institutional Animal Care and Use Committee. To assess growth in vivo, Panc 10.05 xenograft tumors were grown in female Fox Chase SCID Beige mice (Charles River Laboratories). Cells were implanted s.c. in 8-wk-old mice at 2 × 10⁶ cells per mouse. Tumor volume was determined by caliper measurements obtained in two dimensions and was calculated as width2 × length/2. When mean tumor volume reached 150 mm3, some animals were switched to food containing DOX (Mod LabDiet 5053 with 400 ppm DOX). Tumor volume and animal weight were determined every 3 or 4 d. For A549 studies, tumorigenicity of ATG7 wild-type cells (monoclonal and polyclonal populations) was compared that of with ATG7-null cells (monoclonal and polyclonal populations) in vivo. Athymic nu/nu mice were injected s.c. with one million cells in Matrigel (BD Biosciences). Tumor growth was monitored twice weekly using calipers. Once tumors reached ∼500 mm3, representative tumors from each group were excised and lysed for immunoblot analysis. Tumor measurements were continued until tumors reached >1,000 mm3.
Acknowledgments
We thank Felipa Mapa, Howard Miller, Jessi Ambrose, Peter Aspesi, and Nathan Ross for performing the Lys01 cell line profiling; Johnny Yao, Vlad Buklan, and Roger Conant for collection of the A549 tumor samples; and Charles Tan for statistical analysis.
Footnotes
Conflict of interest statement: C.H.E., L.T.-B., L.L., J.L., and R.T.A. are employees of Pfizer. Z.W., S.L., S.L.F., E.G., E.F., N.C., R.D.J., G.M., G.R.H., L.O.M., and B.N. are employees of Novartis. K.B. is an employee of Regeneron.
This article is a PNAS Direct Submission.
This article contains supporting information online at www.pnas.org/lookup/suppl/doi:10.1073/pnas.1515617113/-/DCSupplemental.
References
- 1.Ichimura Y, et al. A ubiquitin-like system mediates protein lipidation. Nature. 2000;408(6811):488–492. doi: 10.1038/35044114. [DOI] [PubMed] [Google Scholar]
- 2.Johansen T, Lamark T. Selective autophagy mediated by autophagic adapter proteins. Autophagy. 2011;7(3):279–296. doi: 10.4161/auto.7.3.14487. [DOI] [PMC free article] [PubMed] [Google Scholar]
- 3.Stolz A, Ernst A, Dikic I. Cargo recognition and trafficking in selective autophagy. Nat Cell Biol. 2014;16(6):495–501. doi: 10.1038/ncb2979. [DOI] [PubMed] [Google Scholar]
- 4.Begun J, Xavier RJ. Autophagy at the crossroads of metabolism and cellular defense. Curr Opin Gastroenterol. 2013;29(6):588–596. doi: 10.1097/MOG.0b013e328365d34d. [DOI] [PubMed] [Google Scholar]
- 5.Mizushima N, Levine B, Cuervo AM, Klionsky DJ. Autophagy fights disease through cellular self-digestion. Nature. 2008;451(7182):1069–1075. doi: 10.1038/nature06639. [DOI] [PMC free article] [PubMed] [Google Scholar]
- 6.Komatsu M, et al. Impairment of starvation-induced and constitutive autophagy in Atg7-deficient mice. J Cell Biol. 2005;169(3):425–434. doi: 10.1083/jcb.200412022. [DOI] [PMC free article] [PubMed] [Google Scholar]
- 7.Kuma A, et al. The role of autophagy during the early neonatal starvation period. Nature. 2004;432(7020):1032–1036. doi: 10.1038/nature03029. [DOI] [PubMed] [Google Scholar]
- 8.Degenhardt K, et al. Autophagy promotes tumor cell survival and restricts necrosis, inflammation, and tumorigenesis. Cancer Cell. 2006;10(1):51–64. doi: 10.1016/j.ccr.2006.06.001. [DOI] [PMC free article] [PubMed] [Google Scholar]
- 9.Hippert MM, O’Toole PS, Thorburn A. Autophagy in cancer: Good, bad, or both? Cancer Res. 2006;66(19):9349–9351. doi: 10.1158/0008-5472.CAN-06-1597. [DOI] [PubMed] [Google Scholar]
- 10.White E, DiPaola RS. The double-edged sword of autophagy modulation in cancer. Clin Cancer Res. 2009;15(17):5308–5316. doi: 10.1158/1078-0432.CCR-07-5023. [DOI] [PMC free article] [PubMed] [Google Scholar]
- 11.Galluzzi L, et al. Autophagy in malignant transformation and cancer progression. EMBO J. 2015;34(7):856–880. doi: 10.15252/embj.201490784. [DOI] [PMC free article] [PubMed] [Google Scholar]
- 12.Takamura A, et al. Autophagy-deficient mice develop multiple liver tumors. Genes Dev. 2011;25(8):795–800. doi: 10.1101/gad.2016211. [DOI] [PMC free article] [PubMed] [Google Scholar]
- 13.Liang XH, et al. Induction of autophagy and inhibition of tumorigenesis by beclin 1. Nature. 1999;402(6762):672–676. doi: 10.1038/45257. [DOI] [PubMed] [Google Scholar]
- 14.Qu X, et al. Promotion of tumorigenesis by heterozygous disruption of the beclin 1 autophagy gene. J Clin Invest. 2003;112(12):1809–1820. doi: 10.1172/JCI20039. [DOI] [PMC free article] [PubMed] [Google Scholar]
- 15.Cicchini M, et al. Autophagy regulator BECN1 suppresses mammary tumorigenesis driven by WNT1 activation and following parity. Autophagy. 2014;10(11):2036–2052. doi: 10.4161/auto.34398. [DOI] [PMC free article] [PubMed] [Google Scholar]
- 16.Elgendy M, Sheridan C, Brumatti G, Martin SJ. Oncogenic Ras-induced expression of Noxa and Beclin-1 promotes autophagic cell death and limits clonogenic survival. Mol Cell. 2011;42(1):23–35. doi: 10.1016/j.molcel.2011.02.009. [DOI] [PubMed] [Google Scholar]
- 17.Shin JY, Hong SH, Kang B, Minai-Tehrani A, Cho MH. Overexpression of beclin1 induced autophagy and apoptosis in lungs of K-rasLA1 mice. Lung Cancer. 2013;81(3):362–370. doi: 10.1016/j.lungcan.2013.05.009. [DOI] [PubMed] [Google Scholar]
- 18.Yoo BH, et al. Oncogenic ras-induced down-regulation of autophagy mediator Beclin-1 is required for malignant transformation of intestinal epithelial cells. J Biol Chem. 2010;285(8):5438–5449. doi: 10.1074/jbc.M109.046789. [DOI] [PMC free article] [PubMed] [Google Scholar]
- 19.Guo JY, et al. Activated Ras requires autophagy to maintain oxidative metabolism and tumorigenesis. Genes Dev. 2011;25(5):460–470. doi: 10.1101/gad.2016311. [DOI] [PMC free article] [PubMed] [Google Scholar]
- 20.Yang S, et al. Pancreatic cancers require autophagy for tumor growth. Genes Dev. 2011;25(7):717–729. doi: 10.1101/gad.2016111. [DOI] [PMC free article] [PubMed] [Google Scholar]
- 21.Kim MJ, et al. Involvement of autophagy in oncogenic K-Ras-induced malignant cell transformation. J Biol Chem. 2011;286(15):12924–12932. doi: 10.1074/jbc.M110.138958. [DOI] [PMC free article] [PubMed] [Google Scholar]
- 22.Guo JY, et al. Autophagy suppresses progression of K-ras-induced lung tumors to oncocytomas and maintains lipid homeostasis. Genes Dev. 2013;27(13):1447–1461. doi: 10.1101/gad.219642.113. [DOI] [PMC free article] [PubMed] [Google Scholar]
- 23.Karsli-Uzunbas G, et al. Autophagy is required for glucose homeostasis and lung tumor maintenance. Cancer Discov. 2014;4(8):914–927. doi: 10.1158/2159-8290.CD-14-0363. [DOI] [PMC free article] [PubMed] [Google Scholar]
- 24.Rao S, et al. A dual role for autophagy in a murine model of lung cancer. Nat Commun. 2014;5:3056. doi: 10.1038/ncomms4056. [DOI] [PubMed] [Google Scholar]
- 25.Rosenfeldt MT, et al. p53 status determines the role of autophagy in pancreatic tumour development. Nature. 2013;504(7479):296–300. doi: 10.1038/nature12865. [DOI] [PubMed] [Google Scholar]
- 26.Yang A, et al. Autophagy is critical for pancreatic tumor growth and progression in tumors with p53 alterations. Cancer Discov. 2014;4(8):905–913. doi: 10.1158/2159-8290.CD-14-0362. [DOI] [PMC free article] [PubMed] [Google Scholar]
- 27.Perera RM, et al. Transcriptional control of autophagy-lysosome function drives pancreatic cancer metabolism. Nature. 2015;524(7565):361–365. doi: 10.1038/nature14587. [DOI] [PMC free article] [PubMed] [Google Scholar]
- 28.Cox AD, Fesik SW, Kimmelman AC, Luo J, Der CJ. Drugging the undruggable RAS: Mission possible? Nat Rev Drug Discov. 2014;13(11):828–851. doi: 10.1038/nrd4389. [DOI] [PMC free article] [PubMed] [Google Scholar]
- 29.McAfee Q, et al. Autophagy inhibitor Lys05 has single-agent antitumor activity and reproduces the phenotype of a genetic autophagy deficiency. Proc Natl Acad Sci USA. 2012;109(21):8253–8258. doi: 10.1073/pnas.1118193109. [DOI] [PMC free article] [PubMed] [Google Scholar]
- 30.Amaravadi RK, et al. Principles and current strategies for targeting autophagy for cancer treatment. Clin Cancer Res. 2011;17(4):654–666. doi: 10.1158/1078-0432.CCR-10-2634. [DOI] [PMC free article] [PubMed] [Google Scholar]
- 31.Barretina J, et al. The Cancer Cell Line Encyclopedia enables predictive modelling of anticancer drug sensitivity. Nature. 2012;483(7391):603–607. doi: 10.1038/nature11003. [DOI] [PMC free article] [PubMed] [Google Scholar]
- 32.Hoffman GR, et al. Functional epigenetics approach identifies BRM/SMARCA2 as a critical synthetic lethal target in BRG1-deficient cancers. Proc Natl Acad Sci USA. 2014;111(8):3128–3133. doi: 10.1073/pnas.1316793111. [DOI] [PMC free article] [PubMed] [Google Scholar]
- 33.Dowdle WE, et al. Selective VPS34 inhibitor blocks autophagy and uncovers a role for NCOA4 in ferritin degradation and iron homeostasis in vivo. Nat Cell Biol. 2014;16(11):1069–1079. doi: 10.1038/ncb3053. [DOI] [PubMed] [Google Scholar]
- 34.Hofmann I, et al. K-RAS mutant pancreatic tumors show higher sensitivity to MEK than to PI3K inhibition in vivo. PLoS One. 2012;7(8):e44146. doi: 10.1371/journal.pone.0044146. [DOI] [PMC free article] [PubMed] [Google Scholar]
- 35.Fujita N, et al. An Atg4B mutant hampers the lipidation of LC3 paralogues and causes defects in autophagosome closure. Mol Biol Cell. 2008;19(11):4651–4659. doi: 10.1091/mbc.E08-03-0312. [DOI] [PMC free article] [PubMed] [Google Scholar]
- 36.Janku F, McConkey DJ, Hong DS, Kurzrock R. Autophagy as a target for anticancer therapy. Nat Rev Clin Oncol. 2011;8(9):528–539. doi: 10.1038/nrclinonc.2011.71. [DOI] [PubMed] [Google Scholar]
- 37.Maes H, Rubio N, Garg AD, Agostinis P. Autophagy: Shaping the tumor microenvironment and therapeutic response. Trends Mol Med. 2013;19(7):428–446. doi: 10.1016/j.molmed.2013.04.005. [DOI] [PubMed] [Google Scholar]
- 38.Han W, et al. EGFR tyrosine kinase inhibitors activate autophagy as a cytoprotective response in human lung cancer cells. PLoS One. 2011;6(6):e18691. doi: 10.1371/journal.pone.0018691. [DOI] [PMC free article] [PubMed] [Google Scholar]
- 39.Abdel-Aziz AK, Shouman S, El-Demerdash E, Elgendy M, Abdel-Naim AB. Chloroquine synergizes sunitinib cytotoxicity via modulating autophagic, apoptotic and angiogenic machineries. Chem Biol Interact. 2014;217:28–40. doi: 10.1016/j.cbi.2014.04.007. [DOI] [PubMed] [Google Scholar]
- 40.Capparelli C, et al. Autophagy and senescence in cancer-associated fibroblasts metabolically supports tumor growth and metastasis via glycolysis and ketone production. Cell Cycle. 2012;11(12):2285–2302. doi: 10.4161/cc.20718. [DOI] [PMC free article] [PubMed] [Google Scholar]
- 41.Valencia T, et al. Metabolic reprogramming of stromal fibroblasts through p62-mTORC1 signaling promotes inflammation and tumorigenesis. Cancer Cell. 2014;26(1):121–135. doi: 10.1016/j.ccr.2014.05.004. [DOI] [PMC free article] [PubMed] [Google Scholar]
- 42.Lévy J, et al. Intestinal inhibition of Atg7 prevents tumour initiation through a microbiome-influenced immune response and suppresses tumour growth. Nat Cell Biol. 2015;17(8):1062–1073. doi: 10.1038/ncb3206. [DOI] [PubMed] [Google Scholar]
- 43.Wei H, et al. Suppression of autophagy by FIP200 deletion inhibits mammary tumorigenesis. Genes Dev. 2011;25(14):1510–1527. doi: 10.1101/gad.2051011. [DOI] [PMC free article] [PubMed] [Google Scholar]
- 44.Noman MZ, et al. Blocking hypoxia-induced autophagy in tumors restores cytotoxic T-cell activity and promotes regression. Cancer Res. 2011;71(18):5976–5986. doi: 10.1158/0008-5472.CAN-11-1094. [DOI] [PubMed] [Google Scholar]
- 45.Li Y, et al. Efficient cross-presentation depends on autophagy in tumor cells. Cancer Res. 2008;68(17):6889–6895. doi: 10.1158/0008-5472.CAN-08-0161. [DOI] [PMC free article] [PubMed] [Google Scholar]
- 46.Michaud M, et al. Autophagy-dependent anticancer immune responses induced by chemotherapeutic agents in mice. Science. 2011;334(6062):1573–1577. doi: 10.1126/science.1208347. [DOI] [PubMed] [Google Scholar]
- 47.Morgan MJ, et al. Regulation of autophagy and chloroquine sensitivity by oncogenic RAS in vitro is context-dependent. Autophagy. 2014;10(10):1814–1826. doi: 10.4161/auto.32135. [DOI] [PMC free article] [PubMed] [Google Scholar]
- 48.Li YY, Lam SK, Mak JC, Zheng CY, Ho JC. Erlotinib-induced autophagy in epidermal growth factor receptor mutated non-small cell lung cancer. Lung Cancer. 2013;81(3):354–361. doi: 10.1016/j.lungcan.2013.05.012. [DOI] [PubMed] [Google Scholar]
- 49.Zou Y, et al. The autophagy inhibitor chloroquine overcomes the innate resistance of wild-type EGFR non-small-cell lung cancer cells to erlotinib. Journal of Thoracic Oncology: Official Publication of the International Association for the Study of Lung Cancer. 2013;8(6):693–702. doi: 10.1097/JTO.0b013e31828c7210. [DOI] [PMC free article] [PubMed] [Google Scholar]
- 50.Fu D, et al. Imaging the intracellular distribution of tyrosine kinase inhibitors in living cells with quantitative hyperspectral stimulated Raman scattering. Nat Chem. 2014;6(7):614–622. doi: 10.1038/nchem.1961. [DOI] [PMC free article] [PubMed] [Google Scholar]
- 51.Michael RO, Williams GM. Chloroquine inhibition of repair of DNA damage induced in mammalian cells by methyl methanesulfonate. Mutat Res. 1974;25(3):391–396. doi: 10.1016/0027-5107(74)90068-2. [DOI] [PubMed] [Google Scholar]
- 52.Field RC, Gibson BR, Holbrook DJ, Jr, McCall BM. Inhibition of precursor incorporation into nucleic acids of mammalian tissues by antimalarial aminoquinolines. Br J Pharmacol. 1978;62(2):159–164. doi: 10.1111/j.1476-5381.1978.tb08440.x. [DOI] [PMC free article] [PubMed] [Google Scholar]
- 53.Sorensen M, Sehested M, Jensen PB. pH-dependent regulation of camptothecin-induced cytotoxicity and cleavable complex formation by the antimalarial agent chloroquine. Biochem Pharmacol. 1997;54(3):373–380. doi: 10.1016/s0006-2952(97)80318-8. [DOI] [PubMed] [Google Scholar]
- 54.Boya P, et al. Mitochondrial membrane permeabilization is a critical step of lysosome-initiated apoptosis induced by hydroxychloroquine. Oncogene. 2003;22(25):3927–3936. doi: 10.1038/sj.onc.1206622. [DOI] [PubMed] [Google Scholar]
- 55.Vichai V, Kirtikara K. Sulforhodamine B colorimetric assay for cytotoxicity screening. Nat Protoc. 2006;1(3):1112–1116. doi: 10.1038/nprot.2006.179. [DOI] [PubMed] [Google Scholar]


