

Abstract
Background
Cancer is increasingly common among HIV patients given improved survival.
Objective
To examine calendar trends in cumulative cancer incidence and hazard rate by HIV status.
Design
Cohort study
Setting
North American AIDS Cohort Collaboration on Research and Design during 1996–2009
Patients
86,620 HIV-infected and 196,987 uninfected adults
Measurements
We estimated cancer-type-specific cumulative incidence by age 75 years by HIV status and calendar era, and examined calendar trends in cumulative incidence and hazard rates.
Results
Cumulative incidences (%) of cancer by age 75 (HIV+/HIV−) were: Kaposi sarcoma (KS), 4.4/0.01; non-Hodgkin’s lymphoma (NHL), 4.5/0.7; lung, 3.4/2.8; anal, 1.5/0.1; colorectal, 1.0/1.5; liver, 1.1/0.4; Hodgkin lymphoma (HL), 0.9/0.1; melanoma, 0.5/0.6; and oral cavity/pharyngeal, 0.8/0.8. Among HIV-infected subjects, we observed decreasing calendar trends in cumulative incidence and hazard rate for KS and NHL. For anal, colorectal and liver cancers, increasing cumulative incidence, but not hazard rate trends, were due to the decreasing mortality rate trend (−9% per year), allowing greater opportunity to be diagnosed with these cancer types. Despite decreasing hazard rate trends for lung, HL, and melanoma, we did not observe cumulative incidence trends due to the compensating effect of the declining mortality rate on cumulative incidence.
Limitations
Secular trends in screening, smoking, and viral co-infections were not evaluated.
Conclusions
Our analytic approach helped disentangle the effects of improved survival and changing cancer-specific hazard rates on cumulative incidence trends among HIV patients. Cumulative cancer incidence by age 75, approximating lifetime risk in HIV patients, may have clinical utility in this population. The high cumulative incidences by age 75 for KS, NHL, and lung cancer supports early and sustained ART and smoking cessation.
Primary Funding Source
National Institutes of Health
INTRODUCTION
Antiretroviral therapy (ART) has prolonged the lifespan of HIV-infected patients (1, 2), resulting in an increasing number of individuals aging with HIV infection (3). Cancer (4) is increasingly common in this population, with a higher burden compared with the general population due to both impaired immune function including chronic inflammation (4–12) and a higher prevalence of risk factors including smoking (13–16) and viral co-infections (17–19). Among HIV-infected persons, the incidence of AIDS-defining cancers (ADC), primarily Kaposi sarcoma (KS) and non-Hodgkin’s lymphoma (NHL), has declined substantially in the ART era, but remains elevated compared with uninfected persons (20, 21). Furthermore, several non-AIDS-defining cancers (NADC), including Hodgkin lymphoma (HL) and lung, anal, and oral cavity/pharyngeal (OP) cancers, have also exhibited elevated incidence in HIV-infected persons (10, 22–26).
Calendar-era trends in cancer incidence among HIV-infected persons have been evaluated using several metrics, including numbers of cases (4), incidence rates (4, 27, 28), and cumulative incidence (20). While the number of cases of virtually all NADC types has increased due to the growth and aging of the HIV-infected population (4), there have been inconsistent cancer-type-specific incidence rate trends (Appendix Table 1). One reason for the inconsistent results may be that only one prior study (20) has explicitly accounted for the competing risk of death, which is germane given both the higher mortality risk for HIV patients compared with the general population, and the dramatic improvements in survival over time for HIV patients on ART.
Here, our primary objective was to compare time trends in cumulative cancer incidence in HIV-infected and uninfected persons. We used competing risk methods to evaluate trends in both cumulative incidence (29) and cancer-specific hazard rates (30) to provide a more complete understanding of the reasons for observed changes in cancer risk over time, which could be influenced by both the incidence rate of the cancer of interest and the all-cause mortality rate (31, 32). In addition, we report cumulative cancer incidence (i.e., cancer risk) by age 75 years, a measure that may have clinical and public health utility in this population since 75 years approximates the current lifespan for effectively treated HIV-infected adults (1). This metric may be a more intuitive measure of cancer burden than the incidence rate, and thus may have greater clinical utility.
METHODS
Study design, setting and subjects
Our objective was to estimate the cumulative incidence of nine common cancers by HIV status and calendar period. The study population consisted of adults (≥ 18 years) followed between 1996 and 2009 in 16 cohorts from the U.S. and Canada participating in the North American Cohort Collaboration on Research and Design (NA-ACCORD; Appendix Table 2) (33). All contributing cohorts submitted comprehensive clinical data on HIV-infected subjects using standardized data collection methods. In addition, five cohorts contributed data on uninfected subjects (Appendix Table 2) selected to be demographically similar to the HIV-infected subjects in the respective cohorts. Institutional Review Board approval was obtained for each participating cohort.
Cancer diagnosis validation
The endpoints were nine common incident cancer types: KS, NHL, lung, anal, colorectal, liver, and OP cancers, HL, and melanoma. Subjects were evaluated for the first occurrence of a specific cancer type, but could contribute follow-up and events for each cancer type. Diagnoses were collected using a web-based standardized abstraction protocol that included collection of cancer site and histopathology by manually reviewing medical records and pathology reports or by cancer registry linkage (Appendix 2).
Statistical methods
For each subject, observation time began three months after the latest of January 1, 1996, NA-ACCORD entry date, or cohort-specific start date for reporting validated cancer diagnoses (Appendix Table 2). The three-month window allowed for exclusion of prevalent cancers. Each subject was followed until the earliest of December 31, 2009, cancer diagnosis date, death date, date lost to follow-up, or cohort-specific end date for reporting validated cancer diagnoses (Appendix Table 2).
In all analyses, we used age as the time scale, which accounted for the potentially strong confounding effect of age on time trends (34). We focused on cumulative cancer incidence by age 75 years as our main measure since this age approximates both the current lifespan for effectively treated HIV-infected adults and the upper age limit of our follow-up, with 2% and 3% of person-time after age 70 for HIV-infected and uninfected subjects respectively. Given the limited follow-up in older ages, we also present cancer risk by age 65. Since we did not actually follow individuals from age 18 to 75 years, but at most followed a given subject for 14 years, the cumulative incidence metric relied on the assumption that the age-specific risk of cancer remained constant across birth cohorts, similar to assumptions made for life expectancy calculations (35).
We used a competing risk approach with non-parametric estimators for the competing risk of death (30, 36, 37) to estimate cumulative cancer incidence by HIV status and calendar era, categorized as 1996–1999 (reference), 2000–2004, and 2005–2009. We estimated confidence intervals for cumulative incidence by bootstrap methods (38). Next, we computed the subdistribution hazard ratio (sdHR) (29) to estimate secular changes in cumulative cancer incidence, and the cause-specific hazard ratio (csHR) (30) to estimate secular changes in the cancer-specific hazard rate, both adjusted for sex, race (White, Black, other including Hispanic, unknown), and study cohort. We assessed linear annual trends by assignment of a score corresponding with each calendar era midpoint. Proportionality of hazards assumption was assessed by interaction terms between calendar era and age for sdHRs and Schoenfeld residuals (39) for csHRs. Evaluating cumulative incidence using a competing risk approach, along with sdHRs and csHRs, can provide valuable insights into the reasons for changes in cancer risk over time, which may be due to both shifting cancer etiology and improvements in overall survival (40). Specifically, in the HIV setting with improved survival due to more effective ART, more individuals remain alive to potentially experience cancer. Thus, even if the hazard rate (csHR) for a cancer type did not change over time, the cumulative incidence (sdHR) would be expected to increase due to the declining death rate.
SAS, version 9.3 (SAS Institute, Inc., Cary, North Carolina) was used to calculate the non-parametric cumulative incidence functions using an in-house programmed macro based upon the PROC PHREG procedure in SAS (available from authors upon request). STATA 13 (StataCorp LP, College Station, Texas) was used to estimate both the subdistribution and cause-specific proportional hazards models using the stcrreg and stcox command, respectively. Figures were created in R version 3.1.0 (R Core Team, Vienna, Austria).
The funding sources had no role in the design, conduct, and analysis of the study, or with the decision to submit the manuscript for publication.
RESULTS
This investigation included 86,620 HIV-infected (475,660 person-years) and 196,987 uninfected subjects (1,847,932 person-years) (Appendix Table 2). Most subjects were men and fewer than half were known to be white (Table 1). The median age at entry into the 1996–1999 and 2005–2009 calendar eras increased from 42 to 47 years for HIV-infected subjects and from 42 to 48 years for uninfected subjects, and the median birth year at calendar era entry increased from 1955 to 1959 for HIV-infected subjects and from 1955 to 1957 in uninfected subjects, with substantial birth cohort overlap across calendar eras. Among HIV-infected subjects, the median CD4 count increased from 309 to 382 cells/ul, and despite increasing age, the crude mortality rate decreased from 5,140 to 2,844 deaths per 100,000 person-years, but even in 2005–2009 was over three-fold higher than in uninfected subjects. During 1996–2009, each cancer-type-specific incidence rate was higher among HIV-infected compared with uninfected subjects (Table 2), most notably for KS, NHL, anal cancer, and HL.
Table 1.
Calendar trends in selected characteristics by HIV infection status, NA-ACCORD, 1996–2009
| 1996–1999 | 2000–2004 | 2005–2009 | |
|---|---|---|---|
| HIV-infected (n=86,620) | |||
| Person-years | 79,351 | 204,240 | 192,069 |
| Median age, years (IQR)1 | 42 (36, 49) | 44 (37, 51) | 47 (40, 54) |
| Median year of birth (IQR)1 | 1955 (1949, 1961) | 1957 (1950, 1964) | 1959 (1952, 1966) |
| % men1 | 87 | 85 | 86 |
| On antiretroviral therapy, % | 39 | 67 | 74 |
| Median CD4, cells/ul (IQR)1 | 309 (152, 490) | 350 (187, 545) | 382 (222, 570) |
| Median HIV RNA, copies/ml (IQR)1 | 2,729 (400, 27744) | 748 (100, 21321) | 244 (100, 11018) |
| Race, %1 | |||
| White | 45 | 44 | 43 |
| Black | 43 | 40 | 39 |
| Hispanic | 3 | 7 | 7 |
| Other | 2 | 3 | 3 |
| Unknown | 6 | 7 | 8 |
| HIV risk group, %1,2 | |||
| MSM | 39 | 42 | 43 |
| IDU | 24 | 19 | 17 |
| Other | 22 | 25 | 25 |
| Unknown | 15 | 14 | 15 |
| Hepatitis B virus infected, %1,3 | 3 | 4 | 4 |
| Hepatitis C virus infected, %1,3 | 22 | 21 | 20 |
| Crude mortality rate (95% CI)4 | 5,140 (4985, 5301) | 3,913 (3828, 3999) | 2,844 (2770, 2921) |
| Uninfected (n=196,987) | |||
| Person-years | 306,569 | 669,647 | 871,716 |
| Median age, years (IQR)1 | 42 (36, 49) | 45 (38, 52) | 48 (41, 55) |
| Median year of birth (IQR)1 | 1955 (1948, 1961) | 1956 (1949, 1963) | 1957 (1950, 1964) |
| % men1 | 93 | 93 | 93 |
| Race, %1 | |||
| White | 40 | 38 | 38 |
| Black | 24 | 23 | 24 |
| Hispanic | 5 | 5 | 5 |
| Other | 7 | 7 | 7 |
| Unknown | 23 | 26 | 25 |
| Crude mortality rate (95% CI)4 | 669 (641, 699) | 870 (848, 892) | 863 (844, 883) |
CI, confidence interval; MSM, men who have sex with men; IDU, injection drug users; IQR, interquartile range
Age, year of birth, sex, antiretroviral therapy use, CD4, HIV RNA, race, HIV risk group, and hepatitis B and C infection at entry into calendar era
One large cohort that did not have information on HIV risk group was omitted from these frequencies
Three cohorts that did not provide information on hepatitis B virus infection and two cohorts that did not provide information on hepatitis C virus infection were omitted from these frequencies. Also, these are minimum values because in the cohorts that did provide information, the majority of subjects were not tested.
Per 100,000 person-years
Table 2.
Crude cancer-type-specific incidence rates and mortality rate by HIV infection status, NA-ACCORD, 1996–2009
| Event | HIV-infected
|
Uninfected
|
||
|---|---|---|---|---|
| n | rate1 | n | rate1 | |
| Kaposi sarcoma | 612 | 130.4 | 3 | 0.2 |
| Non-Hodgkin’s lymphoma | 725 | 153.5 | 233 | 12.6 |
| Lung | 614 | 129.3 | 839 | 45.4 |
| Anal | 285 | 60.1 | 22 | 1.2 |
| Colorectal | 173 | 36.4 | 510 | 27.7 |
| Liver | 220 | 46.3 | 201 | 10.9 |
| Hodgkin lymphoma | 159 | 33.5 | 36 | 1.9 |
| Melanoma | 78 | 16.4 | 268 | 14.5 |
| Oral cavity/pharyngeal | 163 | 34.3 | 340 | 18.4 |
| Death | 17,534 | 3,686 | 15,400 | 833 |
Incidence rate per 100,000 person-years
Cumulative cancer incidence
Cumulative cancer incidence by age 65 and 75 years during 1996–2009 was higher among HIV-infected compared with uninfected subjects for all cancer types except colorectal, melanoma, and OP (Table 3). Among HIV-infected subjects during 1996–2009, cumulative incidence by age 75 was highest for KS (4.4%), NHL (4.5%), and lung cancer (3.4%), and was 4.1% for KS, 4.0% for NHL, and 3.7% for lung cancer in the most recent calendar era (2005–2009) (Figure 1). Among uninfected subjects during 1996–2009, cumulative incidence by age 75 was greater than 2% only for lung cancer (2.8%) and was highest for lung (2.3%) and colorectal (1.3%) cancers in 2005–2009 (Figure 2).
Table 3.
Crude cumulative cancer incidence (%) by age 65 and 75 years for HIV-infected and uninfected subjects, NA-ACCORD, 1996–2009
| Cancer type | HIV-infected
|
Uninfected
|
||
|---|---|---|---|---|
| 65 years | 75 years | 65 years | 75 years | |
|
| ||||
| % (95% CI) | % (95% CI) | % (95% CI) | % (95% CI) | |
| Kaposi sarcoma | 4.3 (3.8, 5.0) | 4.4 (3.8, 5.2) | 0.00 (0.00, 0.01) | 0.01 (0.00, 0.03) |
| Non-Hodgkin’s lymphoma | 4.1 (3.6, 4.6) | 4.5 (4.0, 5.1) | 0.4 (0.3, 0.4) | 0.7 (0.6, 0.8) |
| Lung | 2.2 (2.0, 2.4) | 3.4 (3.1, 3.7) | 1.3 (1.1, 1.4) | 2.8 (2.5, 3.0) |
| Anal | 1.3 (1.1, 1.5) | 1.5 (1.3, 1.7) | 0.03 (0.02, 0.04) | 0.05 (0.03, 0.08) |
| Colorectal | 0.6 (0.5, 0.7) | 1.0 (0.8, 1.2) | 0.8 (0.7, 0.9) | 1.5 (1.3, 1.6) |
| Liver | 0.8 (0.7, 0.9) | 1.1 (1.0, 1.3) | 0.3 (0.3, 0.4) | 0.4 (0.3, 0.5) |
| Hodgkin lymphoma | 0.9 (0.7, 1.0) | 0.9 (0.7, 1.1) | 0.06 (0.04, 0.08) | 0.09 (0.05, 0.12) |
| Melanoma | 0.4 (0.3, 0.5) | 0.5 (0.4, 0.6) | 0.5 (0.4, 0.6) | 0.6 (0.5, 0.7) |
| Oral cavity/pharyngeal | 0.6 (0.5, 0.7) | 0.8 (0.7, 1.0) | 0.6 (0.5, 0.6) | 0.8 (0.7, 1.0) |
CI, confidence interval
Figure 1. Cumulative cancer incidence by calendar era and cancer type for HIV-infected subjects with age as the time scale, NA-ACCORD, 1996–2009.
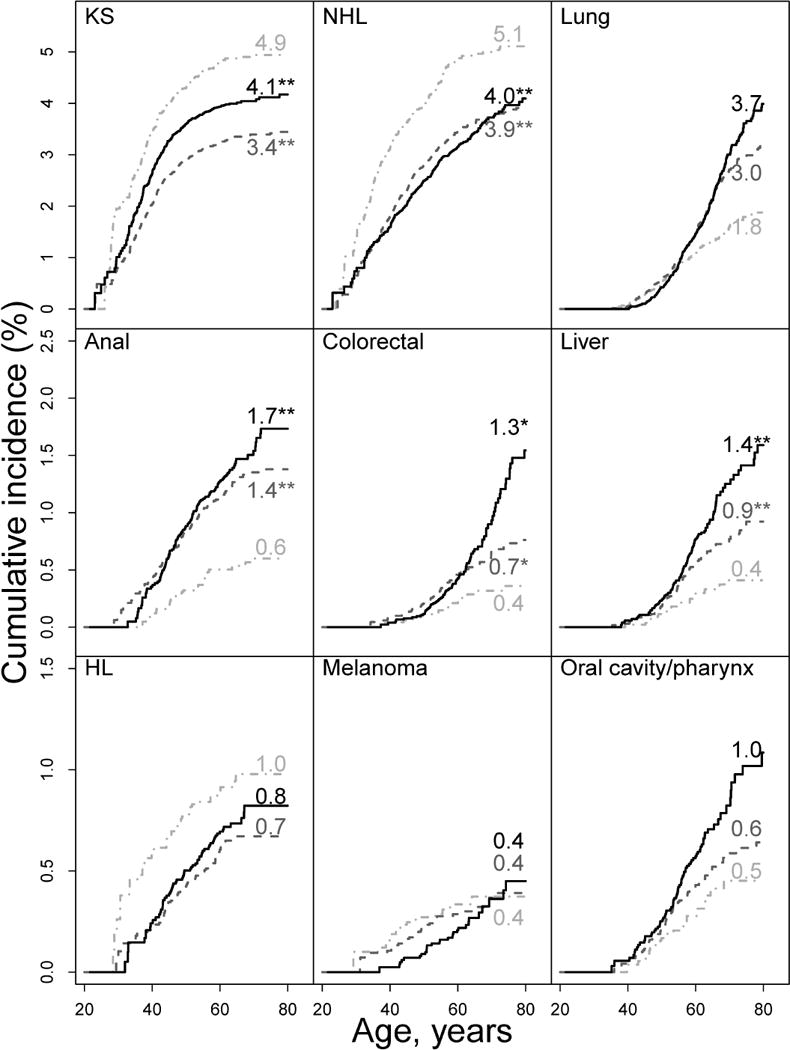
KS, Kaposi sarcoma; NHL, Non-Hodgkin’s lymphoma; HL, Hodgkin lymphoma. Cumulative incidence (i.e., cancer risk) curves for calendar eras 1996–1999 (light gray dash-dot line), 2000–2004 (dark gray dash line), and 2005–2009 (black solid line), were obtained using non-parametric estimators for competing risk events. Numbers associated with curves represent cumulative incidence (%) by age 75 years; *P<0.05 compared with reference (1995–1999 era); ** P<0.01 compared with reference (1995–1999 era).
Figure 2. Cumulative cancer incidence by calendar era and cancer type for uninfected subjects with age as the time scale, NA-ACCORD, 1996–2009.

KS, Kaposi sarcoma; NHL, Non-Hodgkin’s lymphoma; HL, Hodgkin lymphoma. Cumulative incidence (i.e., cancer risk) curves for calendar eras 1996–1999 (light gray dash-dot line), 2000–2004 (dark gray dash line), and 2005–2009 (black solid line), were obtained using non-parametric estimators for competing risk events. Numbers associated with curves represent cumulative incidence (%) by age 75 years; *P<0.05 compared with reference (1995–1999 era); ** P<0.01 compared with reference (1995–1999 era).
Calendar trends in cumulative incidence
Among HIV-infected subjects, we observed significant declining annual trends in cumulative incidence, as measured by the sdHR (Table 4), for KS (−4% per year), NHL (−5% per year), and death (−9% per year) and significant increasing trends for anal (6% per year), colorectal (5% per year) and liver (6% per year) cancers. We observed no evidence for cumulative incidence trends for lung cancer, HL, melanoma, or OP cancer, although given the wide 95% CIs for HL, melanoma, and OP cancer, the absence of trends cannot be confirmed. Among uninfected subjects, we observed significant declining trends in cumulative incidence for lung (−5% per year), colorectal (−6% per year), melanoma (−7% per year), OP (−6% per year), and death (−3% per year), but no significant increasing trends. Cumulative incidence trends significantly differed by HIV status for NHL, which decreased only in HIV-infected subjects; colorectal, which increased in HIV-infected but decreased in uninfected subjects; lung and OP, both of which decreased only in uninfected subjects; and death, for which there was a greater decline in HIV-infected subjects.
Table 4.
Calendar trends in cancer and mortality cumulative incidence and hazard rates by HIV infection status, NA-ACCORD, 1996–2009
| Cumulative incidence annual trend | Cause-specific hazard rate annual trend | |||||||
|---|---|---|---|---|---|---|---|---|
|
| ||||||||
| sdHR1 | 95% CI | P-Value | Interaction P-Value2 | csHR1 | (95% CI) | P-value | Interaction P-Value2 | |
| Kaposi sarcoma | ||||||||
| HIV-infected | −4% | (−7%, −2%) | <0.001 | −6%3 | (−8%, −4%) | <0.001 | ||
| Uninfected | Too few events to estimate trends | Too few events to estimate trends | ||||||
| Non-Hodgkin’s lymphoma | ||||||||
| HIV-infected | −5%3 | (−7%, −3%) | <0.001 | −8% | (−10%, −6%) | <0.001 | ||
| Uninfected | 0%3 | (−4%, 3%) | 0.85 | 0.015 | −2% | (−5%, 2%) | 0.40 | 0.002 |
| Lung | ||||||||
| HIV-infected | −1%3 | (−3%, 2%) | 0.59 | −4% | (−7%, −3%) | <0.001 | ||
| Uninfected | −5%3 | (−6%, −3%) | <0.001 | 0.008 | −6% | (−8%, −4%) | <0.001 | 0.42 |
| Anal | ||||||||
| HIV-infected | 6% | (2%, 9%) | 0.002 | 3% | (−1%, 7%) | 0.13 | ||
| Uninfected | 4% | (−7%, 17%) | 0.47 | 0.84 | 3% | (−9%, 17%) | 0.61 | 0.95 |
| Colorectal | ||||||||
| HIV-infected | 5% | (1%, 10%) | 0.02 | 2% | (−3%, 7%) | 0.44 | ||
| Uninfected | −6% | (−8%, −3%) | <0.001 | <0.001 | −7% | (−9%, −4%) | <0.001 | 0.001 |
| Liver | ||||||||
| HIV-infected | 6% | (2%, 11%) | 0.002 | 2% | (−2%, 7%) | 0.28 | ||
| Uninfected | 4% | (−1%, 8%) | 0.10 | 0.39 | 2% | (−2%, 7%) | 0.28 | 0.96 |
| Hodgkin lymphoma | ||||||||
| HIV-infected | −2% | (−6%, 3%) | 0.41 | −5% | (−9%, 0%) | 0.05 | ||
| Uninfected | 3% | (−6%, 12%) | 0.56 | 0.37 | 2% | (−8%, 12%) | 0.75 | 0.25 |
| Melanoma | ||||||||
| HIV-infected | −4% | (−10%, 3%) | 0.24 | −6% | (−12%, 0%) | 0.05 | ||
| Uninfected | −7% | (−10%, −4%) | <0.001 | 0.38 | −8% | (−11%, −5%) | <0.001 | 0.71 |
| Oral cavity/pharyngeal | ||||||||
| HIV-infected | 3% | (−2%, 7%) | 0.25 | −1% | (−5%, 4%) | 0.82 | ||
| Uninfected | −6% | (−9%, −3%) | <0.001 | 0.001 | −7% | (−10%, −4%) | <0.001 | 0.01 |
| Death4 | ||||||||
| HIV-Infected | −9%3 | (−9%, −8%) | <0.001 | −9%3 | (−9%, −8%) | <0.001 | ||
| Uninfected | −3%3 | (−3%, −2%) | <0.001 | <0.001 | −3%3 | (−3%, −2%) | <0.001 | <0.001 |
CI, confidence interval; csHR, cause-specific hazard ratio; sdHR, subdistribution hazard ratio
sdHR measures annual calendar changes in cumulative incidence, and csHR measures annual calendar changes in hazard rates, adjusted for sex, race, and cohort.
HIV-infected vs. uninfected for corresponding trend.
Evidence of violation of proportional hazards assumption. Estimate should be interpreted as a weighted average over all ages.
Analysis in which melanoma was the competing event.
Calendar trends in hazard rates
Among HIV-infected subjects, we observed significant declining annual trends in hazard rate, as measured by the csHR (Table 4), for KS (−6% per year), NHL (−8% per year), lung cancer (−4% per year), HL (−5% per year), melanoma (−6% per year), and death (−9% per year). For anal cancer, although the annual calendar trend was not significant, there was evidence of a non-linear trend, with similarly increased hazard rates in the 2000–2004 and 2005–2009 calendar eras compared with 1996–1999 (Appendix Table 3). We observed no evidence for hazard rate trends for colorectal, liver, or OP cancer, although the absence of trends cannot be confirmed given the wide 95% CIs. Among uninfected subjects, we observed significant declining trends in the hazard rate for lung (−6% per year), colorectal (−7% per year), melanoma (−8% per year), OP (−7% per year), and death (−3% per year). Cancer-specific hazard rate trends significantly differed by HIV status for NHL, which declined only in HIV-infected subjects; colorectal and OP, which declined only in uninfected subjects; and death, which declined more in HIV-infected than uninfected subjects. Furthermore, HIV-infected and uninfected subjects exhibited similar declining trends for lung cancer and melanoma.
DISCUSSION
In this investigation, we reported cumulative cancer incidence by age 75 years, a novel use of this measure in the HIV-infected population that provides easily interpretable information for HIV patients about their long-term cancer risk. Our results indicated that KS, NHL, and lung cancer remain of great concern, each with lifetime risks of about 1 in 25 in 2005–2009. In addition, the competing risk approach helped disentangle the effects of improved survival and changing cancer-specific hazard rates on cumulative incidence trends.
Of seven NADC examined here, we observed increasing cumulative incidence over time for anal, colorectal and liver cancers among HIV-infected subjects. It appears that two factors contributed to this trend for anal cancer: 1) the declining death rate, which presumably allowed more individuals to survive long enough to experience long-term exposure to human papillomavirus (HPV) infection (41); and 2) the elevated anal cancer hazard rate after 1996–1999. The observed stabilization of the hazard rate at an elevated level after 1999, consistent with our previous more detailed investigation of anal cancer in NA-ACCORD (42), might be due to improved immune function associated with more recently-available ART compared with the early ART era (i.e., 1996–1999), since prior studies have suggested an inverse relationship between CD4 count and anal cancer incidence rates (10). However, calendar trends in incidence rates (comparable to trends in hazard rates here) reported by others for anal cancer have not been consistent (Appendix Table 1) (27, 43–46).
The increasing cumulative incidence trends for liver and colorectal cancers among HIV-infected subjects appeared to be due primarily to the declining death rate, as an increasing trend was not observed in the csHRs for these two cancer types. For liver cancer, the increasing trend for HIV-infected subjects was similar in magnitude, and not statistically different from, the trend for liver cancer among uninfected subjects. This similarity may reflect the identical nonsignificant increasing hazard rate trends between HIV-infected and uninfected subjects, consistent with a general increase in liver cancer risk for ‘baby boomers’ (i.e., birth years 1945–1965), who have a higher prevalence of HCV and HBV infection than other birth cohorts (47). For colorectal cancer, the increasing cumulative incidence trend among HIV-infected subjects was in the opposite direction of the significant decreasing cumulative incidence and hazard rate trends among our uninfected subjects, also observed in the general population (48). We hypothesize that this disparity in colorectal cancer trends may be due to HIV-infected subjects lagging behind the trend of increased colorectal cancer screening in the general population (49).
Among HIV-infected subjects, we found no evidence for calendar trends in cumulative incidence for four other NADC – lung cancer, HL, melanoma, or OP cancer. For lung cancer, HL and melanoma, we did not observe cumulative incidence trends despite decreasing hazard rate trends, implying the declining mortality rate counterbalanced the declining cancer-specific hazard rates. Notably, for lung cancer, we observed similar declining hazard rate trends for HIV-infected and uninfected subjects, consistent with general population trends (48) due to a long-term decline in smoking prevalence (50). This finding is consistent with similarly declining smoking prevalence by HIV status, suggesting that the disparity in cumulative incidence trends – steady in HIV-infected subjects and declining in uninfected subjects – was due to the much greater decreasing mortality rate trend in HIV-infected subjects.
For melanoma, the significant declining hazard rate trends among both HIV-infected and uninfected subjects were the opposite of that observed in the general population although only among those of white race (48), whereas less than half of our sample was known to be white. We can speculate, but cannot confirm, whether there was more skin cancer screening or reduced sun exposure over time among our study subjects compared with the general population.
For OP cancer, both the cumulative incidence and hazard rate trends significantly declined among uninfected subjects, with no observed trends among HIV-infected subjects. In the general population, OP cancer incidence rates declined during 1992–2010, except during 2003–2010 in males (48). In general, overall OP incidence trends are determined by trends in HPV-related OP cancer, which has been increasing in the general population, and in HPV-unrelated OP cancer, which is strongly associated with smoking and alcohol consumption and has been decreasing in the general population (51–53).
As expected, the cumulative incidences for KS and NHL declined significantly for HIV-infected subjects, with even stronger hazard rate declines, consistent with prior studies (4, 22, 23, 28, 54, 55) and resulting from viral suppression and consequent improved immune function afforded by ART. In contrast, the cumulative incidence and hazard rate trends for NHL did not change over calendar time among uninfected subjects, confirming that successful ART has reduced the gap in NHL risk by HIV status (23, 27, 56). We were unable to compare trends similarly for KS by HIV status since only three KS cases were observed among uninfected subjects.
The only other studies to use competing risk methods to estimate cumulative cancer incidence in immunosuppressed populations were among AIDS patients (20) and organ transplant recipients (57), so are not directly comparable to our study. Few recent studies have evaluated trends in incidence rates for specific NADC cancer types among HIV-infected persons exclusively in the ART era, comparable to our evaluation here of calendar era csHR trends (27, 42–46). Across studies, trends for incidence rates, analogous to trends in hazard rates, have been indeterminate (i.e., not statistically significant) or decreasing for lung cancer, HL, and melanoma, indeterminate or increasing for anal (except for one study with a decreasing trend) and liver cancer, and indeterminate for colorectal cancer and OP cancer (summary provided in Appendix Table 1). Differences across studies may be due to differences in statistical power, time periods analyzed, or prevalence of risk factors or cancer screening.
Our results have clinical implications regarding cancer screening in HIV patients. Annual lung cancer screening with low-dose computed tomography is recommended for heavy smokers in the general population aged 55–80 years (58). The high smoking prevalence in HIV patients, along with lung cancer incidence comparable to that of ADC, suggest that HIV-infected smokers should be compelling candidates for screening. In fact, however, research is urgently needed to inform lung cancer screening policy for HIV patients by clarifying the benefits versus harms of screening, as there is potential for harms resulting from a high false positive rate due to elevated incidence of lung infections and other pulmonary diseases (59). The rise in colorectal cancer risk among HIV patients, despite a decline in the general population, indicated the need for increased screening among HIV patients aged 50–75 years, as recommended for the general population (60). Furthermore, the rise in anal cancer risk highlights the need for further evidence regarding the harms and benefits of anal dysplasia screening (61). Finally, although there are no formal guidelines, it would be prudent for physicians to be alert for early signs and symptoms of KS and NHL.
There are also clinical implications for primary prevention. Development of targeted smoking cessation interventions for HIV patients is an obvious priority. The highly effective HPV vaccine was licensed in 2011 for the prevention of anal cancer (62). Although there is concern that high prevalence of HPV infection among HIV patients might render vaccination ineffective, the vaccine has, in fact, been found to be immunogenic in HIV patients (63–65), suggesting that vaccination has the potential to substantially decrease the burden of anal and possibly HPV-related OP cancers, although further research is clearly needed. The increasing risk of liver cancer over time indicates a need to ensure universal hepatitis B virus (HBV) vaccination for HIV patients who are HBV seronegative, as already recommended (66), and to provide treatment of HBV infection using ART regimens with anti-HBV activity (66) and of hepatitis C virus (HCV) infection with recently approved interferon-free therapies (67, 68). Despite the calendar trend declines in ADC among HIV patients, KS and NHL remain major concerns such that efforts need to be intensified to promote early, sustained ART, the only known approach to prevention of these and possibly other cancers linked to immunosuppression (10) or inflammation (12). Finally, research is needed to follow-up on observational studies that suggest that statin use by HIV patients may reduce cancer risk (69–71), presumably due to their anti-inflammatory effects (72).
There were limitations of our study. First, we did not include in our models secular trends in cancer screening, smoking, or viral co-infections since we did not comprehensively capture this information across cohorts, especially among uninfected subjects and non-cancer cases. However, among HIV-infected subjects with available data, we found the prevalence of HBV and HCV infection to be constant over calendar eras. We also chose not to adjust for CD4 and HIV RNA, since these factors are so intertwined with the survival improvements for HIV-infected subjects. Second, although our cancer validation ensured a standardized approach for cancer case ascertainment across cohorts, it is possible that differences in screening across cohorts resulted in variable ascertainment. However, variation in screening is not limited to our study population and would almost certainly be found in the general U.S. and Canadian HIV-infected population as well. Third, our measure of cumulative incidence relied on age-specific follow-up for only a small portion of each subject’s adult lifetime, under the assumption that the age-specific risk of cancer remained constant by birth cohort. We believe this assumption to be reasonable because our study sample included a relatively narrow birth cohort range, with substantial birth cohort overlap across calendar eras, similar variability within each calendar era, and similar birth cohort representation among HIV-infected and uninfected subjects. Nevertheless, it remains possible that some of our findings were driven in part by birth cohort effects, which would tend to manifest as artifactually steep cumulative incidence increases with age if earlier birth cohorts had a higher risk of cancer, such as has been shown for lung cancer (73). Fourth, there was limited follow-up in older ages, although comparison of cumulative cancer incidence estimates by age 65 and 75 years demonstrated that higher cancer risk at older ages noticeably influenced results for some cancer types. Fifth, nonsignificant trends associated with relatively wide 95% CIs do not necessarily indicate the true absence of trends. Finally, although the HIV-infected subjects in NA-ACCORD are highly generalizable to HIV-infected populations in the U.S. and Canada (33), the proportion of women and Hispanics was low, and the uninfected subjects may be less generalizable. However, with respect to the uninfected group, exchangeability with the HIV-infected group is more important for study inferences than is generalizability (74).
A major strength of our study was that we accounted for the competing risk of death, which allowed for a detailed assessment of whether trends in cumulative incidence resulted from actual changes in the cancer-type-specific hazard rate versus reductions in the all-cause mortality rate (31, 32). This approach also provided estimates of the cumulative incidence of cancer by age 75 years, a measure that has not been reported previously in this population and may have clinical and public health utility. This study was also one of few with a demographically comparable uninfected group (43, 75), which may reduce biases relating to access to care, surveillance for cancer, or prevalence of cancer risk factors, that can occur when general population comparison groups are used.
In summary, the effectiveness of ART has enabled HIV patients to live long enough to experience cancer. Thus, the increasing cumulative incidence trends for anal, colorectal, and liver cancers and the lack of evidence for trends for lung cancer, HL, and melanoma were driven by the steeply declining mortality rate, without which these trends would have been absent or declining, according to the cancer-specific hazard rate trends. The high cumulative incidences by age 75 years for KS, NHL, and lung cancer indicate that public health efforts need to be intensified to promote early, sustained ART, smoking cessation, and lung cancer screening. As the HIV-infected population ages, future estimates could be stratified by levels of cancer risk factors such as CD4 count, smoking, alcohol consumption, and HBV or HCV infection, to more accurately inform patients and providers about risk and to help further target prevention efforts.
Supplementary Material
Acknowledgments
NA-ACCORD Collaborating Cohorts and Representatives: AIDS Link to the IntraVenous Experience: Gregory D. Kirk
Adult AIDS Clinical Trials Group Longitudinal Linked Randomized Trials: Constance A. Benson, Ronald J. Bosch, and Ann C. Collier
Fenway Health HIV Cohort: Stephen Boswell, Chris Grasso, and Kenneth H. Mayer
HAART Observational Medical Evaluation and Research: Robert S. Hogg, P. Richard Harrigan, Julio SG Montaner, Angela Cescon, and Hasina Samji
HIV Outpatient Study: John T. Brooks and Kate Buchacz
HIV Research Network: Kelly A. Gebo and Richard D. Moore
Johns Hopkins HIV Clinical Cohort: Richard D. Moore
John T. Carey Special Immunology Unit Patient Care and Research Database, Case Western Reserve University: Benigno Rodriguez
Kaiser Permanente Mid-Atlantic States: Michael A. Horberg
Kaiser Permanente Northern California: Michael J. Silverberg
Longitudinal Study of Ocular Complications of AIDS: Jennifer E. Thorne
Multicenter Hemophilia Cohort Study–II: James J. Goedert
Multicenter AIDS Cohort Study: Lisa P. Jacobson and Gypsyamber D’Souza
Montreal Chest Institute Immunodeficiency Service Cohort: Marina B. Klein
Ontario HIV Treatment Network Cohort Study: Sean B. Rourke, Ann N. Burchell, and Anita R. Rachlis
Retrovirus Research Center, Bayamon Puerto Rico: Robert F. Hunter-Mellado and Angel M. Mayor
Southern Alberta Clinic Cohort: M. John Gill
Studies of the Consequences of the Protease Inhibitor Era: Steven G. Deeks and Jeffrey N. Martin
The Study to Understand the Natural History of HIV/AIDS in the Era of Effective Therapy: Pragna Patel, John T. Brooks
University of Alabama at Birmingham 1917 Clinic Cohort: Michael S. Saag, Michael J. Mugavero, Greer Burkholder, and James Willig
University of North Carolina at Chapel Hill HIV Clinic Cohort: Joseph J. Eron and Sonia Napravnik
University of Washington HIV Cohort: Mari M. Kitahata, Heidi M. Crane and Daniel R. Drozd
Veterans Aging Cohort Study: Amy C. Justice, Robert Dubrow, and David Fiellin
Vanderbilt-Meharry Centers for AIDS Research Cohort: Timothy R. Sterling, David Haas, Sally Bebawy, and Megan Turner
Women’s Interagency HIV Study: Stephen J. Gange and Kathryn Anastos
NA-ACCORD Study Administration
Executive Committee: Richard D. Moore, Michael S. Saag, Stephen J. Gange, Mari M. Kitahata, Keri N. Althoff, Rosemary G. McKaig, Amy C. Justice, and Aimee M. Freeman
Administrative Core: Richard D. Moore, Aimee M. Freeman and Carol Lent
Data Management Core: Mari M. Kitahata, Stephen E. Van Rompaey, Heidi M. Crane, Liz Morton, Justin McReynolds, Daniel R. Drozd and William B. Lober
Epidemiology and Biostatistics Core: Stephen J. Gange, Keri N. Althoff, Alison G. Abraham, Bryan Lau, Jinbing Zhang, Yuezhou Jing, Elizabeth Golub, Shari Modur, Peter Rebeiro, Cherise Wong and Adell Mendes
FUNDING
This work was supported by grants U01-AI069918, U01-AA013566, U24-AA020794, U01-AA020790, U01-AI31834, U01-AI34989, U01-AI34993, U01-AI34994, U01-AI35004, U01-AI35039, U01-AI35040, U01-AI35041, U01-AI35042, U01-AI35043, U01-AI37613, U01-AI37984, U01-AI38855, U01-AI38858, U01-AI42590, U01-AI68634, U01-AI68636, U01-AI69432, U01-AI69434, U01-HD32632, U10-EY08057, U10-EY08052, U10-EY08067, UL1-RR024131, UL1-TR000083, U54-MD007587, F31-DA035713, G12-MD007583, K01-AI071754, K01-AI093197, K23 EY013707, K24-00432, KL2-TR000421, MO1-RR-00052, N02-CP55504, P30-AI027763, P30-AI094189, P30-AI27757, P30-AI27767, P30-AI50410, P30-AI54999, P30-AI036219, P30-MH62246, R01-CA165937, R01-AA16893, R01-DA11602, R01-DA04334, R01-DA12568, R24-AI067039, R56-AI102622, Z01-CP010214, and Z01-CP010176 from the National Institutes of Health, USA; contract CDC200-2006-18797 from the Centers for Disease Control and Prevention, USA; contract 90047713 from the Agency for Healthcare Research and Quality, USA; contract 90051652 from the Health Resources and Services Administration, USA; grants TGF-96118, HCP-97105, CBR-86906, CBR-94036 from the Canadian Institutes of Health Research, Canada; Canadian Institutes of Health Research (CIHR) New Investigator award (A. Burchell); Ontario Ministry of Health and Long Term Care; and the Government of Alberta, Canada. Additional support was provided by the Intramural Research Program of the National Cancer Institute, National Institutes of Health, Z01-CP010214.
References
- 1.Samji H, Cescon A, Hogg RS, Modur SP, Althoff KN, Buchacz K, et al. Closing the gap: increases in life expectancy among treated HIV-positive individuals in the United States and Canada. PLoS One. 2013;8(12):e81355. doi: 10.1371/journal.pone.0081355. [DOI] [PMC free article] [PubMed] [Google Scholar]
- 2.Wada N, Jacobson LP, Cohen M, French A, Phair J, Munoz A. Cause-specific life expectancies after 35 years of age for human immunodeficiency syndrome-infected and human immunodeficiency syndrome-negative individuals followed simultaneously in long-term cohort studies, 1984–2008. Am J Epidemiol. 2013;177(2):116–25. doi: 10.1093/aje/kws321. [DOI] [PMC free article] [PubMed] [Google Scholar]
- 3.Justice AC. HIV and aging: time for a new paradigm. Curr HIV/AIDS Rep. 2010;7(2):69–76. doi: 10.1007/s11904-010-0041-9. [DOI] [PubMed] [Google Scholar]
- 4.Shiels MS, Pfeiffer RM, Gail MH, Hall HI, Li J, Chaturvedi AK, et al. Cancer burden in the HIV-infected population in the United States. J Natl Cancer Inst. 2011;103(9):753–62. doi: 10.1093/jnci/djr076. [DOI] [PMC free article] [PubMed] [Google Scholar]
- 5.Guiguet M, Boue F, Cadranel J, Lang JM, Rosenthal E, Costagliola D. Effect of immunodeficiency, HIV viral load, and antiretroviral therapy on the risk of individual malignancies (FHDH-ANRS CO4): a prospective cohort study. Lancet Oncol. 2009;10(12):1152–9. doi: 10.1016/S1470-2045(09)70282-7. [DOI] [PubMed] [Google Scholar]
- 6.Kesselring A, Gras L, Smit C, van Twillert G, Verbon A, de Wolf F, et al. Immunodeficiency as a risk factor for non-AIDS-defining malignancies in HIV-1-infected patients receiving combination antiretroviral therapy. Clin Infect Dis. 2011;52(12):1458–65. doi: 10.1093/cid/cir207. [DOI] [PubMed] [Google Scholar]
- 7.Reekie J, Kosa C, Engsig F, Monforte A, Wiercinska-Drapalo A, Domingo P, et al. Relationship between current level of immunodeficiency and non-acquired immunodeficiency syndrome-defining malignancies. Cancer. 2010;116(22):5306–15. doi: 10.1002/cncr.25311. [DOI] [PubMed] [Google Scholar]
- 8.Silverberg MJ, Chao C, Leyden WA, Xu L, Horberg MA, Klein D, et al. HIV infection, immunodeficiency, viral replication, and the risk of cancer. Cancer Epidemiol Biomarkers Prev. 2011;20(12):2551–9. doi: 10.1158/1055-9965.EPI-11-0777. [DOI] [PMC free article] [PubMed] [Google Scholar]
- 9.Bruyand M, Thiebaut R, Lawson-Ayayi S, Joly P, Sasco AJ, Mercie P, et al. Role of uncontrolled HIV RNA level and immunodeficiency in the occurrence of malignancy in HIV-infected patients during the combination antiretroviral therapy era: Agence Nationale de Recherche sur le Sida (ANRS) CO3 Aquitaine Cohort. Clin Infect Dis. 2009;49(7):1109–16. doi: 10.1086/605594. [DOI] [PMC free article] [PubMed] [Google Scholar]
- 10.Dubrow R, Silverberg MJ, Park LS, Crothers K, Justice AC. HIV infection, aging, and immune function: implications for cancer risk and prevention. Curr Opin Oncol. 2012;24(5):506–16. doi: 10.1097/CCO.0b013e328355e131. [DOI] [PMC free article] [PubMed] [Google Scholar]
- 11.Borges AH, Dubrow R, Silverberg MJ. Factors contributing to risk for cancer among HIV-infected individuals, and evidence that earlier combination antiretroviral therapy will alter this risk. Curr Opin HIV AIDS. 2014;9(1):34–40. doi: 10.1097/COH.0000000000000025. [DOI] [PMC free article] [PubMed] [Google Scholar]
- 12.Borges AH, Silverberg MJ, Wentworth D, Grulich AE, Fatkenheuer G, Mitsuyasu R, et al. Predicting risk of cancer during HIV infection: the role of inflammatory and coagulation biomarkers. AIDS. 2013;27(9):1433–41. doi: 10.1097/QAD.0b013e32835f6b0c. [DOI] [PMC free article] [PubMed] [Google Scholar]
- 13.Tesoriero JM, Gieryic SM, Carrascal A, Lavigne HE. Smoking among HIV positive New Yorkers: prevalence, frequency, and opportunities for cessation. AIDS Behav. 2010;14(4):824–35. doi: 10.1007/s10461-008-9449-2. [DOI] [PubMed] [Google Scholar]
- 14.Engsig FN, Kronborg G, Larsen CS, Pedersen G, Pedersen C, Gerstoft J, et al. Lung cancer in HIV patients and their parents: a Danish cohort study. BMC Cancer. 2011;11:272. doi: 10.1186/1471-2407-11-272. [DOI] [PMC free article] [PubMed] [Google Scholar]
- 15.Rahmanian S, Wewers ME, Koletar S, Reynolds N, Ferketich A, Diaz P. Cigarette smoking in the HIV-infected population. Proc Am Thorac Soc. 2011;8(3):313–9. doi: 10.1513/pats.201009-058WR. [DOI] [PMC free article] [PubMed] [Google Scholar]
- 16.Helleberg M, Gerstoft J, Afzal S, Kronborg G, Larsen CS, Pedersen C, et al. Risk of cancer among HIV-infected individuals compared to the background population: impact of smoking and HIV. AIDS. 2014;28(10):1499–508. doi: 10.1097/QAD.0000000000000283. [DOI] [PubMed] [Google Scholar]
- 17.Kojic EM, Cu-Uvin S. Update: human papillomavirus infection remains highly prevalent and persistent among HIV-infected individuals. Curr Opin Oncol. 2007;19(5):464–9. doi: 10.1097/CCO.0b013e3282c8c84c. [DOI] [PubMed] [Google Scholar]
- 18.Alter MJ. Epidemiology of viral hepatitis and HIV co-infection. J Hepatol. 2006;44(1 Suppl):S6–9. doi: 10.1016/j.jhep.2005.11.004. [DOI] [PubMed] [Google Scholar]
- 19.Bagni R, Whitby D. Kaposi’s sarcoma-associated herpesvirus transmission and primary infection. Curr Opin HIV AIDS. 2009;4(1):22–6. doi: 10.1097/COH.0b013e32831add5a. [DOI] [PubMed] [Google Scholar]
- 20.Simard EP, Pfeiffer RM, Engels EA. Cumulative incidence of cancer among individuals with acquired immunodeficiency syndrome in the United States. Cancer. 2011;117(5):1089–96. doi: 10.1002/cncr.25547. [DOI] [PMC free article] [PubMed] [Google Scholar]
- 21.Simard EP, Pfeiffer RM, Engels EA. Spectrum of cancer risk late after AIDS onset in the United States. Arch Intern Med. 2010;170(15):1337–45. doi: 10.1001/archinternmed.2010.253. [DOI] [PMC free article] [PubMed] [Google Scholar]
- 22.Bedimo R, Chen RY, Accortt NA, Raper JL, Linn C, Allison JJ, et al. Trends in AIDS-defining and non-AIDS-defining malignancies among HIV-infected patients: 1989–2002. Clin Infect Dis. 2004;39(9):1380–4. doi: 10.1086/424883. [DOI] [PubMed] [Google Scholar]
- 23.Engels EA, Pfeiffer RM, Goedert JJ, Virgo P, McNeel TS, Scoppa SM, et al. Trends in cancer risk among people with AIDS in the United States 1980–2002. AIDS. 2006;20(12):1645–54. doi: 10.1097/01.aids.0000238411.75324.59. [DOI] [PubMed] [Google Scholar]
- 24.Grulich AE, van Leeuwen MT, Falster MO, Vajdic CM. Incidence of cancers in people with HIV/AIDS compared with immunosuppressed transplant recipients: a meta-analysis. Lancet. 2007;370(9581):59–67. doi: 10.1016/S0140-6736(07)61050-2. [DOI] [PubMed] [Google Scholar]
- 25.Shiels MS, Cole SR, Kirk GD, Poole C. A meta-analysis of the incidence of non-AIDS cancers in HIV-infected individuals. J Acquir Immune Defic Syndr. 2009;52(5):611–22. doi: 10.1097/QAI.0b013e3181b327ca. [DOI] [PMC free article] [PubMed] [Google Scholar]
- 26.Patel P, Hanson DL, Sullivan PS, Novak RM, Moorman AC, Tong TC, et al. Incidence of types of cancer among HIV-infected persons compared with the general population in the United States, 1992–2003. Ann Intern Med. 2008;148(10):728–36. doi: 10.7326/0003-4819-148-10-200805200-00005. [DOI] [PubMed] [Google Scholar]
- 27.Robbins HA, Shiels MS, Pfeiffer RM, Engels EA. Epidemiologic contributions to recent cancer trends among HIV-infected people in the United States. AIDS. 2014;28(6):881–90. doi: 10.1097/QAD.0000000000000163. [DOI] [PMC free article] [PubMed] [Google Scholar]
- 28.Patel P, Armon C, Chmiel JS, Brooks JT, Buchacz K, Wood K, et al. Factors associated with cancer incidence and with all-cause mortality after cancer diagnosis among human immunodeficiency virus-infected persons during the combination antiretroviral therapy era. Open Forum Infect Dis. 2014;1(1):ofu012. doi: 10.1093/ofid/ofu012. [DOI] [PMC free article] [PubMed] [Google Scholar]
- 29.Fine JP, Gray RJ. A proportional hazards model for the subdistribution of a competing risk. J Am Stat Assoc. 1999;94(446):496–509. [Google Scholar]
- 30.Kalbfleisch JD, Prentice RL. The Statistical Analysis of Failure Time Data. New York: Wiley; 1980. [Google Scholar]
- 31.Allignol A, Schumacher M, Wanner C, Drechsler C, Beyersmann J. Understanding competing risks: a simulation point of view. BMC Med Res Methodol. 2011;11:86. doi: 10.1186/1471-2288-11-86. [DOI] [PMC free article] [PubMed] [Google Scholar]
- 32.Latouche A, Allignol A, Beyersmann J, Labopin M, Fine JP. A competing risks analysis should report results on all cause-specific hazards and cumulative incidence functions. J Clin Epidemiol. 2013;66(6):648–53. doi: 10.1016/j.jclinepi.2012.09.017. [DOI] [PubMed] [Google Scholar]
- 33.Gange SJ, Kitahata MM, Saag MS, Bangsberg DR, Bosch RJ, Brooks JT, et al. Cohort profile: the North American AIDS Cohort Collaboration on Research and Design (NA-ACCORD) Int J Epidemiol. 2007;36(2):294–301. doi: 10.1093/ije/dyl286. [DOI] [PMC free article] [PubMed] [Google Scholar]
- 34.Korn EL, Graubard BI, Midthune D. Time-to-event analysis of longitudinal follow-up of a survey: choice of the time-scale. Am J Epidemiol. 1997;145(1):72–80. doi: 10.1093/oxfordjournals.aje.a009034. [DOI] [PubMed] [Google Scholar]
- 35.Arias E. National vital statistics reports 2014. 7. Vol. 63. Hyattsville, MD: National Center for Health Statistics; United States life tables, 2010. http://www.cdc.gov/nchs/data/nvsr/nvsr63/nvsr63_07.pdf. Accessed April 20, 2015. [PubMed] [Google Scholar]
- 36.Lau B, Gange SJ, Moore RD. Risk of non-AIDS-related mortality may exceed risk of AIDS-related mortality among individuals enrolling into care with CD4+ counts greater than 200 cells/mm3. J Acquir Immune Defic Syndr. 2007;44(2):179–87. doi: 10.1097/01.qai.0000247229.68246.c5. [DOI] [PubMed] [Google Scholar]
- 37.Gaynor JJ, Feuer EJ, Tan CC, Wu DH, Little CR, Straus DJ, et al. On the use of cause-specific failure and conditional failure probabilities – examples from clinical oncology data. J Am Stat Assoc. 1993;88(422):400–9. [Google Scholar]
- 38.Efron B. An Introduction to the Bootstrap. London, England: Chapman & Hall; 1993. [Google Scholar]
- 39.Schoenfeld D. Partial residuals for the proportional hazards regression model. Biometrika. 1982;69(1):239–41. [Google Scholar]
- 40.Lau B, Cole SR, Gange SJ. Competing risk regression models for epidemiologic data. Am J Epidemiol. 2009;170(2):244–56. doi: 10.1093/aje/kwp107. [DOI] [PMC free article] [PubMed] [Google Scholar]
- 41.Human Papillomaviruses. IARC Monographs on the Evaluation of Carcinogenic Risks to Humans: International Agency for Research on Cancer. 2007;90:209–22. [PMC free article] [PubMed] [Google Scholar]
- 42.Silverberg MJ, Lau B, Justice AC, Engels E, Gill MJ, Goedert JJ, et al. Risk of anal cancer in HIV-infected and HIV-uninfected individuals in North America. Clin Infect Dis. 2012;54(7):1026–34. doi: 10.1093/cid/cir1012. [DOI] [PMC free article] [PubMed] [Google Scholar]
- 43.Silverberg MJ, Chao C, Leyden WA, Xu L, Tang B, Horberg MA, et al. HIV infection and the risk of cancers with and without a known infectious cause. AIDS. 2009;23(17):2337–45. doi: 10.1097/QAD.0b013e3283319184. [DOI] [PMC free article] [PubMed] [Google Scholar]
- 44.Piketty C, Selinger-Leneman H, Bouvier AM, Belot A, Mary-Krause M, Duvivier C, et al. Incidence of HIV-related anal cancer remains increased despite long-term combined antiretroviral treatment: results from the french hospital database on HIV. J Clin Oncol. 2012;30(35):4360–6. doi: 10.1200/JCO.2012.44.5486. [DOI] [PubMed] [Google Scholar]
- 45.Hleyhel M, Bouvier AM, Belot A, Tattevin P, Pacanowski J, Genet P, et al. Risk of non-AIDS-defining cancers among HIV-1-infected individuals in France between 1997 and 2009: results from a French cohort. AIDS. 2014;28(14):2109–18. doi: 10.1097/QAD.0000000000000382. [DOI] [PubMed] [Google Scholar]
- 46.Worm SW, Bower M, Reiss P, Bonnet F, Law M, Fatkenheuer G, et al. Non-AIDS defining cancers in the D:A:D Study–time trends and predictors of survival: a cohort study. BMC Infect Dis. 2013;13(471):1–15. doi: 10.1186/1471-2334-13-471. [DOI] [PMC free article] [PubMed] [Google Scholar]
- 47.Moorman AC, Gordon SC, Rupp LB, Spradling PR, Teshale EH, Lu M, et al. Baseline characteristics and mortality among people in care for chronic viral hepatitis: the chronic hepatitis cohort study. Clin Infect Dis. 2013;56(1):40–50. doi: 10.1093/cid/cis815. [DOI] [PubMed] [Google Scholar]
- 48.Edwards BK, Noone AM, Mariotto AB, Simard EP, Boscoe FP, Henley SJ, et al. Annual Report to the Nation on the status of cancer, 1975–2010, featuring prevalence of comorbidity and impact on survival among persons with lung, colorectal, breast, or prostate cancer. Cancer. 2014;120(9):1290–314. doi: 10.1002/cncr.28509. [DOI] [PMC free article] [PubMed] [Google Scholar]
- 49.Stock C, Haug U, Brenner H. Population-based prevalence estimates of history of colonoscopy or sigmoidoscopy: review and analysis of recent trends. Gastrointest Endosc. 2010;71(2):366–81. doi: 10.1016/j.gie.2009.06.018. [DOI] [PubMed] [Google Scholar]
- 50.Jemal A, Thun MJ, Ries LA, Howe HL, Weir HK, Center MM, et al. Annual Report to the Nation on the status of cancer, 1975–2005, featuring trends in lung cancer, tobacco use, and tobacco control. J Natl Cancer Inst. 2008;100(23):1672–94. doi: 10.1093/jnci/djn389. [DOI] [PMC free article] [PubMed] [Google Scholar]
- 51.Auluck A, Hislop G, Bajdik C, Poh C, Zhang L, Rosin M. Trends in oropharyngeal and oral cavity cancer incidence of human papillomavirus (HPV)-related and HPV-unrelated sites in a multicultural population: the British Columbia experience. Cancer. 2010;116(11):2635–44. doi: 10.1002/cncr.25087. [DOI] [PubMed] [Google Scholar]
- 52.Chaturvedi AK, Engels EA, Anderson WF, Gillison ML. Incidence trends for human papillomavirus-related and -unrelated oral squamous cell carcinomas in the United States. J Clin Oncol. 2008;26(4):612–9. doi: 10.1200/JCO.2007.14.1713. [DOI] [PubMed] [Google Scholar]
- 53.Chaturvedi AK, Engels EA, Pfeiffer RM, Hernandez BY, Xiao W, Kim E, et al. Human papillomavirus and rising oropharyngeal cancer incidence in the United States. J Clin Oncol. 2011;29(32):4294–301. doi: 10.1200/JCO.2011.36.4596. [DOI] [PMC free article] [PubMed] [Google Scholar]
- 54.Franceschi S, Maso LD, Rickenbach M, Polesel J, Hirschel B, Cavassini M, et al. Kaposi sarcoma incidence in the Swiss HIV Cohort Study before and after highly active antiretroviral therapy. Br J Cancer. 2008;99(5):800–4. doi: 10.1038/sj.bjc.6604520. [DOI] [PMC free article] [PubMed] [Google Scholar]
- 55.Polesel J, Clifford GM, Rickenbach M, Dal Maso L, Battegay M, Bouchardy C, et al. Non-Hodgkin lymphoma incidence in the Swiss HIV Cohort Study before and after highly active antiretroviral therapy. AIDS. 2008;22(2):301–6. doi: 10.1097/QAD.0b013e3282f2705d. [DOI] [PubMed] [Google Scholar]
- 56.Hleyhel M, Belot A, Bouvier AM, Tattevin P, Pacanowski J, Genet P, et al. Risk of AIDS-defining cancers among HIV-1-infected patients in France between 1992 and 2009: results from the FHDH-ANRS CO4 cohort. Clin Infect Dis. 2013;57(11):1638–47. doi: 10.1093/cid/cit497. [DOI] [PubMed] [Google Scholar]
- 57.Hall EC, Pfeiffer RM, Segev DL, Engels EA. Cumulative incidence of cancer after solid organ transplantation. Cancer. 2013;119(12):2300–8. doi: 10.1002/cncr.28043. [DOI] [PMC free article] [PubMed] [Google Scholar]
- 58.Moyer VA. U.S. Preventive Services Task Force. Screening for lung cancer: U.S. Preventive Services Task Force recommendation statement. Ann Intern Med. 2014;160(5):330–8. doi: 10.7326/M13-2771. [DOI] [PubMed] [Google Scholar]
- 59.Sigel K, Wisnivesky J, Shahrir S, Brown ST, Justice A, Kim J, et al. Findings in asymptomatic HIV-infected patients undergoing chest computed tomography testing: implications for lung cancer screening. AIDS. 2014;28(7):1007–14. doi: 10.1097/QAD.0000000000000189. [DOI] [PMC free article] [PubMed] [Google Scholar]
- 60.U.S. Preventive Services Task Force. Screening for colorectal cancer: U.S. Preventive Services Task Force recommendation statement. Ann Intern Med. 2008;149(9):627–37. doi: 10.7326/0003-4819-149-9-200811040-00243. [DOI] [PubMed] [Google Scholar]
- 61.Wells JS, Holstad MM, Thomas T, Bruner DW. An integrative review of guidelines for anal cancer screening in HIV-infected persons. AIDS Patient Care STDS. 2014;28(7):350–7. doi: 10.1089/apc.2013.0358. [DOI] [PubMed] [Google Scholar]
- 62.US Food and Drug Administration news release: Gardasil approved to prevent anal cancer. http://www.fda.gov/NewsEvents/Newsroom/PressAnnouncements/ucm237941.htm. Accessed April 20, 2015.
- 63.Kahn JA, Xu J, Kapogiannis BG, Rudy B, Gonin R, Liu N, et al. Immunogenicity and safety of the human papillomavirus 6, 11, 16, 18 vaccine in HIV-infected young women. Clin Infect Dis. 2013;57(5):735–44. doi: 10.1093/cid/cit319. [DOI] [PMC free article] [PubMed] [Google Scholar]
- 64.Kojic EM, Kang M, Cespedes MS, Umbleja T, Godfrey C, Allen RT, et al. Immunogenicity and safety of the quadrivalent human papillomavirus vaccine in HIV-1-infected women. Clin Infect Dis. 2014;59(1):127–35. doi: 10.1093/cid/ciu238. [DOI] [PMC free article] [PubMed] [Google Scholar]
- 65.Wilkin T, Lee JY, Lensing SY, Stier EA, Goldstone SE, Berry JM, et al. Safety and immunogenicity of the quadrivalent human papillomavirus vaccine in HIV-1-infected men. J Infect Dis. 2010;202(8):1246–53. doi: 10.1086/656320. [DOI] [PMC free article] [PubMed] [Google Scholar]
- 66.Kaplan JE, Benson C, Holmes KK, Brooks JT, Pau A, Masur H. Guidelines for prevention and treatment of opportunistic infections in HIV-infected adults and adolescents: recommendations from CDC, the National Institutes of Health, and the HIV Medicine Association of the Infectious Diseases Society of America. MMWR Morb Mortal Wkly Rep. 2009;58(RR-4):1–207. [PubMed] [Google Scholar]
- 67.Osinusi A, Townsend K, Kohli A, Nelson A, Seamon C, Meissner EG, et al. Virologic response following combined ledipasvir and sofosbuvir administration in patients with HCV genotype 1 and HIV co-infection. JAMA. 2015;313(12):1232–9. doi: 10.1001/jama.2015.1373. [DOI] [PMC free article] [PubMed] [Google Scholar]
- 68.Sulkowski MS, Eron JJ, Wyles D, Trinh R, Lalezari J, Wang C, et al. Ombitasvir, paritaprevir co-dosed with ritonavir, dasabuvir, and ribavirin for hepatitis C in patients co-infected with HIV-1: a randomized trial. JAMA. 2015;313(12):1223–31. doi: 10.1001/jama.2015.1328. [DOI] [PubMed] [Google Scholar]
- 69.Overton ET, Kitch D, Benson CA, Hunt PW, Stein JH, Smurzynski M, et al. Effect of statin therapy in reducing the risk of serious non-AIDS-defining events and nonaccidental death. Clin Infect Dis. 2013;56(10):1471–9. doi: 10.1093/cid/cit053. [DOI] [PMC free article] [PubMed] [Google Scholar]
- 70.Galli L, Spagnuolo V, Poli A, Salpietro S, Gianotti N, Cossarini F, et al. Use of statins and risk of AIDS-defining and non-AIDS-defining malignancies among HIV-1 infected patients on antiretroviral therapy. AIDS. 2014;28(16):2407–15. doi: 10.1097/QAD.0000000000000443. [DOI] [PubMed] [Google Scholar]
- 71.Chao C, Xu L, Abrams DI, Towner WJ, Horberg MA, Leyden WA, et al. HMG-CoA reductase inhibitors (statins) use and risk of non-Hodgkin lymphoma in HIV-positive persons. AIDS. 2011;25(14):1771–7. doi: 10.1097/QAD.0b013e328349c67a. [DOI] [PMC free article] [PubMed] [Google Scholar]
- 72.Ganesan A, Crum-Cianflone N, Higgins J, Qin J, Rehm C, Metcalf J, et al. High dose atorvastatin decreases cellular markers of immune activation without affecting HIV-1 RNA levels: results of a double-blind randomized placebo controlled clinical trial. J Infect Dis. 2011;203(6):756–64. doi: 10.1093/infdis/jiq115. [DOI] [PMC free article] [PubMed] [Google Scholar]
- 73.U.S. Department of Health and Human Services, Centers for Disease Control and Prevention, National Center for Chronic Disease Prevention and Health Promotion, Office on Smoking and Health. The Health Consequences of Smoking-50 Years of Progress: A Report of the Surgeon General. Atlanta (GA): 2014. pp. 151–86. [Google Scholar]
- 74.Althoff KN, Gange SJ. A critical epidemiological review of cardiovascular disease risk in HIV-infected adults: the importance of the HIV-uninfected comparison group, confounding, and competing risks. HIV Med. 2013;14(3):191–2. doi: 10.1111/hiv.12007. [DOI] [PubMed] [Google Scholar]
- 75.Park LS, Tate JP, Rodriguez-Barradas MC, Rimland D, Goetz MB, Gibert C, et al. Cancer incidence in HIV-infected versus uninfected veterans: comparison of cancer registry and ICD-9 code diagnoses. J AIDS Clin Res. 2014;5:318. doi: 10.4172/2155-6113.1000318. [DOI] [PMC free article] [PubMed] [Google Scholar]
Associated Data
This section collects any data citations, data availability statements, or supplementary materials included in this article.