

Abstract
Although RNA-seq is a powerful tool, the considerable time and cost associated with library construction has limited its utilization for various applications. RNAtag-Seq, an approach to generate multiple RNA-seq libraries in a single reaction, lowers time and cost per sample, and it produces data on prokaryotic and eukaryotic samples that are comparable to those generated by traditional strand-specific RNA-seq approaches.
RNA-seq has become the gold standard for mapping transcriptomes1,2, profiling changes in splicing3,4 and measuring gene expression levels5,6. The most widely used method for RNA-seq library construction is the dUTP approach7. Although this approach provides high-quality strand-specific RNA-seq profiles, it involves generation of a single library for a single sample7. As such, this method is time consuming and expensive to perform on many samples, limiting its utility for applications that require profiling hundreds or thousands of individual samples, such as whole-transcriptome profiling of cancer samples8,9 or screening the effects of genetic perturbations on gene expression10–12.
One approach to increase the throughput of library construction is to attach a unique barcode to individual samples and pool these samples to generate a single RNA-seq library. The advantage of this approach is that the cost and time for library generation per sample is reduced as the total number of samples increases. Recently, several protocols have been developed to generate cDNA libraries from pools of barcoded RNA samples13–17. Although these protocols represent an important conceptual advance, they are currently limited because either they introduce barcodes through an oligo(dT) primer and therefore can only profile the 3′ ends of eukaryotic mRNAs13–15 or they introduce barcodes at later stages of library construction, usually just before PCR amplification, thereby limiting the cost and time saved by multiplexing16,17.
Here we report RNAtag-Seq, a method for generating a single RNA-seq library containing large numbers of RNA samples that are barcoded and pooled before library construction (Online Methods, Fig. 1 and Supplementary Protocol). Barcoding in RNAtag-Seq is achieved through direct ligation of adaptors to RNA, enabling strand-specific, quantitative sequencing of full-length transcripts in diverse prokaryotic and eukaryotic species at a quality highly comparable to that of the well-established dUTP method7 for single-sample library construction (Supplementary Figs. 1 and 2 and Supplementary Table 1).
Figure 1.

Schematic of RNAtag-Seq method. Gray and black lines correspond to RNA and cDNA, respectively. Colored blocks represent unique sequence barcodes. Light green lines and purple bars represent Illumina sequencing adaptors and Illumina index barcodes, respectively.
To enable pooled library construction of large numbers of samples by RNAtag-Seq, we empirically identified sets of bar-coded adaptors that provide uniform read counts across many samples. First, we designed 96 random barcoded adaptors (see Online Methods) and tagged a single Escherichia coli RNA sample with each barcode. We identified a set of 32 barcoded adaptors that, when individually ligated to replicate samples before pooled library construction, produced uniform read counts across these samples (less than threefold variation; Supplementary Fig. 3a and Supplementary Table 2). This variation is sequence intrinsic as independent synthesis of these barcodes produced similar read distributions (Supplementary Table 2). To define sets of barcodes of arbitrary size that provide similarly uniform read counts, we synthesized a pool of RNA adaptors that contained a degenerate 6-nt barcode (N6) (Online Methods), ligated this pool to mouse RNA, quantified the number of reads obtained for each barcode, and identified several large cohorts of barcodes that (i) yielded uniform read counts and (ii) were divergent enough to allow for correct sample assignment even in the case of sequencing errors (Supplementary Table 2 and Online Methods). We selected one cohort of 54 barcodes and individually synthesized and ligated them to mouse RNA. This was followed by pooling, library construction and sequencing. The resulting distribution of reads per barcode was highly uniform (less than twofold variation; Supplementary Fig. 3b), demonstrating that this approach enables the identification of large sets of barcoded adaptors that perform well in pooled generation of RNA-seq libraries.
Notably, normalized gene expression values were highly correlated among replicate samples barcoded with different adaptors (Supplementary Figs. 4 and 5a and Supplementary Table 3). In addition, the frequencies of dinucleotide pairs following the adaptor sequence closely mirrored those present in all annotated genes (Supplementary Fig. 5b), highlighting that the sequence of RNA fragments did not markedly affect their ligation frequency. Together, these data demonstrate that ligation of different barcoded adaptors does not introduce quantification biases. Although the total number of reads across barcodes varied by as much as threefold, this variation does not affect gene quantification or differential expression analysis because these measures normalize gene values by the total number of reads generated for a sample18.
To demonstrate the utility of RNAtag-Seq for identifying differential gene expression in mammalian samples, we profiled the transcriptomes of 11 different tissues and three developmental stages in the mouse (Supplementary Table 4). In total, we identified >4,500 differentially expressed genes across all samples (fold change >2, adjusted P value (Padj) < 0.01). Notably, the differentially expressed genes that were detected recapitulated the known gene expression differences that mark these different tissue samples (Fig. 2a). For example, 649 genes whose expression was significantly different in the brain and spinal cord compared to the remainder of the samples (fold change >2, Padj < 0.01) were highly enriched for various neural functions including generation of neurons (Padj < 0.01), regulation of synaptic transmission (Padj < 0.001) and ion transport (Padj < 0.001) (Fig. 2b and Supplementary Table 5). Similarly, we identified 150 genes that were differentially expressed between the eye and all remaining samples. These genes were highly enriched for visual perception (Padj < 10–60), sensory perception of light (Padj < 10–60), photoreceptor cell development (Padj < 10–15) and eye development (Padj< 10–15) (Fig 2b). These results highlight that RNAtag-Seq is able to pick out the well-characterized differences in gene expression across multiple samples in mammalian specimens.
Figure 2.
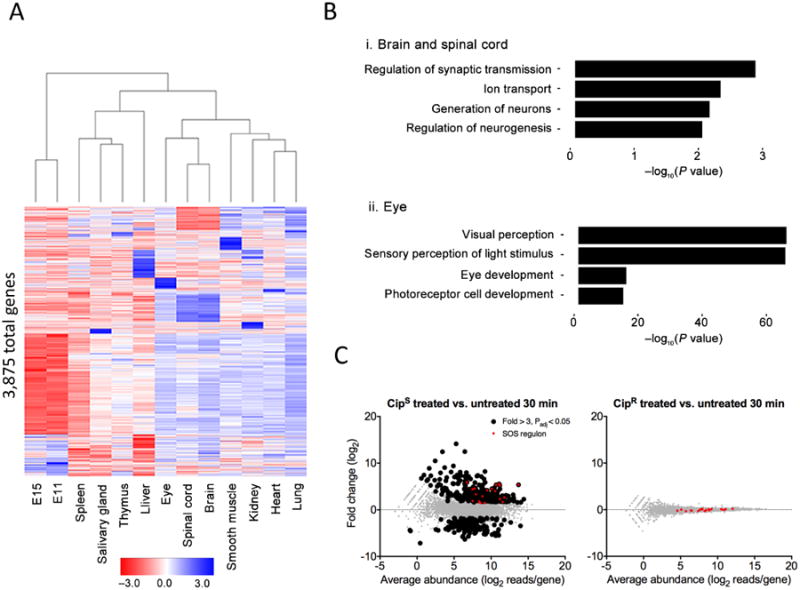
Differential gene expression analysis using RNAtag-Seq. (a) Heat map of all 3,875 differentially expressed genes (fold change >2, Padj < 0.01 with Padj corresponding to the P value adjusted for multiple testing using the Benjamini-Hochberg procedure) across adult mouse tissues and mouse embryos at developmental stages E11 and E15. (b) Selected Gene Ontology categories and their enrichment for specific tissues: brain and spinal cord samples (top) and eye samples (bottom) relative to all samples. The enrichment is plotted as the −log10 of the enrichment P value. (c) MA plots of 2 ciprofloxacin-susceptible (CipS, left) and 2 ciprofloxacin-resistant (CipR, right) E. coli clinical isolates 30 min after exposure to ciprofloxacin versus untreated. Genes found to be significantly up- and downregulated (greater than threefold, Padj < 0.05) by RNAtag-Seq are colored black. Genes in the SOS regulon are colored red.
We also profiled and compared the transcriptomes of multiple individual bacterial samples processed in a single pool. Recent work has shown that transcriptional responses to antibiotic exposure can be used to distinguish drug-susceptible and drug-resistant bacteria in clinical samples19. However, such signatures have been determined for few clinically relevant pathogens, owing in part to the large number of individual samples needed for these analyses. To determine a transcriptional signature for ciprofloxacin susceptibility in E. coli, we profiled samples from ciprofloxacin-susceptible (CipS) and ciprofloxacin-resistant (CipR) clinical isolates, two of each exposed to ciprofloxacin and two of each not, at four time points of growth (Supplementary Table 6). A total of 665 and 334 genes were significantly up-and downregulated, respectively (fold change > 3, Padj < 0.05), after drug exposure of CipS strains (Fig. 2c and Supplementary Table 7), including all 20 genes in the well-characterized SOS pathway induced by DNA-damaging agents such as fluoroquinolones20 (Fig. 2c and Supplementary Fig. 6). Sixty-seven genes were differentially expressed in only CipS strains and at all time points following ciprofloxacin exposure (Fig. 2c and Supplementary Fig. 6), suggesting their expression provides a specific and stable transcriptional signature for identifying ciprofloxacin susceptible E. coli strains. Taken together, our findings demonstrate that RNAtag-Seq is a robust method for identifying differentially expressed genes across numerous libraries generated in a single pool in both eukaryotes and bacteria.
Because many samples can be pooled before library construction, RNAtag-Seq requires lower input RNA amounts per sample than existing protocols. Furthermore, as this method does not require poly(A) capture or enrichment, RNAtag-Seq can also accommodate highly fragmented RNA samples and can be used to profile all transcripts, including short and long as well as coding and noncoding RNAs, in both prokaryotic and eukaryotic samples. RNAtag-Seq can therefore be implemented in a wide variety of biological systems and for diverse applications of RNA-seq such as gene expression profiling in large-scale genetic and chemical screens; human population genetics studies; archived formalin-fixed, paraffin-embedded samples; protein-RNA interaction mapping; small RNA-seq; and simultaneous profiling of pathogen and host transcription during infection.
Online Methods
Culture growth and RNA isolation
Bacterial total RNA was isolated for mid-exponential LB cultures of Prochlorococcus marinus pastoris CCMP1986 (31% G+C), E. coli K-12 MG1655 (50% G+C) and Rhodobacter sphaeroides 2 4 1 uid57653 (67% G+C) as previously described21. In comparisons of RNAtag-Seq and dUTP, equal amounts of total RNA from these three organisms were mixed before library construction. Ciprofloxacin-susceptible and ciprofloxacin-resistant E. coli strains were provided by Brigham and Women's Hospital under permission from the Institutional Review Board of Partners Health Care, Protocol #2012P001062. In profiling transcriptional responses of E. coli to ciprofloxacin, cultures were grown to early log phase in Mueller-Hinton broth and treated with 2.5 mg/L of ciprofloxacin. At the indicated time points, ∼5 × 10⁸ cells were harvested by centrifugation, and total RNA was extracted using the Direct-Zol RNA Miniprep protocol (Zymo Research). Mouse tissue for differential expression analyses and K562 RNAs were purchased from Clontech (#636644, Mouse Total RNA Master Panel) and Ambion, respectively.
Generation and sequencing of cDNA libraries
K562 dUTP libraries were generated as described with rRNA depleted using the RNaseH approach22. Bacterial dUTP libraries were generated as described21 with rRNA depleted using with RiboZero (Epicentre). In all RiboZero reactions, the maximal amount recommended by the manufacturer per reaction was used to avoid an additional quantification step during library construction and ensure the RNA did not exceed the capacity of the solution. RNAtag-Seq cDNA libraries were generated according to the detailed protocol in the Supplementary Protocol. Briefly, 200-400 ng of total RNA was fragmented, depleted of genomic DNA and dephosphorylated before its ligation to barcoded adaptors with a 5′ phosphate and a 3′ blocking group. DNA adaptors carried 5′-AN8-3′ barcodes and RNA adaptors 5′-rArN6-3′ barcodes. Sequences of these barcodes are provided in the Supplementary Protocol and Supplementary Table 2. Barcoded RNAs were pooled and depleted of rRNA using the appropriate RiboZero rRNA depletion kit (Epicentre) for bacterial and K562 pools (8 samples per pool, Supplementary Table 2) and as previously described23 for mouse pools. These pools of barcoded RNAs were converted to Illumina cDNA libraries in three key steps: (i) reverse transcription of the RNA using a primer designed to the constant region of the barcoded adaptor; (ii) degradation of the RNA and ligation of a second adaptor to the single-stranded cDNA; (iii) PCR amplification using primers that target the constant regions of the 3′ and 5′ ligated adaptors and contain the full sequence of the Illumina sequencing adaptors (Fig. 1). Two SPRI cleanup steps are included following adaptor ligations to ensure efficient removal of adaptor dimers (<1% of our sequencing reads represented adaptor dimers). Modifications of the RNAtag-Seq protocol used in generation of mouse libraries are detailed in Appendix A in the Supplementary Protocol. cDNA libraries were sequenced on Illumina MiSeq or HiSeq2500
RNA-seq data analysis
For the analysis of RNAtag-Seq data, reads from each sample in the pool were identified on the basis of their associated barcode using in-house scripts. Up to one mismatch in the barcode was allowed with the caveat that it did not enable assignment to more than one barcode. Barcode sequences were removed from reads before alignment. Analysis of bacterial data was conducted as previously described22,24. Briefly, reads were aligned to the appropriate RefSeq reference genomes using BWA25. Gene annotations were obtained from RefSeq and Rfam26. The overall fragment coverage of genomic regions corresponding to features such as ORFs and rRNAs was conducted using an in-house pipeline as described22,24. To account for differences in the efficiency of rRNA depletion, we calculated normalized abundance per gene from the number of fragments per kilobase of that gene per million fragments aligned to all ORFs (FPKMO: fragments per kilobase of ORF per million fragments aligned to all ORFs). Sequencing reads from E. coli clinical isolates were aligned to the E. coli HS reference sequence (RefSeq accession NC_009800). SOS-responsive genes in E. coli HS were identified on the basis of their homologs in the SOS regulon of E. coli K-12 (ref. 27).
Analyses of K562 data were performed using the computational pipeline developed in Adiconis et al.22. Briefly, to calculate the number of read pairs per gene, we aligned reads to the human genome version 19 using Bowtie 0.12.7 (ref. 28) and calculated reads per gene using scripts based on the BamTools API29. Normalized read counts per gene were calculated using the RSEM package version 1.1.17 (ref. 30).
In the analysis of mouse tissue data, Bowtie 2 (ref. 31) was used to remove reads aligning to rRNA, and the remaining reads were aligned by RSEM30 to a mouse transcript reference files generated using UCSC annotations. RSEM was then used to calculate total and normalized reads per gene and genes that to which fewer than ten total reads aligned were eliminated from further analysis.
Custom software used to process and analyze RNA-Seq data software is not being made available as part of this publication.
Identifying a set of 32 DNA adaptors that work well together
To design a set of random barcoded DNA adaptors, we enumerated all possible 8-nt barcodes and then selected a random set of 96 barcodes that contained at least 3-nt distances with all other sequences in the selected set. This distance would allow us to assign a read even if with two sequencing errors within the 8-nt barcode. We then synthesized these 96 DNA adaptor with a 5′ adenosine followed by the barcode sequence. We ligated each of the barcodes to the same total RNA and measured the uniformity of coverage. We identified 32 adaptors that showed the lowest across-barcode variation (less than threefold).
A pooled strategy to identify large cohorts of adaptors that work well together
To identify a cohort of RNA adaptors that work well together, we synthesized an RNA adaptor containing a 5′ adenosine followed by a degenerate 6-nt barcode (N6) that should contain large complexity of all possible 6-nt barcodes. We ligated these N6 adaptors to poly(A)-selected mouse ES cell RNA and generated a library. We then sequenced this library and measured the total number of reads present for each individual N6 sequence. To account for differences in the number of reads due to differences in the relative abundance of the adaptor rather than its ligation efficiency, we sequenced the adaptor pool directly. We computed an enrichment score that is defined as the coverage of the RNA samples that contain a given barcode divided by the number of reads present for each barcode alone. Using this normalized score, we identified several cohorts of sequences that contained uniform coverage within the set (less than twofold variation) and a minimum nucleotide distance of 2 to allow for sequencing error correction. We chose a small cohort that contained 54 barcodes and synthesized these individually to generate a panel of barcodes.
Comparison of RNAtag-Seq and dUTP
To calculate coverage across K562 transcripts, we aligned reads using Bowtie 0.12.7 (ref. 28) to the human transcriptome obtained from the UCSC Genome Browser and calculated the distribution of reads along the length of these transcripts as described22. Coverage across bacterial ORFs was calculated using in-house scripts based on the alignment of reads to the genome. The calculation of the number of genes detected as a function of reads sequenced was conducted using code available in the Scotty package32.
Quantification of dinucleotide frequencies
Dinucleotide frequencies were calculated for the first two bases of reads aligning to E. coli from RNA-seq data generated from mixed P. marinus, E. coli and. R sphaeroides RNA. For read 1 in RNAtag-Seq data, sequences of barcodes plus the universal 3′ nucleotide were removed before alignment. Dinucleotide frequencies for all E. coli ORFs were generated using sliding two-base windows across the entire lengths of RefSeq-annotated protein-encoding genes.
Identification of differentially expressed genes
For differential expression analysis of E. coli, DESeq18 was used to compare total reads per ORF between relevant time points or conditions. At each time point and condition, the two antibiotic-resistant strains were treated as biological replicates as were the two antibiotic-susceptible strains. For differential expression analysis of mouse tissues, DESeq2 (ref. 33) was used to compare RSEM expected count values per gene. In both DESeq and DESeq2 analyses, adjusted P values (Padj) were used as cutoffs for statistical significance. Because RNA level patterns of some of the cell types analyzed are very similar, we compared all possible combinations of one cell type, two cell types and three cell types versus all other cell types and joined all genes sets with more than 40 genes in each comparison to generate the heat map in Figure 2a. Assignment and analysis of mouse Gene Ontology groups was conducted in R using the DAVID web service34.
Acknowledgments
We thank all members of Lander and Guttman labs for their help, especially J.M. Engreitz, P. McDonel and K. Sirokman; L. Gaffney for assistance with figures; and C. Nusbaum for helpful suggestions on the manuscript. We thank I. Antoshechkin and the Millard and Muriel Jacobs Genetics and Genomics Laboratory at Caltech. This work was supported by a US National Institutes of Health (NIH) Director's Early Independence Award (DP50D012190 to M. Guttman), funds from the Broad Institute of MIT and Harvard and the California Institute of Technology (M. Guttman) and funds from the US National Institute of Allergy and Infectious Diseases, NIH, Department of Health and Human Services, under contract no. HHSN272200900018C.
Footnotes
Accession codes. NCBI Sequence Read Archive: SRP051252.
Note: Any Supplementary Information and Source Data files are available in the online version of the paper.
Author Contributions: A.A.S. and M. Guttman conceived of the approach and developed the initial RNAtag-Seq protocol; A.A.S., C.S., G.G., D.C. and A.G. optimized and streamlined the RNAtag-Seq protocol; A.A.S., G.G., D.C., R.P.B., R.F.R. and M.M.P. generated RNA-seq libraries; A.K., J.C., N.N., M.B., M. Garber, M. Guttman and J.L. analyzed data; R.P.B., D.T.H., M. Guttman and J.L. designed differential expression experiments; M. Guttman and J.L. supervised the project and wrote the paper.
Competing Financial Interests: The authors declare competing financial interests: details are available in the online version of the paper.
References
- 1.Wang Z, Gerstein M, Snyder M. Nat Rev Genet. 2009;10:57–63. doi: 10.1038/nrg2484. [DOI] [PMC free article] [PubMed] [Google Scholar]
- 2.Mortazavi A, Williams BA, McCue K, Schaeffer L, Wold B. Nat Methods. 2008;5:621–628. doi: 10.1038/nmeth.1226. [DOI] [PubMed] [Google Scholar]
- 3.Wilhelm BT, et al. Nature. 2008;453:1239–1243. doi: 10.1038/nature07002. [DOI] [PubMed] [Google Scholar]
- 4.McHugh CA, Russell P, Guttman M. Genome Biol. 2014;15:203. doi: 10.1186/gb4152. [DOI] [PMC free article] [PubMed] [Google Scholar]
- 5.Garber M, Grabherr MG, Guttman M, Trapnell C. Nat Methods. 2011;8:469–477. doi: 10.1038/nmeth.1613. [DOI] [PubMed] [Google Scholar]
- 6.Nagalakshmi U, et al. Science. 2008;320:1344–1349. doi: 10.1126/science.1158441. [DOI] [PMC free article] [PubMed] [Google Scholar]
- 7.Levin JZ, et al. Nat Methods. 2010;7:709–715. doi: 10.1038/nmeth.1491. [DOI] [PMC free article] [PubMed] [Google Scholar]
- 8.Garraway LA, Lander ES. Cell. 2013;153:17–37. doi: 10.1016/j.cell.2013.03.002. [DOI] [PubMed] [Google Scholar]
- 9.Golub TR, et al. Science. 1999;286:531–537. doi: 10.1126/science.286.5439.531. [DOI] [PubMed] [Google Scholar]
- 10.Amit I, et al. Science. 2009;326:257–263. doi: 10.1126/science.1179050. [DOI] [PMC free article] [PubMed] [Google Scholar]
- 11.Lamb J, et al. Science. 2006;313:1929–1935. doi: 10.1126/science.1132939. [DOI] [PubMed] [Google Scholar]
- 12.Ravasi T, et al. Cell. 2010;140:744–752. doi: 10.1016/j.cell.2010.01.044. [DOI] [PMC free article] [PubMed] [Google Scholar]
- 13.Hashimshony T, Wagner F, Sher N, Yanai I. Cell Rep. 2012;2:666–673. doi: 10.1016/j.celrep.2012.08.003. [DOI] [PubMed] [Google Scholar]
- 14.Jaitin DA, et al. Science. 2014;343:776–779. doi: 10.1126/science.1247651. [DOI] [PMC free article] [PubMed] [Google Scholar]
- 15.Islam S, et al. Genome Res. 2011;21:1160–1167. doi: 10.1101/gr.110882.110. [DOI] [PMC free article] [PubMed] [Google Scholar]
- 16.Kivioja T, et al. Nat Methods. 2012;9:72–74. doi: 10.1038/nmeth.1778. [DOI] [PubMed] [Google Scholar]
- 17.Islam S, et al. Nat Methods. 2014;11:163–166. doi: 10.1038/nmeth.2772. [DOI] [PubMed] [Google Scholar]
- 18.Anders S, Huber W. Genome Biol. 2010;11:R106. doi: 10.1186/gb-2010-11-10-r106. [DOI] [PMC free article] [PubMed] [Google Scholar]
- 19.Barczak AK, et al. Proc Natl Acad Sci USA. 2012;109:6217–6222. doi: 10.1073/pnas.1119540109. [DOI] [PMC free article] [PubMed] [Google Scholar]
- 20.Michel B. PLoS Biol. 2005;3:e255. doi: 10.1371/journal.pbio.0030255. [DOI] [PMC free article] [PubMed] [Google Scholar]
- 21.Giannoukos G, et al. Genome Biol. 2012;13:R23. doi: 10.1186/gb-2012-13-3-r23. [DOI] [PMC free article] [PubMed] [Google Scholar]
- 22.Adiconis X, et al. Nat Methods. 2013;10:623–629. doi: 10.1038/nmeth.2483. [DOI] [PMC free article] [PubMed] [Google Scholar]
- 23.Guttman M, Russell P, Ingolia NT, Weissman JS, Lander ES. Cell. 2013;154:240–251. doi: 10.1016/j.cell.2013.06.009. [DOI] [PMC free article] [PubMed] [Google Scholar]
- 24.Haas BJ, Chin M, Nusbaum C, Birren BW, Livny J. BMC Genomics. 2012;13:734. doi: 10.1186/1471-2164-13-734. [DOI] [PMC free article] [PubMed] [Google Scholar]
- 25.Li H, Durbin R. Bioinformatics. 2009;25:1754–1760. doi: 10.1093/bioinformatics/btp324. [DOI] [PMC free article] [PubMed] [Google Scholar]
- 26.Gardner PP, et al. Nucleic Acids Res. 2009;37:D136–D140. doi: 10.1093/nar/gkn766. [DOI] [PMC free article] [PubMed] [Google Scholar]
- 27.Novichkov PS, et al. BMC Genomics. 2013;14:745. doi: 10.1186/1471-2164-14-745. [DOI] [PMC free article] [PubMed] [Google Scholar]
- 28.Langmead B, Trapnell C, Pop M, Salzberg SL. Genome Biol. 2009;10:R25. doi: 10.1186/gb-2009-10-3-r25. [DOI] [PMC free article] [PubMed] [Google Scholar]
- 29.Barnett DW, Garrison EK, Quinlan AR, Stromberg MP, Marth GT. Bioinformatics. 2011;27:1691–1692. doi: 10.1093/bioinformatics/btr174. [DOI] [PMC free article] [PubMed] [Google Scholar]
- 30.Li B, Dewey CN. BMC Bioinformatics. 2011;12:323. doi: 10.1186/1471-2105-12-323. [DOI] [PMC free article] [PubMed] [Google Scholar]
- 31.Langmead B, Salzberg SL. Nat Methods. 2012;9:357–359. doi: 10.1038/nmeth.1923. [DOI] [PMC free article] [PubMed] [Google Scholar]
- 32.Busby MA, Stewart C, Miller CA, Grzeda KR, Marth GT. Bioinformatics. 2013;29:656–657. doi: 10.1093/bioinformatics/btt015. [DOI] [PMC free article] [PubMed] [Google Scholar]
- 33.Love MI, Huber W, Anders S. Genome Biol. 2014;15:550. doi: 10.1186/s13059-014-0550-8. [DOI] [PMC free article] [PubMed] [Google Scholar]
- 34.Jiao X, et al. Bioinformatics. 2012;28:1805–1806. doi: 10.1093/bioinformatics/bts251. [DOI] [PMC free article] [PubMed] [Google Scholar]