

Abstract
Background and Purpose
Molecular and genetic testing is becoming increasingly relevant in GBM. We sought to determine whether dynamic susceptibility contrast (DSC) magnetic resonance imaging (MRI) perfusion imaging could predict EGFR-defined subtypes of GBM.
Materials and Methods
We retrospectively identified 106 consecutive glioblastoma (GBM) patients with known EGFR gene amplification, and a subset of 65 patients who also had known EGFRvIII gene mutation status. All patients underwent T2* DSC MRI perfusion. DSC perfusion maps and T2* signal intensity time curves were evaluated, and the following measures of tumor perfusion were recorded: (1) maximum relative cerebral blood volume (rCBV), (2) relative peak height (rPH), and (3) percent signal recovery (PSR). The imaging metrics were correlated to EGFR gene amplification and EGFRvIII mutation status using univariate analyses.
Results
EGFR amplification was present in 44 (41.5%) subjects and absent in 62 (58.5%). Among the 65 subjects who had undergone EGFRvIII mutation transcript analysis, 18 subjects (27.7%) tested positive for the EGFRvIII mutation, whereas 47 (72.3%) did not. Higher median rCBV (3.31 versus 2.62, p = 0.01) and lower PSR (0.70 versus 0.78, p = 0.03) were associated with high levels of EGFR amplification. Higher median rPH (3.68 versus 2.76, p = 0.03) was associated with EGFRvIII mutation.
Conclusion
DSC MRI perfusion may have a role in identifying patients with EGFR gene amplification and EGFRvIII gene mutation status, potential targets for individualized treatment protocols. Our results raise the need for further investigation for imaging biomarkers of genetically unique GBM subtypes.
Keywords: Glioblastoma, MRI, Dynamic susceptibility contrast, Perfusion, EGFR, Gene
Introduction
Advanced MRI imaging techniques are gaining increasing acceptance in the diagnosis and evaluation of treatment response in patients with glioblastoma (GBM). In treatment-naïve tumors, dynamic susceptibility contrast (DSC) magnetic resonance imaging (MRI) perfusion techniques have been shown to correlate well with glial tumor grade as well as histological features such as cellular proliferation, necrosis, and vascular proliferation [1–3]. DSC perfusion techniques have also been used to study post-treatment changes in high-grade glial tumors [4, 5], especially as conventional MRI does a relatively poor job in differentiating tumor progression from treatment effects and pseudoprogression [6] in patients with GBM.
However, the role of such newer perfusion MRI techniques in the care of high-grade glial tumor patients remains unclear, as the prognosis of patients with GBM remains poor even with standard of care based on radiation therapy with concurrent and adjuvant temozolomide [7]. As a consequence, there has been a recent emphasis in defining genetically unique subtypes of GBM that might serve as targets of individualized therapy strategies [8–10], with recent reports [9, 10] focusing on the role of imaging parameters in prediction of gene expression and specific GBM subtypes. The expression of EGFR, a cell membrane tyrosine kinase receptor, has been described as one in a number of mechanisms underlying the aberrant and rapid cell proliferation seen in a wide range of solid tumors, including GBM [11–13]. Furthermore, the presence of EGFRvIII, a mutant form of the EGFR receptor with deletion of exons 2 through 7 in the extracellular portion of the receptor, has been implicated in tumor progression in approximately 30% of GBM patients [14–16]. EGFR tyrosine kinase inhibitors such as gefitinib, erlotinib, afatinib and lapatinib [17, 18] are being explored as potential treatments for malignant gliomas, and an EGFRvIII-targeted peptide vaccine [19] is currently in advanced stages of clinical development. Increasingly, drug development is focusing on pretreatment selection of these unique genetic signatures, and identifying potential imaging biomarkers allowing for non-invasive determination of such signatures is of high interest.
The expression of EGFR amplification status has been previously investigated using metrics from conventional contrast-enhanced MRI imaging analysis [20–22], but has not, to our knowledge, been studied with MRI perfusion techniques, with the exception of a single report focusing on EGFRvIII gene mutation expression [23]. Given the known role of EGFR in tumor cell invasiveness and angiogenesis [11, 24], the primary aim of our study was to determine whether DSC MRI perfusion metrics predict EGFR gene amplification in general.
Methods
Protocol Approval and Informed Consent
The proposed study was reviewed by our local institutional review board and was granted a waiver of informed consent. The study was also deemed compliant with Health Insurance Portability and Accountability Act regulations and was approved by the hospital’s privacy board.
Subjects
A hospital database was retrospectively searched from February 2010 through July 2011 to determine the final study cohort according to the following inclusion criteria: (1) pathologically confirmed de novo GBM diagnosis after biopsy or resection, (2) known EGFR amplification status determined from initial biopsy or resection, and (3) preoperative DSC MRI perfusion scan on treatment-naïve GBMs with associated matching postcontrast axial T1-weighted images. Subjects were excluded from our final cohort if only conventional preoperative MRI was performed (without DSC MRI perfusion) or if there was greater than 100 days between MRI and EGFR status determination at pathology. We also recorded EGFRvIII mutation expression in the subset of subjects who had this testing performed as part of their routine tissue analysis. EGFR analysis was performed in patients during this period to determine potential eligibility for clinical trials or as part of the standard of care at the time.
Perfusion MRI Parameters
DSC MRI was obtained using gradient-echo echo-planar images (repetition time/echo time = 1,000–1,200/40–50 ms, matrix = 96 × 96–128 × 128, flip angle = 60°, number of slices = 12–18). Contrast (gadopentate dimeglumine) was injected though a peripheral venous catheter (18–21 gauge) using a power injector at 2–5 mL/s (0.2 mL/kg to a maximum of 20 mL) immediately followed by a 20-mL saline flush at the same rate. Image data were acquired every second for a total of 90 s.
The DSC images were transferred to an offline commercially available workstation (Advantage Workstation, GE Healthcare, Waukesha, WI) and processed using commercially available software (FuncTools 4.5, GE Healthcare). Negative enhancement integral perfusion maps were reconstructed with gamma variate curve-fitting correction [25, 26]. Two board-certified radiologists supervised ROI analysis of the DSC MRI studies while blinded to the subjects’ EGFR amplification status. Both radiologists were board certified with 7 and 13 years of experience, respectively, with one of the two holding an additional Certificate of Added Qualification in Neuroradiology. In a technique validated and shown to achieve reproducible maximum relative cerebral blood volume (rCBV) measurements [5, 27], multiple fixed-diameter (approximately 50 mm2) regions of interest (ROIs) were placed over the enhancing mass to determine areas of maximum rCBV and compared with control ROIs placed over the contralateral normal-appearing brain parenchyma. The single maximum rCBV value derived from this technique was used to calculate tumor maximum rCBV using contralateral normal-appearing brain parenchyma. Regions of susceptibility from hemorrhage, bone, air and blood vessels were explicitly excluded from the ROIs.
Perfusion MRI Signs
The rCBV measurements were recorded as CBVlesion/CBVnormal-appearing contralateral brain. The T2* signal intensity–time curve corresponding to the tumor rCBV ROI was solved for S0 (baseline signal intensity before contrast injection), Smin (minimal signal intensity at peak of contrast bolus), and S1 (end signal intensity at 60 s). Relative peak height (rPH) was calculated as [(S0 − Smin)lesion/(S0 − Smin)normal-appearing contralateral brain], and peak signal recovery (PSR) as [(S1 − Smin)/(S0 − Smin)]. Lower PSR correlates with delayed return of the perfusion curve to baseline and thus higher permeability and capillary leakiness [4, 28]. rPH represents the maximum change in T2* signal intensity and has been shown to reflect tumor capillary blood volume and is correlated with rCBV [4, 29].
EGFR Analysis
The EGFR studies were routinely performed for patients operated on at our tertiary care cancer center, as part of their histology evaluation in a Clinical Laboratory Improvement Amendments-certified pathology laboratory, provided there was sufficient tissue available. Interphase/nuclear fluorescence in situ hybridization techniques on paraffin sections were used to determine EGFR amplification status. In each specimen, approximately 200 cells were analyzed and the maximum level of EGFR amplification in terms of chromosome copies per cell was reported. Given the lack of a standardized definition of EGFR amplification, a threshold of ≥ 10 copies per cell was the threshold used to define EGFR amplification [15]. EGFRvIII mutation transcript status was detected by real-time PCR detection of the EGFRvIII transcript from extracted tumor RNA samples.
Statistical Analysis
Univariate analysis using a Wilcoxon rank-sum test was performed to determine the relationship and potential correlation between EGFR amplification and EGFRvIII mutation status and the measured perfusion metrics (rCBV, rPH, and PSR). Hochberg and Benjamini’s false discovery rate (FDR) procedure was used to adjust for the simultaneous multiple testing. Receiver operating characteristic curve (ROC) analysis with calculation of the area under the curve (AUC) was performed for statically significant perfusion metrics to further assess potential clinical utility. Optimal cutoffs for any MR perfusion (MRP) metrics found to be statistically significant after FDR correction were performed with an attempt to maximize combined sensitivity and specificity. Fisher exact test was used to examine a possible relationship between EGFR amplification and EGFRvIII mutation status. Statistical significance was set at p = 0.05. SAS release 9.2 (SAS institute, Carry, NC), R version 2.9 package ROCR, and gregmisc were used for analysis.
Results
Subjects
A total of 275 subjects diagnosed with GBM from initial tissue sampling via biopsy or resection and known EGFR gene amplification status were found through our initial search. Of this cohort, 106 subjects had preoperative DSC MR perfusion imaging available for postprocessing analysis. Of the 106 subjects, 73 had MRIs performed on 1.5-T magnets and 33 had their MRI done on 3.0-T magnets. The median age of our subjects was 66.4 (range: 30.2–89.4) years, with 59 men (55.7%) and 47 women (44.3%) present. The median time between the preoperative perfusion scan and surgery was 4.5 (maximum: 29) days. At the time of EGFR tissue sampling, gross total resection was performed in 38 subjects, subtotal resection in 53 subjects, and biopsy in 15 subjects. EGFR gene amplification status was determined in all 106 subjects, while EGFRvIII transcript status was available in a subset of 65 of the 106 subjects.
EGFR Tissue Analysis
A total of 44 (41.5%) subjects had high levels of EGFR amplification, while 62 (58.5%) did not. Among the 65 subjects with EGFRvIII mutation transcript analysis, 18 (27.7%) tested positive for the EGFRvIII mutation, while 47 (72.3%) did not. When EGFR amplification was absent, EGFRvIII mutation was also absent in 85% of the subjects (p < 0.001). When EGFR amplification was present, EGFRvIII mutation was present in 50% of the subjects.
MRI Perfusion Metrics and EGFR Amplification Status
The DSC perfusion metrics and relationship to high EGFR amplification are shown in Table 1. Significantly higher median rCBV (3.31 versus 2.62, p = 0.01; FDR adjusted p = 0.03) and lower PSR (0.70 versus 0.78, p = 0.03; FDR adjusted p = 0.052) was associated with and marginally associated with high levels of EGFR amplification, respectively. Using an rCBV cutoff of 3.03, a sensitivity of 0.60 and specificity of 0.68 was noted. An rCBV cutoff of 2.64 yielded a lower sensitivity (0.52) but a higher specificity (0.80). A representative case is shown in Fig. 1. rPH did not significantly differ between EGFR-amplified and EGFR-non-amplified groups (p = 0.30). ROC analysis of rCBV and PSR demonstrated AUC of 0.646 and 0.621, respectively, suggesting moderate predictive power.
Table 1.
Analysis of relationship between perfusion magnetic resonance imaging metrics and EGFR gene amplification statusa
| Perfusion MRI | Not amplified (n = 62) | Amplified (n = 44) | p-value |
|---|---|---|---|
| rCBV | 2.62 (1.00–7.40) | 3.31 (1.00–6.73) | 0.01 |
| PSR | 0.78 (0.26–1.59) | 0.70 (0.21–0.96) | 0.03 |
| rPH | 2.79 (0.72–8.03) | 3.07 (1.11–6.12) | 0.30 |
Values are expressed as median (range)
MRI magnetic resonance imaging, rCBV relative cerebral blood volume, PSR percent signal recovery, rPH relative peak height
Fig. 1.
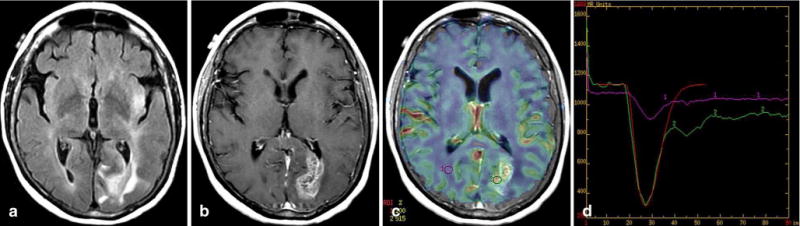
Glioblastoma with EGFR amplification (> 20 copies) and positive EGFRvIII transcript. Axial fluid-attenuated inversion recovery image (a), contrast-enhanced T1-weighted image (b), relative cerebral blood volume (rCBV) map overlaid on contrast T1-weighted image (c), and T2* time–intensity curve (d) demonstrate increased perfusion and leakiness in the heterogeneously enhancing tumor in the left occipital lobe, with rCBV = 5.2, percent signal recovery = 0.68, and relative peak height = 4.58. Multiple small regions of interest (ROIs) were placed in the tumor, but only one is shown for simplicity. The red line in (d) represents the fitted gamma variate curve for the tumor ROI2 (green is uncorrected curve)
MRI Perfusion Metrics and EGFRvIII Mutation Status
The DSC perfusion metrics and relationship to EGFRvIII mutation are shown in Table 2. There was a trend that higher rPH (3.68 versus 2.76, p = 0.03; FDR adjusted p = 0.10) might be more likely related to presence of the EGFRvIII mutation. A representative case is shown in Fig. 2. The remaining MRI perfusion metrics were not significant (p > 0.19). ROC analysis of rPH demonstrated AUC of 0.672, suggesting moderate predictive power.
Table 2.
Analysis of relationship between perfusion magnetic resonance imaging metrics and EGFRvIII mutation statusa
| Perfusion MRI | Mutation absent (n = 47) | Mutation present (n = 18) | p-value |
|---|---|---|---|
| rCBV | 3.04 (1.40–6.73) | 3.53 (1.57–6.08) | 0.19 |
| PSR | 0.75 (0.21–1.59) | 0.80 (0.46–0.96) | 0.57 |
| rPH | 2.76 (0.87–8.03) | 3.68 (2.10–6.12) | 0.03 |
Values expressed as median (range)
MRI magnetic resonance imaging, rCBV relative cerebral blood volume, PSR percent signal recovery, rPH relative peak height
Fig. 2.
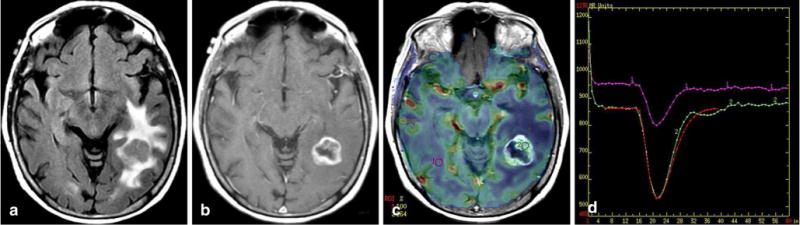
Glioblastoma with no EGFR amplification and no EGFRvIII mutation. Axial fluid-attenuated inversion recovery image (a), contrast T1-weighted image (b), relative cerebral blood volume (rCBV) map overlaid on contrast T1-weighted image (c), and T2* time–intensity curve (d) demonstrate increased perfusion and leakiness in the heterogeneously enhancing tumor in the left occipital lobe, with rCBV = 2.6, percent signal recovery = 0.93, and relative peak height = 2.10. The red line in (d) represents the fitted gamma variate curve for the tumor ROI2 (green is uncorrected curve)
Discussion
In our cohort of treatment-naïve GBMs undergoing initial tissue sampling, 41.5% demonstrated high levels of EGFR amplification, which fall within the range of published levels of EGFR amplification in GBM, which is 40–70% [11]. Similarly, our rate of EGFRvIII gene mutation of 27.7% is also in line with the relative frequency of this gene mutation in GBM patients, reported to be in the range of 20–30% [14]. Our findings of the presence of the EGFRvIII mutation 50% of the time when EGFR amplification was present and the isolated presence of the EGFRvIII mutation without EGFR amplification in 15% of cases are comparable with other series published in the literature [30].
We found higher rCBV was associated with high EGFR gene amplification, while PSR was significantly lower in the EGFR gene-amplified group. rCBV has been described as a marker of increased glioma microvessel density and angiogenesis on histopathologic studies [31], with higher rCBV levels correlating with increases in MIB-1, a histopathologic index of glioma cell proliferation [32]. In addition, rCBV values have been shown to be useful in the preoperative prediction of glioma grade [2], with higher rCBV values predictive of higher World Health Organization glioma grade. We hypothesize that EGFR amplification contributes to relatively higher rCBV via increases in cellular proliferation, angiogenesis, and neovascularity, all well-studied tumorigenic mechanisms of EGFR amplification in solid tumors [11, 13, 15, 24].
PSR was also significantly lower in tumors with EGFR amplification. PSR, a measure of the percentage signal recovery toward baseline after the initial drop in signal intensity after the first pass of gadolinium during a perfusion study, provides an estimate of tumor leakiness and is therefore a valuable adjunct to rCBV. It is relatively simple to derive from the time–signal intensity curve in DSC perfusion studies and does not require additional postprocessing. PSR has been described by Mangla et al. [28] as a potentially useful means to differentiate GBM from lymphoma and metastases, with decreases in PSR multifactorial in cause but likely related to an increase in capillary permeability and blood-brain barrier disruption. Although the mechanisms are complex and still being elucidated and will require histologic verification, by increasing cell proliferation, motility, and invasiveness of GBM cells [30], we hypothesize that the EGFR amplification may also contribute to leakiness and increased capillary permeability. Although this assertion will require further confirmatory studies, it is plausible that decreases in PSR may reflect increased capillary leakiness, decreased intravascular contrast, and a decreased percent of T2* signal recovery after first pass of gadolinium, all phenomena that may be seen more frequently in EGFR-amplified GBMs.
In our secondary prespecified subset analysis of the correlation of perfusion metrics and EGFRvIII amplification status, rCBV and PSR values were not associated with EGFRvIII amplification. As such, we were not able to replicate the findings of Tykocinski et al. [23], who noted an increased relative tumor blood volume in EGFRvIII mutation specimens relative to tumors without expression of the mutation. However, our data did show a trend toward increased rCBV in the EGFRvIII cohort. As our study was designed primarily to detect differences across EGFR amplifications in general, as this has not been previously studied, it is conceivable that our subset analysis of 65 patients with EGFRvIII classification was underpowered to detect differences in rCBV between groups, as Tykocinksi et al. performed their analysis on 132 patients with known EGFRvIII status. We did find significant correlation, however, between higher rPH and expression of the EGFRvIII gene mutation. The EGFRvIII mutation has been shown to have clear roles in GBM invasion, angiogenesis, and elevation of cell proliferation rates and reduction in apoptotic rates [14]. These factors, especially the angiogenic and neovascularity increases mediated by EGFRvIII mutant gene expression, may explain the relatively increased tumor capillary blood volume, evidenced by rPH elevation, seen in the EGFRvIII mutant group. rPH, defined as a measure of the maximum signal intensity drop from baseline during first bolus of gadolinium passage, has been shown to reflect total capillary volume and has been validated as a simple measure for local relative tumor hypervascularity [33]. As such, the role of rPH as a surrogate for capillary blood volume does appear plausible given the known molecular mechanisms of the EGFRvIII mutation and is consistent with the findings of Tykocinski et al. [23], although further histopathologic investigation is warranted.
It is interesting to note that although rPH and rCBV are highly correlated [4, 5, 33], they do not measure identical hemodynamic parameters, which may in part explain the statistical correlation of rCBV (but not rPH) with EGFR amplification and the similar correlation of rPH (but not rCBV) with EGFRvIII gene mutation status. rPH values only reflect the magnitude of signal intensity change relative to a background control. rCBV is calculated from the area over the time–signal intensity curve, incorporating information about the magnitude and duration of the signal intensity change, and possibly affected by changes in the rate of contrast injection and/or blood flow. In our cohort, although the correlation between rPH and rCBR was not entirely preserved, it is valuable to note that rPH values trended higher in EGFR-amplified tumors and that rCBV trended higher in EGFRvIII-mutated GBMs without achieving statistical significance. An alternative explanation for this divergence in correlation of rCBV and rPH may simply be related to biologic variability in individual time–signal intensity curves, with correlation between rCBV and rPH possibly more apparent in a larger patient population. In addition, we noted lower PSR in EGFR-amplified tumors but not in the subset of patients with the EGFRvIII mutation. Whether this reflects differential blood–brain barrier integrity between these two subsets of patients is unclear, and continued histopathologic and molecular characterization of EGFR’s role in GBM tumorigenesis is needed.
Three reports in the literature [20–22] have described the role of conventional MRI-derived metrics in predicting EGFR gene expression. EGFR amplification has been associated with lower apparent diffusion coefficient measurements [22], high contrast-to-necrosis ratio [20], T2-bright volume-to-enclosed T1-enhancing volume ratio [21], and T2 border sharpness coefficients [21]. Our work, as well as previous studies showing the prognostic utility of DSC perfusion in predicting tumor grade [2] or other important molecular features [9, 10], justify continued investigation of the role of preoperative perfusion imaging for presumed glial tumors.
The clinical value of preoperative, non-invasive determination of EGFR amplification and EGFRvIII mutation status warrants discussion. Targeted treatments for specific EGFR-defined subtypes of GBM have or are undergoing investigation in clinical trials [17–19, 34–36]. The possibility of neoadjuvant presumptive EGFR-targeted therapy before surgery might be possible if one or a combination of multiple imaging biomarkers could reliably predict genetic subtypes of GBM. In the future, it is possible that a multiparametric imaging biomarker approach might define physiologic signature of tumors likely to respond to certain targeted therapies. Furthermore, in those cases where tissue sampling is not feasible (such as in patients who are poor surgical candidates or with otherwise unresectable disease), imaging surrogates of gene expression will be of critical value in evaluating possible individualized treatment therapies. Finally, research from The Cancer Genome Atlas Research Network has proposed the molecular and genetic subtyping of GBMs to better reflect the underlying pathophysiologies in these heterogeneous tumors. In this classification scheme, EGFR amplification was found in 97% of the Classical subtype and rarely in the Mesenchymal, Proneural and Neural subtypes [37]. EGFR status may therefore help determine Classical subtype and its implications for tumor prognosis and progression.
There are several limitations of our study. First, although we did find statistically significant correlations between MRI perfusion metrics, the relatively limited sensitivity and specificity of these metrics in predicting EGFR genotypes limit the clinical value of this technique. This is especially the case given the increasingly availability of histopathology from surgical specimens to determine EGFR expression. Further work with a larger cohort of patients and a multiparametric approach may help increase the predictive power of preoperative advanced MRI imaging and may allow for the characterization of more robust imaging signatures of EGFR GBM gene expression. Second, given the variability in EGFR expression within a given tumor [30], our pathologic sampling may not have correlated to our ROI analysis on perfusion maps, as the exact sites of tissue sampling were not recorded in the retrospectively collected data. However, some degree of homogeneity in gene expression is generally observed [31] in histopathologic samples, and further validation of this study with locus-specific radiologic–pathologic correlations could support our initial findings. Third, in our study, we did not perform contrast-leakage correction by administering a preload contrast dose. In our own clinical and research experience, DSC MRI without leakage correction has had accurate and clinically useful results. More importantly, our personal experience has been corroborated by a recent study [38] in which Toh et al. found that CBV without contrast-leakage correction had superior diagnostic accuracy compared with CBV with contrast leakage in differentiating the histology of primary brain tumors, including GBM. Uncertainty regarding the best method for contrast-leakage correction and whether leakage correction actually improves discrimination of EGFR gene expression with DSC MRP requires direct comparison of these techniques in future investigations. Fourth, the roles of new MRP techniques, including arterial spin labeling and dynamic contrast-enhanced techniques, were not included in this study, and therefore, the applicability of our findings to these techniques requires further study. Finally, we included both 1.5-T and 3.0-T scanner techniques in our study, which could limit the generalizability of our findings to a specific magnet field strength. The effects of different magnet field strengths on our conclusions, however, are relatively mitigated by our use of relative perfusion ratios using the contralateral brain as reference as opposed to absolute perfusion measurements.
Conclusions
Our study demonstrates a significant association between preoperative T2* DSC MR perfusion metrics and EGFR amplification and EGFRvIII mutation status in GBM. Further studies with larger patient cohorts and histopathologic correlation are needed to further explore the clinical utility of preoperative measurement of hemodynamic imaging biomarkers in the treatment of patients with GBM.
Abbreviations
- AUC
Area under the curve
- DSC
Dynamic susceptibility contrast
- EGFR
Epidermal growth factor receptor
- EGFRvIII
Epidermal growth factor receptor variant III
- GBM
Glioblastoma
- rCBV
Relative cerebral blood volume
- ROC
Receiver operating characteristic
- rPH
Relative peak height
- PSR
Percent signal recovery
Footnotes
Conflict of Interest On behalf of all authors, the corresponding author states that there is no conflict of interest.
Contributor Information
A. Gupta, Department of Radiology, Weill Cornell Medical College and New York Presbyterian Hospital, New York, NY, USA.
R. J. Young, Email: youngr@mskcc.org, Department of Radiology, Memorial Sloan–Kettering Cancer Center, 1275 York Avenue, MRI-1156, 10065 New York, NY, USA; Brain Tumor Center, Memorial Sloan–Kettering Cancer Center, New York, NY, USA.
A. D. Shah, Department of Radiology, Memorial Sloan–Kettering Cancer Center, 1275 York Avenue, MRI-1156, 10065 New York, NY, USA.
A. D. Schweitzer, Department of Radiology, Memorial Sloan–Kettering Cancer Center, 1275 York Avenue, MRI-1156, 10065 New York, NY, USA.
J. J. Graber, Department of Neurology, Memorial Sloan–Kettering Cancer Center, New York, NY, USA.
W. Shi, Department of Epidemiology and Biostatistics, Memorial Sloan–Kettering Cancer Center, New York, NY, USA.
Z. Zhang, Department of Epidemiology and Biostatistics, Memorial Sloan–Kettering Cancer Center, New York, NY, USA.
J. Huse, Department of Pathology, Memorial Sloan–Kettering Cancer Center, New York, NY, USA.
A. M. P. Omuro, Brain Tumor Center, Memorial Sloan–Kettering Cancer Center, New York, NY, USA; Department of Neurology, Memorial Sloan–Kettering Cancer Center, New York, NY, USA.
References
- 1.Essock-Burns E, Lupo JM, Cha S, et al. Assessment of perfusion MRI-derived parameters in evaluating and predicting response to antiangiogenic therapy in patients with newly diagnosed glioblastoma. Neuro Oncol. 2011;13:119–31. doi: 10.1093/neuonc/noq143. [DOI] [PMC free article] [PubMed] [Google Scholar]
- 2.Law M, Yang S, Wang H, et al. Glioma grading: sensitivity, specificity, and predictive values of perfusion MR imaging and proton MR spectroscopic imaging compared with conventional MR imaging. AJNR Am J Neuroradiol. 2003;24:1989–98. [PMC free article] [PubMed] [Google Scholar]
- 3.Barajas RF, Jr, Phillips JJ, Parvataneni R, et al. Regional variation in histopathologic features of tumor specimens from treatment-naive glioblastoma correlates with anatomic and physiologic MR imaging. Neuro Oncol. 2012;14:942–54. doi: 10.1093/neuonc/nos128. [DOI] [PMC free article] [PubMed] [Google Scholar]
- 4.Young RJ, Gupta A, Shah AD, et al. MRI perfusion in determining pseudoprogression in patients with glioblastoma. Clin Imaging. 2013;37:41–9. doi: 10.1016/j.clinimag.2012.02.016. [DOI] [PMC free article] [PubMed] [Google Scholar]
- 5.Barajas RF, Jr, Chang JS, Segal MR, et al. Differentiation of recurrent glioblastoma multiforme from radiation necrosis after external beam radiation therapy with dynamic susceptibility-weighted contrast-enhanced perfusion MR imaging. Radiology. 2009;253:486–96. doi: 10.1148/radiol.2532090007. [DOI] [PMC free article] [PubMed] [Google Scholar]
- 6.Young RJ, Gupta A, Shah AD, et al. Potential utility of conventional MRI signs in diagnosing pseudoprogression in glioblastoma. Neurology. 2011;76:1918–24. doi: 10.1212/WNL.0b013e31821d74e7. [DOI] [PMC free article] [PubMed] [Google Scholar]
- 7.Stupp R, Mason WP, van den Bent MJ, et al. Radiotherapy plus concomitant and adjuvant temozolomide for glioblastoma. N Engl J Med. 2005;352:987–96. doi: 10.1056/NEJMoa043330. [DOI] [PubMed] [Google Scholar]
- 8.Vitucci M, Hayes DN, Miller CR. Gene expression profiling of gliomas: merging genomic and histopathological classification for personalised therapy. Br J Cancer. 2011;104:545–53. doi: 10.1038/sj.bjc.6606031. [DOI] [PMC free article] [PubMed] [Google Scholar]
- 9.Jain R, Poisson L, Narang J, et al. Genomic mapping and survival prediction in glioblastoma: molecular subclassification strengthened by hemodynamic imaging biomarkers. Radiology. 2013 Apr;267(1):212–20. doi: 10.1148/radiol.12120846. Epub 2012 Dec 13. [DOI] [PMC free article] [PubMed] [Google Scholar]
- 10.Jain R, Poisson L, Narang J, et al. Correlation of perfusion parameters with genes related to angiogenesis regulation in glioblastoma: a feasibility study. AJNR Am J Neuroradiol. 2012;33:1343–8. doi: 10.3174/ajnr.A2956. [DOI] [PMC free article] [PubMed] [Google Scholar]
- 11.Huang PH, Xu AM, White FM. Oncogenic EGFR signaling networks in glioma. Sci Signal. 2009;2:re6. doi: 10.1126/scisignal.287re6. [DOI] [PubMed] [Google Scholar]
- 12.Mellinghoff IK, Wang MY, Vivanco I, et al. Molecular determinants of the response of glioblastomas to EGFR kinase inhibitors. N Engl J Med. 2005;353:2012–24. doi: 10.1056/NEJMoa051918. [DOI] [PubMed] [Google Scholar]
- 13.Lal A, Glazer CA, Martinson HM, et al. Mutant epidermal growth factor receptor up-regulates molecular effectors of tumor invasion. Cancer Res. 2002;62:3335–9. [PubMed] [Google Scholar]
- 14.Gan HK, Kaye AH, Luwor RB. The EGFRvIII variant in glioblastoma multiforme. J Clin Neurosci. 2009;16:748–54. doi: 10.1016/j.jocn.2008.12.005. [DOI] [PubMed] [Google Scholar]
- 15.Liu L, Backlund LM, Nilsson BR, et al. Clinical significance of EGFR amplification and the aberrant EGFRvIII transcript in conventionally treated astrocytic gliomas. J Mol Med (Berl) 2005;83:917–26. doi: 10.1007/s00109-005-0700-2. [DOI] [PMC free article] [PubMed] [Google Scholar]
- 16.Pelloski CE, Ballman KV, Furth AF, et al. Epidermal growth factor receptor variant III status defines clinically distinct subtypes of glioblastoma. J Clin Oncol. 2007;25:2288–94. doi: 10.1200/JCO.2006.08.0705. [DOI] [PubMed] [Google Scholar]
- 17.Uhm JH, Ballman KV, Wu W, et al. Phase II evaluation of gefitinib in patients with newly diagnosed grade 4 astrocytoma: Mayo/North central cancer treatment group study N0074. Int J Radiat Oncol Biol Phys. 2011;80:347–53. doi: 10.1016/j.ijrobp.2010.01.070. [DOI] [PMC free article] [PubMed] [Google Scholar]
- 18.Peereboom DM, Shepard DR, Ahluwalia MS, et al. Phase II trial of erlotinib with temozolomide and radiation in patients with newly diagnosed glioblastoma multiforme. J Neurooncol. 2010;98:93–9. doi: 10.1007/s11060-009-0067-2. [DOI] [PubMed] [Google Scholar]
- 19.Sampson JH, Heimberger AB, Archer GE, et al. Immunologic escape after prolonged progression-free survival with epidermal growth factor receptor variant III peptide vaccination in patients with newly diagnosed glioblastoma. J Clin Oncol. 2010;28:4722–9. doi: 10.1200/JCO.2010.28.6963. [DOI] [PMC free article] [PubMed] [Google Scholar]
- 20.Diehn M, Nardini C, Wang DS, et al. Identification of noninvasive imaging surrogates for brain tumor gene-expression modules. Proc Natl Acad Sci U S A. 2008;105:5213–8. doi: 10.1073/pnas.0801279105. [DOI] [PMC free article] [PubMed] [Google Scholar]
- 21.Aghi M, Gaviani P, Henson JW, et al. Magnetic resonance imaging characteristics predict epidermal growth factor receptor amplification status in glioblastoma. Clin Cancer Res. 2005;11:8600–5. doi: 10.1158/1078-0432.CCR-05-0713. [DOI] [PubMed] [Google Scholar]
- 22.Young RJ, Gupta A, Shah AD, et al. Potential role of preoperative conventional MRI including diffusion measurements in assessing EGFR gene amplification status in glioblastoma patients. AJNR Am J Neuroradiol. 2013 doi: 10.3174/ajnr.A3604. Accepted, in press. [DOI] [PMC free article] [PubMed] [Google Scholar]
- 23.Tykocinski ES, Grant RA, Kapoor GS, et al. Use of magnetic perfusion-weighted imaging to determine epidermal growth factor receptor variant III expression in glioblastoma. Neuro Oncol. 2012;14:613–23. doi: 10.1093/neuonc/nos073. [DOI] [PMC free article] [PubMed] [Google Scholar]
- 24.Goldman CK, Kim J, Wong WL, et al. Epidermal growth factor stimulates vascular endothelial growth factor production by human malignant glioma cells: A model of glioblastoma multiforme pathophysiology. Mol Biol Cell. 1993;4:121–33. doi: 10.1091/mbc.4.1.121. [DOI] [PMC free article] [PubMed] [Google Scholar]
- 25.Cha S, Knopp EA, Johnson G, et al. Intracranial mass lesions: dynamic contrast-enhanced susceptibility-weighted echo-planar perfusion MR imaging. Radiology. 2002;223:11–29. doi: 10.1148/radiol.2231010594. [DOI] [PubMed] [Google Scholar]
- 26.Patil V, Johnson G. An improved model for describing the contrast bolus in perfusion MRI. Med Phys. 2011;38:6380–3. doi: 10.1118/1.3658570. [DOI] [PMC free article] [PubMed] [Google Scholar]
- 27.Kong DS, Kim ST, Kim EH, et al. Diagnostic dilemma of pseudoprogression in the treatment of newly diagnosed glioblastomas: the role of assessing relative cerebral blood flow volume and oxygen-6-methylguanine-DNA methyltransferase promoter methylation status. AJNR Am J Neuroradiol. 2011;32:382–7. doi: 10.3174/ajnr.A2286. [DOI] [PMC free article] [PubMed] [Google Scholar]
- 28.Mangla R, Kolar B, Zhu T, et al. Percentage signal recovery derived from MR dynamic susceptibility contrast imaging is useful to differentiate common enhancing malignant lesions of the brain. AJNR Am J Neuroradiol. 2011;32:1004–10. doi: 10.3174/ajnr.A2441. [DOI] [PMC free article] [PubMed] [Google Scholar]
- 29.Barajas RF, Chang JS, Sneed PK, et al. Distinguishing recurrent intra-axial metastatic tumor from radiation necrosis following gamma knife radiosurgery using dynamic susceptibility-weighted contrast-enhanced perfusion MR imaging. AJNR Am J Neuroradiol. 2009;30:367–72. doi: 10.3174/ajnr.A1362. [DOI] [PMC free article] [PubMed] [Google Scholar]
- 30.Hatanpaa KJ, Burma S, Zhao D, et al. Epidermal growth factor receptor in glioma: signal transduction, neuropathology, imaging, and radioresistance. Neoplasia. 2010;12:675–84. doi: 10.1593/neo.10688. [DOI] [PMC free article] [PubMed] [Google Scholar]
- 31.Cha S, Johnson G, Wadghiri YZ, et al. Dynamic, contrast-enhanced perfusion MRI in mouse gliomas: correlation with histopathology. Magn Reson Med. 2003;49:848–55. doi: 10.1002/mrm.10446. [DOI] [PubMed] [Google Scholar]
- 32.Price SJ, Green HA, Dean AF, et al. Correlation of MR relative cerebral blood volume measurements with cellular density and proliferation in high-grade gliomas: an image-guided biopsy study. AJNR Am J Neuroradiol. 2011;32:501–6. doi: 10.3174/ajnr.A2312. [DOI] [PMC free article] [PubMed] [Google Scholar]
- 33.Cha S, Lu S, Johnson G, et al. Dynamic susceptibility contrast MR imaging: correlation of signal intensity changes with cerebral blood volume measurements. J Magn Reson Imaging. 2000;11:114–9. doi: 10.1002/(sici)1522-2586(200002)11:2<114::aid-jmri6>3.0.co;2-s. [DOI] [PubMed] [Google Scholar]
- 34.Hobbs J, Nikiforova MN, Fardo DW, et al. Paradoxical relationship between the degree of EGFR amplification and outcome in glioblastomas. Am J Surg Pathol. 2012;36:1186–93. doi: 10.1097/PAS.0b013e3182518e12. [DOI] [PMC free article] [PubMed] [Google Scholar]
- 35.Del Vecchio CA, Li G, Wong AJ. Targeting EGF receptor variant III: tumor-specific peptide vaccination for malignant gliomas. Expert Rev Vaccines. 2012;11:133–44. doi: 10.1586/erv.11.177. [DOI] [PubMed] [Google Scholar]
- 36.Finocchiaro G, Pellegatta S. Immunotherapy for glioma: getting closer to the clinical arena? Curr Opin Neurol. 2011;24:641–7. doi: 10.1097/WCO.0b013e32834cbb17. [DOI] [PubMed] [Google Scholar]
- 37.Verhaak RG, Hoadley KA, Purdom E, et al. Integrated genomic analysis identifies clinically relevant subtypes of glioblastoma characterized by abnormalities in PDGFRA, IDH1, EGFR, and NF1. Cancer Cell. 2010;17:98–110. doi: 10.1016/j.ccr.2009.12.020. [DOI] [PMC free article] [PubMed] [Google Scholar]
- 38.Toh CH, Wei KC, Chang CN, et al. Differentiation of primary central nervous system lymphomas and glioblastomas: comparisons of diagnostic performance of dynamic susceptibility contrast-enhanced perfusion MR imaging without and with contrast-leakage correction. AJNR Am J Neuroradiol. 2013 Jun-Jul;34(6):1145–9. doi: 10.3174/ajnr.A3383. Epub 2013 Jan 24. [DOI] [PMC free article] [PubMed] [Google Scholar]