

Abstract
Imaging studies have reported conflicting findings on how brain structure differs with age and sex. This may be explained by discrepancies and limitations in study population and study design. We report a study on brain tissue volumes in one of the largest cohorts of individuals studied to date of subjects with high mean age (mean±standard deviation (SD) 76±6 years). These analyses are based on magnetic resonance imaging (MRI) scans acquired at baseline on 4303 non-demented elderly, and 367 who had a second MRI, on average 2.5±0.2 years later. Tissue segmentation was performed with an automatic image analysis pipeline. Total brain parenchymal (TBP) volume decreased with increasing age while there was an increase in white matter hyperintensities (WMH) in both sexes. A reduction in both normal white matter (NWM) - and grey matter (GM) volume contributed to the brain shrinkage. After adjusting for intra-cranial volume, women had larger brain volumes compared to men (3.32%, p<0.001) for TBP volume in the cross-sectional analysis. The longitudinal analysis showed a significant age-sex interaction in TBP volume with a greater rate of annual change in men (−0.70%, 95%CI: −0.78% to −0.63%) than women (−0.55%, 95%CI: −0.61% to −0.49%). The annual change in the cross-sectional data was approximately 40% less than the annual change in the longitudinal data and did not show significant age-sex interaction. The findings indicate that the cross-sectional data underestimate the rate of change in tissue volumes with age as the longitudinal data show greater rate of change in tissue volumes with age for all tissues.
Keywords: Brain volume, White matter hyperintensities, Atrophy, Magnetic resonance imaging, Population based, AGES-Reykjavik study
1. Introduction
It is well known that the human brain atrophies with age. Generally, this atrophy reflects a decrease in grey- and white matter tissue combined with an increase in white-matter hyperintensities (WMH) and cerebrospinal fluid (CSF) (Pfefferbaum et al., 1994; Courchesne et al., 2000; Good et al., 2001; Jernigan et al., 2001; Resnick et al., 2003; Taki et al., 2004; DeCarli et al., 2005; Enzinger et al., 2005; Fotenos et al., 2005; Walhovd et al., 2005; Ikram et al., 2008). However, reports vary on the trajectory of these tissue changes with age. In studies based on older populations the volume of WM has been shown to decrease (Jernigan et al., 2001; Resnick et al., 2003; Walhovd et al., 2005; Greenberg et al., 2008; Ikram et al., 2008), or not change significantly with age (Good et al., 2001; Taki et al., 2004). A reduction in GM volume with age has been shown in most (Good et al., 2001; Jernigan et al., 2001; Resnick et al., 2003; Taki et al., 2004; Walhovd et al., 2005; Godin et al., 2009) but not all studies (Greenberg et al., 2008; Ikram et al., 2008). Studies that include broader age ranges have reported WM volume to increase through adulthood, peaking in volume in the age range of 40-60 years, followed by a rapid decline at the age around 60. In contrast, GM volume was shown to decline throughout adulthood and old age at more or less linear rate (Allen et al., 2005; Walhovd et al., 2005). Grey-white matter ratios have been found to vary widely in the literature, from approximately 1 to 3 dependent on age, generally declining non-linearly from age 20-50, then increasing linearly in elderly subjects (Harris, 1994; Guttmann CR and al., 1998; Resnick et al., 2000; Good et al., 2001). As the trajectory of these tissues depends on the age-ranges examined, methods assuming linearity or even mono-tonicity of the age-functions should be interpreted with caution (Jernigan and Gamst, 2005).
Inconsistent results have also been reported in studies of sex related differences and age-sex interactions in brain volumes. Generally the whole brain, and in some instances both GM- and WM volumes, have been reported to be larger in men than women (Courchesne et al., 2000; Good et al., 2001; Greenberg et al., 2008) without correction for head size. Some but not all studies with head size correction suggest that GM- or WM volumes or both tissue types are smaller or not significantly different in men as compared to women (Ge et al., 2002; Brickman et al., 2008; Greenberg et al., 2008; Ikram et al., 2008; Barnes et al., 2010). These discrepancies are expected since men have generally larger heads than women as they are larger in stature, making head size correction a logical approach in brain volume research (Greenberg et al., 2008). Significant age-sex interactions have been reported showing that the brain shrinks more rapidly with age in men than women (Xu et al., 2000; Good et al., 2001). Other studies including recent studies on relatively large samples did not observe any age-sex interactions at all (Resnick et al., 2003; Greenberg et al., 2008; Ikram et al., 2008).
These conflicting results in the literature reflect differences in the range of participant age, health based inclusion/exclusion criteria, cross-sectional or longitudinal study design, lack of correction for intra-cranial volume, different image quality including varying levels of signal-to-noise ratio (SNR) and contrast-to-noise ratio (CNR), different post processing methods, as well as variations in the degree of manual intervention in computerized post-processing algorithms and in particular, sample sizes. Many of the studies referred to above are based on sample sizes of less than 250 subjects with a broad age range of 15-99 years and include only a small number of older individuals (Allen et al., 2005; Enzinger et al., 2005; Walhovd et al., 2005; Greenberg et al., 2008). The selection of participants with respect to health status also varies across studies, from only selecting very healthy individuals, without any neurological, psychiatric, or other medical condition (Good et al., 2001) to limiting exclusions to individuals with dementia (Ikram et al., 2008; Godin et al., 2009). Furthermore, there are inconsistent findings regarding cross-sectional and longitudinal brain volume changes where some studies have shown good agreement between cross-sectional and longitudinal estimates (Resnick et al., 2003; Fotenos et al., 2005), where as other (Raz et al., 2003; Raz et al., 2005) have shown greater longitudinal change than predicted from cross-sectional estimates. Secular changes and subsequent cohort affects confound results of age effects based on cross-sectional studies, possibly leading to a mismatch between cross-sectional and longitudinal estimates (Fotenos et al., 2005). Several other longitudinal studies on brain volumes have been reported (Resnick et al., 2000; Tang et al., 2001; Scahill et al., 2003; Enzinger et al., 2005; Fjell et al., 2009; Sluimer et al., 2010). In general, these studies are based on more selected samples that are not population based.
Advances in post-processing procedures make it possible to analyze a large sample with an automated classification pipeline. These methods require little manual intervention so unreliability due to manual intervention is reduced (Zijdenbos et al., 2002; Taki et al., 2004). Further, it is also possible to estimate different brain tissue types including WMH (Walhovd et al., 2005; Ikram et al., 2008), which is an important component of brain pathology in aging brains; some studies have not accounted for WMH (Resnick et al., 2003; Fotenos et al., 2005).
Here, we report brain tissue volumes in the largest population-based cohort to date consisting of men and women who participated in the Age Gene/Environment Susceptibility – Reykjavik Study (AGES-Reykjavik Study). We present cross-sectional data of 4303 non-demented subjects as well as longitudinal data based on a 9% sub-sample. Tissue segmentation was performed using a validated automatic image analysis pipeline based on a multi-spectral tissue classification described in sections 2.3-2.5. We hypothesize that GM- and WM atrophy as well as grey-white matter ratio and WMH volume in this elderly cohort increases linearly with age, more in men compared with women. Furthermore, we hypothesize that longitudinal changes in brain volumes with age are different from that predicted from cross-sectional estimates.
2.0 Material and methods
2.1 Study population
The AGES-Reykjavik Study is a continuation of the Reykjavik Study. The Reykjavik Study was initiated in 1967 by the Icelandic Heart Association and included men and women born in 1907–1935 and living in the Reykjavik area. From September 2002 to February 2006, new data were collected for the AGES-Reykjavik Study, aimed to investigate the genetic and environmental factors contributing to clinical and subclinical disease at older age. The study design and initial assessments of the cohort have been described previously (Harris et al., 2007; Saczynski et al., 2009). As part of the assessments at the research center, a questionnaire was administered, a clinical examination was performed, and images were acquired of the brain, musculoskeletal system, body composition, vasculature and heart. From June 2006 to March 2007 a sub-sample of the cohort was re-imaged. The AGES-Reykjavik Study has been approved by the Icelandic National Bioethics Committee, which acts as the Institutional Review Board for the Icelandic Heart Association, and by the Institutional Review Board for the Intramural Research Program of the National Institute on Aging, National Institutes of Health, USA. Informed consent was obtained from all participants. All MR images were screened by a neuroradiologist for evidence of brain pathology that warranted medical follow-up.
2.2 MR image acquisition
MR images were acquired on a single research-dedicated 1.5T Signa Twinspeed EXCITE system (General Electric Medical Systems, Waukesha, WI) using a multi-channel phased array head cap coil. The structural image protocol included a T1-weighted three dimensional spoiled gradient echo (3D-SPGR) sequence (TE (time to echo), 8 ms; TR (time repetition), 21 ms; FA (flip angle), 30°; FOV (field of view), 240 mm; matrix, 256 × 256). Each volume consisted of 110 slices with 1.5 mm slice thickness and in-plane pixel size of 0.94 mm × 0.94 mm. A proton density (PD)/T2 - weighted fast spin echo (FSE) sequence (TE1, 22 ms; TE2, 90 ms; TR, 3220 ms; echo train length, 8; FA, 90°; FOV, 220 mm; matrix, 256 × 256), and a fluid attenuated inversion recovery (FLAIR) sequence (TE, 100 ms; TR, 8000 ms, inversion time, 2000 ms, FA, 90°; FOV, 220 mm; matrix, 256 × 256). These latter two sequences were acquired with 3-mm thick slices and in-plane pixel size of 0.86 mm × 0.86 mm. All images were acquired to give full brain coverage and were localized at the AC/PC commissure line.
2.3 Image processing pipeline
Following MRI acquisition, all images were transferred to a dedicated 52-CPU Linux processing cluster and processed using an image analysis pipeline derived from the Montreal Neurological Institute (MNI) pipeline described in detail by Zijdenbos et al (Zijdenbos et al., 2002). The pipeline, referred to here as the AGES-RS/MNI pipeline, is divided into 45 processing modules. The algorithm segments the whole brain (cerebrum and cerebellum) into GM, normal WM (referred to as NWM), WMH and CSF. The pipeline is multispectral i.e. it uses the contrast properties from all the different pulse sequences in the tissue segmentation process. Defects in the brain parenchyma are identified with a signal intensity isointense to that of CSF on all MR images. They are classified as CSF and areas with increased signal on PD, T2 and FLAIR images associated with parenchymal defects as WMH. The key processing stages of the pipeline are described below:
2.3.1 Pre-processing of MRI data
The pre-processing steps were as follows: Signal non-uniformity correction using the N3 algorithm (Sled et al., 1997) which was applied in 10 iterative steps to achieve maximum uniformity. Stereotaxic registration was achieved by an affine transformation (9 degrees of freedom) of the T1-weighted 3D SPGR images to the ICBM152 template (J. Mazziotta, 2001). Rigid inter-sequence registration (6 degrees of freedom) was performed by registering images from the individual (T2/PD, FLAIR) sequences to the T1-weighted images. Images from all sequences were then resampled into ICMB152 space where linear signal intensity normalization was then applied to correct for signal intensity variations across images in the different sequences.
2.3.2 Tissue classification
Tissue classification was achieved with an artificial neural network classifier in the four dimensional intensity space defined by the four sequences (FLAIR, T1-, PD- and T2- weighted). The classifier was trained by the input of manually labeled image data from the four sequences on brain images of 11 randomly selected subjects. The intensity normalized images from the pre-processing were used as input to the classifier. The output classified each voxel as belonging to CSF, GM, NWM and WMH.
2.3.3 Skull removal and intra-cranial estimation
Removal of the skull was done after the tissue classification. The skull was removed by applying the BET (brain extraction tool) (Smith, 2002) algorithm on the T1-, PD- and T2-weighted images and the classified image separately and subsequently combining the resulting mask into one single brain mask for the subject. This approach preserved arachnoidal space and CSF adjacent to the skull otherwise removed when applying BET on the different sequences individually.
2.4 Quality control of tissue classification
Quality control was based on visual inspection of a verification image for each subject including 14 a priori selected slice locations from each of the pulse sequences (T1, PD, T2, FLAIR), evenly distributed across the entire brain in the axial, coronal and sagittal planes. The brain image was compared to the corresponding tissue classification mask to demonstrate the quality of the stereotaxic registration of the T1 images to the ICBM152 template (supplemental figure 1). The quality of the tissue classification was scored as: Accept, indicating successful classification and therefore no further processing needed; accept following manual editing; and failure, indicating unsuccessful tissue classification that could not be rescued by repeated processing or manual editing of tissue classification. Those cases successfully manually edited with a custom tool developed in-house were regarded as valid for volume analysis and included in the analytic sample. This editing was needed for less than 1% of scans (n=43), most of which had slight motion artifacts resulting in misclassification of voxels in the fossa-posterior. Cases considered as failures were rejected from further analysis (n=53); these failures were most commonly due to severe motion artifacts.
2.5 Validation of tissue volumes
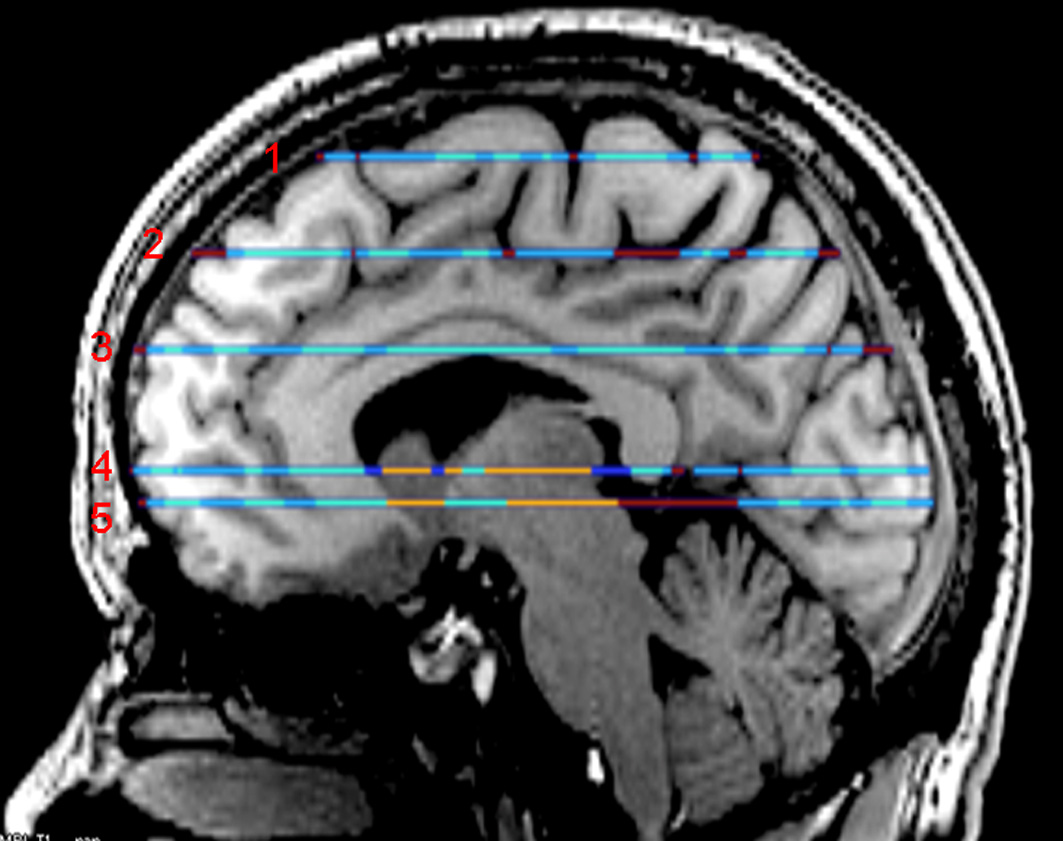
To assess the automatic tissue classification we randomly selected 20 cases and we compared manual labeling of the four tissue types to the results generated with the automatic pipeline. One trained rater manually drew regions of interests using a custom made tool in 5 predefined slice locations that gave good coverage of the brain. The first labeled location (most superior) was 9 mm inferior to the first axial slice that shows frontal-parietal lobe cortex at the level of central sulcus. The second labeled slice was located exactly in the middle of the first and third slice. The third labeled slice was located at the level of mid-body of corpus callosum at the level of first axial slice where both lateral ventricles are visible. The fourth labeled slice was located at the junction of thalamus and sub thalamus regions in order to give a view of the deep grey nucleuses. The fifth labeled slice was at the level of the most inferior part of the genu of corpus callosum (supplemental figure 2). The rater could view the images from all the different sequences when manually labeling. As a rule, tissues of GM, NWM and CSF were labeled on the T1-weighted images and WMH on FLAIR and T2 images in the axial plane while the rater had the choice to simultaneously view resulting tissue segmentation on images from all the other pulse sequences in any desired image plane. Voxel-level spatial agreement for each tissue type compared the manual and automated segmentation using Dice similarity index statistics (SI) (Zijdenbos et al., 1994). The SI for the GM, NWM, WMH and CSF respectively was: 0.82, 0.82, 0.62 and 0.83, a slightly lower agreement compared to (Ikram et al., 2008) that reported SI values of 0.92, 0.93, 0.63 and 0.91 for the same tissue classes respectively. Using the same methods, intra-rater variability of the manual labeling was assessed based on one repeated labeling of one subject with the following results (GM, NWM, WMH and CSF respectively): 0.90, 0.90, 0.72 and 0.99.
The reproducibility of the entire process generating the tissue volumes, including the image acquisition and the automatic pipeline, was assessed based on repeated scans of subjects (n=32) in the study cohort. Each subject was scanned four times in two visits (twice in each visit) with an average of 2 weeks time between visits. Based on all four scans, intra-class correlation (r) and coefficient of variation (CoV) was estimated for the mean volume of each tissue type separately, TBP volume and ICV using a repeated measures model with a compound symmetry covariance structure. The volume of TBP was defined as the sum of GM, NWM and WMH and the ICV was defined as the sum of TBP and CSF. The results were as following: ICV, percent CoV = 1.2% and r = 0.99; TBP, CoV = 0.7% and r = 0.99; GM, CoV = 1.1% and r = 0.98; NWM, CoV = 1.8% and r = 0.99; CSF, CoV = 4.0% and r = 0.98 and WMH, CoV = 4.3% and r = 0.99.
2.6 Diagnosis of dementia
Individuals with dementia were identified in a 3-step procedure described previously (Saczynski et al., 2009). Briefly the Mini-Mental State Examination (MMSE) and the Digit Symbol Substitution Test (DSST) were administered to all participants. Individuals who screened-positive based on one of these tests [<24 on the MMSE or <18 on the DSST] were administered a second, more diagnostic test battery, and a subset of them, who were screened positive on the Trails or Rey Auditory Verbal Learning test were selected for a neurological examination. Proxies for this latter group were interviewed about medical history and social, cognitive, and daily functioning relevant to the diagnosis. A consensus diagnosis for dementia was made by a panel that includes a geriatrician, neurologist, neuropsychologist, and neuroradiologist. The diagnoses were made according to international guidelines (DSM IV - The American Psychological Association, 2000) and a full range of dementing illnesses (WHO, 1992) diagnoses were considered; the most common forms being Alzheimer's disease and vascular dementia.
2.7 Analytic sample
Of the 5764 participants in the AGES-Reykjavik study, 4811 underwent MRI scanning. The reasons for 953 missing MRI scans were: standard MRI contraindications (n=290), claustrophobia or refusal of scanning (n=227), scheduling of machine maintenance (n=54), and disability or refusals preventing a visit to the MRI facility (n=382). Of the 4811 scans, 4726 participants completed the MRI examination; 59 were excluded from this group due to severe acquisition artifacts that interfered with the post-processing. Following the quality control protocol, an additional 53 participants were excluded due to failures in post-processing. This resulted in 4614 individuals with available brain volumes. Of those 4614, there were 202 (4.4%) with dementia and additional 3 (0.1%) with brain tumors with significant mass effect that were excluded from the sample. In total, 106 individuals did not have the dementia assessment and were also excluded. This resulted in a total of 4303 subjects (1786 men (42%) and 2517 women) (mean age 76±5 years) with complete brain volumes for analysis.
Of the 5764 study participants, 5070 had complete basic characteristics available and were non-demented. Compared to the 4303 non-demented subjects with brain volumes, the 767 subjects with complete basic characteristics and no data on brain volumes were more often men (54% vs. 46%), were significantly older (77.6 vs. 76.1), had more often diabetes (18.4% vs. 11.0%), were more often smokers (13.7% vs. 12.0%), had higher hypertension prevalence (84.9 vs. 80.2) and higher BMI (27.6 vs. 27.0). There was no statistically significant difference between the groups in body height, (data not shown).
2.8 MRI of longitudinal subset
Of the 4303 individuals in the cross-sectional sample with successfully processed MRI, a random sample of 567 (free of dementia, brain tumors and without MR contraindications) were invited for a follow-up MRI examination. Of those, 407 (72%) agreed to participate. From this group, individuals with images of poor quality or images that could not be processed (n=38) and individuals with incident large hemispherical infarcts, spanning ≥3 cortical lobes (n=2), were excluded. The final sample with successfully processed images at both time points consisted of 367 individuals (151 men (41%) and 216 women, baseline mean age 75±5 years). The follow-up time was on average 2.5±0.2 years (range 2.1-3.5 years). We compared the linear cross-sectional differences per year of age, using the baseline tissue volumes, between the two groups; the subjects in the longitudinal subset (n=367) and the subjects not participating in the follow-up (n=3936). We also compared the basic characteristics of subjects in the two groups.
2.9 Statistical Analysis
Intra-cranial volume was calculated by adding the volumes of GM, NWM, WMH and CSF. All tissue volumes are presented as percent of the total ICV, or as the absolute volume (milliliters (ml)) to facilitate comparison with other studies. Total WM (TWM) volume was defined as the sum of NWM and WMH. Volumes of WMH were natural log transformed to normalize the distribution of values. All tissue volumes and volume ratios were modeled cross-sectionally as a function of age using local polynomial regression fitting (loess) as well as up to third degree polynomial regression models. The regression analyses were performed by sex and with sex adjustment. A test of interaction between sex and the age association was performed by testing if the regression curves for men and women were parallel. Scatter plots of all tissues versus age by sex were generated including a superimposed loess curve and a fitted straight line from linear regression. All tissue volumes and ratios were analyzed on the natural log scale when estimating the average percent difference in tissue volume for one year of age. If a curvature in the age dependency was found statistically significant the difference in tissue volume was also estimated at age 67 and 85 to demonstrate the age effect.
The scans from the two time points for the longitudinal analysis were processed individually. A repeated measures model was used for the analysis with a random effect for the subject to account for within-subject correlation. Adjustment was made for the age at entry and the time between the two visits. The longitudinal change in tissue volumes was estimated as the annual change relative to baseline.
The GM-to-NWM ratio (GM/NWM) was derived from both the cross-sectional and longitudinal volumes. The association of GM/NWM ratio to age, sex and the interaction between age and sex was assessed. Results were presented with 95% confidence intervals (CI). All analyses were performed with SAS v.9.2 (SAS Institute, Cary, NC).
3.0 Results
Table 1 provides a description of the AGES-Reykjavik study cohort members included in the cross-sectional analyses.
TABLE 1.
Characteristics of the study population (n=4303) by sex: The AGES-Reykjavik Study
| Demographics | Overall, n=4303 | Men, n=1786 | Women, n=2517 |
|---|---|---|---|
| Age, mean±SD | 76.1±5.4 | 76.2±5.3 | 76.0±5.4 |
| Range | 66-96 | 67-94 | 66-96 |
| ICV (ml), mean±SD | 1501.6±148.2 | 1616.1±123.0 | 1420.4±104.5 |
| BMI | 27.0±4.3 | 26.8±3.7 | 27.2±4.7 |
| Height (cm), mean±SD | 167.1.±9.3 | 175.6±6.2 | 161.1±5.7 |
| Systolic BP (mmHg), mean±SD | 142.3±20.2 | 143.3±19.8 | 141.5±20.4 |
| Hypertension (%) | 80.2 | 80.2 | 80.1 |
| Diabetes (%) | 11.0 | 14.0 | 8.8 |
| Current smoking (%) | 12.0 | 11.5 | 12.3 |
SD= Standard deviation, ICV=Intra Cranial Volume, ml=milliliters, BMI=Body Mass Index, cm=centimeters, BP= Blood pressure, mmHg=millimeter of Mercury.
3.1 Cross-sectional associations of brain volumes by age and sex
The sex-stratified mean±SD for the volumes of each tissue type or tissue ratio are presented in Table 2 together with correlations between age and tissue volumes. For both sexes, significant correlations between age and volumes were observed for all tissue types (p<0.0001), both ICV adjusted and not adjusted for ICV. With increasing age, volumes of TBP, GM, NWM and TWM were lower, and CSF and WMH were higher.
TABLE 2.
Relationship between age and brain volumes in a cross-sectional sample of men (n=1786) and women (n=2517)
| Volumes not adjusted to ICV* | Volumes adjusted to ICV* | |||||||
|---|---|---|---|---|---|---|---|---|
| Men | Women | Men | Women | |||||
| Tissue | Volume mean (ml)±SD | r | Volume mean (ml)±SD | r | Volume mean (%)±SD | r | Volume mean (%)±SD | r |
| TBP | 1142.79±94.20 | −0.32 | 1039.18±83.73 | −0.31 | 70.78±3.73 | −0.41 | 73.21±3.65 | −0.44 |
| GM | 708.08±60.92 | −0.38 | 654.10±53.61 | −0.35 | 43.89±3.10 | −0.39 | 46.12±3.06 | −0.38 |
| NWM | 413.17±45.27 | −0.28 | 366.44±39.07 | −0.30 | 25.56±1.93 | −0.34 | 25.79±1.80 | −0.41 |
| TWM | 434.71±45.53 | −0.16 | 385.08±40.01 | −0.18 | 26.89±1.77 | −0.18 | 27.09±1.68 | −0.25 |
| CSF | 473.28±78.58 | 0.29 | 381.22±63.84 | 0.33 | 29.22±3.73 | 0.41 | 26.79±3.65 | 0.44 |
| WMH | 21.53±20.86 | 0.29 | 18.64±19.30 | 0.29 | 1.33±1.28 | 0.30 | 1.31±1.33 | 0.29 |
ICV=Intra-cranial volume; TBP=Total brain parenchyma; GM=Grey matter; NWM; Normal white matter; WMH=White matter hyperintensities; TWM=Total white matter; CSF=Cerebral-spinal fluid; SD=Standard deviation; r = Spearman correlation coefficient; ml=milliliters. Volumes not adjusted to ICV are presented as absolute and volumes adjusted to ICV are presented as percent of the total ICV.
Significant correlations between age and volumes were observed for all tissue types (p<0.0001), both in volumes unadjusted to ICV and adjusted to ICV for both sexes. The volume of TBP was defined as the sum of GM, NWM and WMH and the ICV was defined as the sum of TBP and CSF. Total WM (TWM) volume was defined as the sum of NWM and WMH.
Compared to women, men had significantly larger absolute volumes of all tissue types (p<0.0001). However when adjusted for ICV, women had relatively larger volumes for TBP (3.32%), GM (4.88%), NWM (0.90%) and TWM (0.74%) compared to men (p<0.0001), while men had significantly larger CSF volumes (8.32%, p<0.0001) and moderately more WMH (1.50%, p=0.03).
Scatter-plots showing ICV adjusted tissue volumes with age and by sex are presented in figure 1. Smooth loess curves and linear regression lines have been superimposed on the plots. In general the plots show that the association with age was linear over the age range for all tissue types. There was a significant quadratic term for GM and TWM in men and for NWM in both men and women. Higher level polynomials did not improve the model fit. A second degree (quadratic) effect of age implies that for GM and TWM in men and NWM in men and women the association with age was age dependent. For GM in men the decline was slower for the younger age and steeper for the higher age. For TWM in men and NWM in men and women the decrements were steeper in the younger age and less in the older persons. The linear effect (slope of the regression line) represents the association with age for the middle of the age range 76 ± 5 years. Tests for difference in shapes of the regression curves between men and women were not statistically significant but came closest for GM with p=0.06 where the curvature appeared greater for men.
Figure 1.

Scatterplots of tissue volumes expressed as percentage of intra-cranial volume by age in men and women including a superimposed loess curve (blue) and a fitted straight line from linear regression (red). A) Total brain parenchyma (TBP); B) Grey matter (GM); C) Normal white matter (NWM); D) White matter hyperintensities (WMH) (natural log transformed); E) Total white matter (TWM); F) Cerebral-spinal-fluid (CSF).
The linear cross-sectional estimates of tissue differences per year increase in age for the total sample and after adjusting for ICV and sex were the following: TBP: −0.41%, (CI: −0.43% to −0.38%); GM: −0.50%, (CI: −0.53% to −0.46%); NWM: −0.52%, (CI: −0.55% to −0.48%); TWM: −0.26%, (CI: −0.30% to −0.23%), CSF: 1.07%, (CI: 1.00% to 1.14%) and WMH: 5.00%, (CI: 4.51% to 5.50%). The estimated linear changes for men, women and sex adjusted are shown separately in table 3. Because of the curvature in the association in GM and TWM for men and NWM for men and women we also show the age effect for one year change in age (slope of the quadratic curve) at age 67 and at age 85 representing the lower age range and the upper age range. In men, for GM at age 67 the decrement in volume was - 0.32% (CI: −0.47% to −0.18%) and at age 85 it was −0.76% (CI: −0.92% to −0.60%). For TWM at age 67 the decrement per year of age was −0.42% (CI: −0.56% to −0.28%) and at age 85 it was −0.01% (CI: −0.16% to 0.15%). For NWM in men at age 67 the decrement was −0.72% (CI: −0.88% to −0.57%) and at age 85 it was −0.23% (CI: −0.40% to −0.05%). For women, NWM at age 67 the decrement was −0.60% (CI: −0.70% to −0.49%) and at age 85 it was −0.45% (CI: −0.58% to −0.32%).
TABLE 3.
Cross-sectional estimated percentage difference in brain tissue volumes per year increase of age
| Men (N=1786) | Women (N=2517) | Sex adjusted (N=4303) | |
|---|---|---|---|
| TBP | −0.41 (−0.45; −0.37) | −0.40 (−0.43; −0.37) | −0.41 (−0.43; −0.38) |
| GM | −0.53 (−0.59; −0.47) | −0.47 (−0.52; −0.43) | −0.50 (−0.53; −0.46) |
| NWM | −0.49 (−0.56; −0.43) | −0.54 (−0.58; −0.49) | −0.52 (−0.55; −0.48) |
| TWM | −0.23 (−0.29; −0.17) | −0.28 (−0.33; −0.24) | −0.26 (−0.30; −0.23) |
| CSF | 1.00 (0.90; 1.11) | 1.11 (1.03; 1.21) | 1.07 (1.00; 1.14) |
| WMH | 4.95 (4.20; 5.70) | 5.04 (4.39; 5.70) | 5.00 (4.51; 5.50) |
Values are linear cross-sectional estimated mean percentage differences in brain tissue volumes (95% confidence interval) per year increase of age after adjusting for intra-cranial volume. The data is presented for men, women and after adjusting for sex separately. N= Sample size, TBP=Total brain parenchyma; GM=Grey matter; NWM; Normal white matter; TWM=Total white matter; CSF=Cerebral-spinal fluid; WMH=White matter hyperintensities. The volume of TBP was defined as the sum of GM, NWM and WMH and the ICV was defined as the sum of TBP and CSF. Total WM (TWM) volume was defined as the sum of NWM and WMH.
The GM/NWM volume ratio was 1.72±0.16 for men and 1.80±0.15 for women. The association with age was linear for women (p=0.03) but quadratic for men with steeper increase at the lower ages and decrease at the higher ages. The linear association for men was 0.03% (CI: −0.06% to 0.11%) and for women 0.07% (CI: 0.01% to 0.13%). For the GM/NWM ratio in men at age 67 the rate of change was 0.40% (CI: 0.21% to 0.60%) and at age 85 it was −0.54% (CI: −0.76% to −0.32%). There was a significant age-sex interaction based on the quadratic analysis showing more decrease in GM/NWM ratio in the upper range of age in men compared with women (p=0.003).
3.2 Longitudinal effects of age and sex
Between the baseline and 2.5 year follow-up assessments, both men and women lost ICV adjusted TBP-, GM-, NWM- TWM, and experienced an increase in WMH and CSF (p<0.0001). The annual rate of change in tissue volumes for men, women and sex adjusted are presented in table 4. There was a significant age-sex interaction in volume change for TBP (p=0.002), NWM (p=0.04), TWM (p=0.02) and WMH (p=0.008) but not for GM (p=0.23) or CSF (p=0.25). There was a greater decline in men in TBP: (−0.70%, CI: −0.78% to −0.63%); in NWM: (−0.86%, CI: −1.13% to −0.69); in TWM: (−0.54%, CI: −0.70% to −0.37%) and in GM: (−0.81%, CI: −0.97% to −0.65%) compared to women (TBP: −0.56%, CI: −0.61% to −0.49%; NWM: −0.67%, CI: −0.77% to −0.58; TWM: −0.34%, CI: −0.43% to −0.22%; GM: −0.69%, CI: −0.80% to −0.59%. There was however a greater change in WMH volume with age in women (7.35%, CI: 6.50% to 8.21%) compared to men (5.39%, CI: 4.17% to 6.62%). The mean GM/NWM volume ratio at baseline was 1.73±0.15 for men and 1.82±0.15 for women and there was no statistically significant change with increasing age in men (p=0.76) or women (p=0.78). There was a significant (p<0.001) increase in ICV corresponding to an annual rate of 0.12% (CI: 0.10% to 0.14%) in men and 0.09% (CI: 0.07% to 0.11%) in women. This change increased significantly with follow-up time (p<0.001).
TABLE 4.
Longitudinal percentage rate of change in brain tissue volumes per year increase of age
| Men (N=151) | Women (N=216) | Sex adjusted (N=367) | |
|---|---|---|---|
| TBP | −0.70 (−0.78; −0.63) | −0.56 (−0.61; −0.49) | −0.62 (−0.66; −0.57) |
| GM | −0.81 (−0.97; −0.65) | −0.69 (−0.80; −0.59) | −0.74 (−0.83; −0.65) |
| NWM | −0.86 (−1.13; −0.69) | −0.67 (−0.77; −0.58) | −0.75 (−0.84; −0.66) |
| TWM | −0.54 (−0.70; −0.37) | −0.34 (−0.43; −0.22) | −0.42 (−0.51; −0.34) |
| CSF | 1.69 (1.52; 1.86) | 1.55 (1.38; 1.71) | 1.61 (1.49; 1.73) |
| WMH | 5.39 (4.17; 6.62) | 7.35 (6.50; 8.21) | 6.54 (5.82; 7.26) |
Values are longitudinal mean percentage rates of change in brain tissue volumes (95% confidence interval) per year increase of age after adjusting for intra-cranial volume. The data is presented for men, women and after adjusting for sex separately. N= Sample size, TBP=Total brain parenchyma; GM=Grey matter; NWM; Normal white matter; TWM=Total white matter; CSF=Cerebral-spinal fluid; WMH=White matter hyperintensities. The volume of TBP was defined as the sum of GM, NWM and WMH and the ICV was defined as the sum of TBP and CSF. Total WM (TWM) volume was defined as the sum of NWM and WMH.
The linear cross-sectional difference per year of age in tissue volumes was slightly smaller for the baseline volumes of the longitudinal subset (n=367) when compared to the volumes of the subjects not participating in the follow-up (n=3936) except for WMH where it was greater (−0.38% vs. −0.41%, −0.48% vs. −0.49%, −0.50% vs. −0.52%, −0.20% vs −0.27%, 1.01% vs. 1.07% and 5.97% vs. 4.90% for TBP, GM, NWM, TWM, CSF and WMH respectively, after adjusting for sex). The difference between the two groups was not significant for any of the tissue classes. The estimated linear differences for men, women and sex adjusted for both groups are shown separately in supplementary tables 1 and 2. The basic characteristics of subjects in the two groups did not differ significantly except in age (75±5 vs 76±5 years) and smoking (8.7 vs 12.3%) for the longitudinal subset and the subjects not participating in the follow-up respectively (data not shown).
4.0 Discussion
4.1 Cross-sectional data on age and sex distribution and relationship with brain volumes
In this large community-based cohort of elderly men and women, we estimated the linear cross-sectional volume decrease in TBP. The percent differences (table 3) correspond to 4.69 ml (CI: 4.23 to 5.14) in men and 4.16 ml (CI: 3.84 to 4.47) in women per year of age. There was an increase in WMH volume corresponding to 1.07 ml (CI: 0.90 to 1.23) in men and 0.94 ml (CI: 0.81 to 1.06) in women per year of age. We also showed GM atrophy with age corresponding to 3.75 ml (CI: 3.33 to 4.18) in men and 3.07 ml (CI: 2.81 to 3.40) in women per year of age as well as NWM atrophy with age corresponding to 2.02 ml (CI: 1.78 to 2.31) in men and 1.98 ml (CI: 1.80 to 2.12) in women per year of age. Reduction in TWM was 1.00 ml (CI: 0.74 to 1.26) in men and 1.08 ml (CI: 0.92 to 1.27) in women per year of age (this is tabulated in table 5). Furthermore, we found men to have smaller TBP-, GM-, NWM- and TWM volumes than women after adjusting for ICV.
TABLE 5.
Cross-sectional estimated volume (milliliters) difference in brain tissues per year increase of age
| Men (N=1786) | Women (N=2517) | |
|---|---|---|
| TBP | −4.69 (−5.14; −4.23) | −4.16 (−4.47; −3.84) |
| GM | −3.75 (−3.33; −4.18) | −3.07 (−3.40; −2.81) |
| NWM | −2.02 (−2.31; −1.78) | −1.98 (−2.12; −1.80) |
| TWM | −1.00 (−1.26; −0.74) | −1.08 (−1.27; −0.92) |
| WMH | 1.07 (0.90; 1.23) | 0.94 (0.81; 1.06) |
Values are linear cross-sectional estimated mean volume differences in brain tissues (95% confidence interval) per year increase of age after adjusting for intra-cranial volume. The data is presented in milliliters for men women separately. N= Sample size, TBP=Total brain parenchyma; GM=Grey matter; NWM; Normal white matter; TWM=Total white matter; WMH=White matter hyperintensities. The volume of TBP was defined as the sum of GM, NWM and WMH and the ICV was defined as the sum of TBP and CSF. Total WM (TWM) volume was defined as the sum of NWM and WMH.
Our results on GM are consistent with some studies (Good et al., 2001; Jernigan et al., 2001; Resnick et al., 2003; Taki et al., 2004; Walhovd et al., 2005), but not all (Greenberg et al., 2008 and Ikram et al., 2008). In some previous studies, WM volume is shown to decrease with age (Jernigan et al., 2001; Resnick et al., 2003; Walhovd et al., 2005; Greenberg et al., 2008; Ikram et al., 2008) while in other studies no significant change in WM volume was observed (Pfefferbaum et al., 1994; Good et al., 2001; Taki et al., 2004). However, some of the studies (Pfefferbaum et al., 1994; Good et al., 2001; Taki et al., 2004) did not differentiate between NWM and TWM by quantifying WMH separately. Our findings suggest that WMH volume increases with age while both NWM- and TWM volumes decrease with age, consistent with previous studies (Jernigan et al., 2001 and Ikram et al., 2008).
Some studies have reported significant age-sex interactions with more age-related atrophy in men than women (Xu et al., 2000; Good et al., 2001), while other studies found no age-sex interactions (Ge et al., 2002; Resnick et al., 2003; Greenberg et al., 2008; Ikram et al., 2008). In the current study, the age-sex interaction was significant for TBP-, NWM-, WMH- and TWM when examined longitudinally but not for the cross-sectional sample as discussed below. Previous studies of broader age ranges have shown quadratic association of WM volume with age while more or less linear association between GM volume and age (Allen et al., 2005; Walhovd et al., 2005). The current study showed a significant quadratic NWM volume association with age in both men and women with a steeper change in the youngest age (67), slowing down in the higher age (85). There was also a quadratic association in GM volume with age in men showing a steeper change in the higher age. The results show that even in studies of individuals in the highest age range, possible non-linearity in the comparison of brain volumes with age should be carefully examined.
4.2 Longitudinal effects of age and sex
Consistent with the cross-sectional findings, there was a significant sex difference in the longitudinal findings for all tissue volumes. However, unlike the cross-sectional findings there was a significant age-sex interaction in TBP-, NWM- and TWM volume with a greater rate of change in men than women. There was also a significant age-sex interaction in WMH volume with a greater rate of change in women compared to men. The mean annual longitudinal rate of total brain parenchymal loss was −0.62% which is somewhat higher than reported in most previous studies (−0.45% to −0.55%) (Resnick et al., 2003; Enzinger et al., 2005; Fotenos et al., 2005) but comparable to what Sluimer et al (−0.62%) reported (Sluimer et al., 2010) and lower than Thompson et al (−0.88%) (Thompson et al., 2003) and Tang et al (−2.1%) reported (Tang et al., 2001). However, comparison of our population based study to these studies should be done with caution as they include different health based inclusion/exclusion criteria.
The annual rate of longitudinal change in all tissue volumes in the current study was consistently greater than the yearly differences with age, estimated linearly from the cross-sectional sample. The difference between the various tissue volumes was uniform with the least difference for WMH (−0.62% vs. −0.41%, −0.74% vs. −0.50%, −0.75% vs. −0.52%, −0.42% vs −0.26%, 1.61% vs. 1.07% and 6.54% vs. 5.00% for TBP, GM, NWM, TWM, CSF and WMH respectively, after adjusting for sex). This finding is in contrast with results in some previous studies (Resnick et al., 2003; Scahill et al., 2003; Fotenos et al., 2005) but in agreement with other (Raz et al., 2003; Raz et al., 2005). The substantially greater annual rate of change in tissue volumes in the longitudinal subset compared to the estimates from the cross-sectional sample can not be explained solely by differences in study groups. A comparison of the baseline cross-sectional estimates in the longitudinal subset (n=367) with the subjects not participating in the follow-up (n=3936), generally showed similar differences in tissue volumes per year of age (supplementary tables 1 and 2). The difference between the two groups was not significant for any of the tissue classes. Furthermore, the basic characteristics of subjects in the two groups did not differ significantly except in age (75±5 vs 76±5 years) and smoking (8.7 vs 12.3%). While cross-sectional estimates are often described as yearly rates of change, true age changes can only be estimated from longitudinal data. Secular changes and subsequent cohort affects confound estimates of age effects based on cross-sectional studies. This limitation is especially critical in investigation of age effects on brain volume, as secular drifts in body and brain weight have been documented (Resnick et al., 2000). Differences between cross-sectional and longitudinal estimates are often seen and issues related to survival, non-response, cohort effects all contribute to the differences (Schaie, 1965).
There was a small but significant longitudinal change in ICV corresponding to an average annual rate of 0.10% (CI: 0.09% to 0.12%) after adjusting for sex. This change increased with follow-up time. Strategies to correct for voxel scaling errors in longitudinal studies include the normalization of tissue volumes to ICV at every time point and registering the repeated scan directly to the baseline scan (Clarkson et al., 2009). The latter methodology has recently been the topic of extensive discussion regarding the possible introduction of bias due to longitudinal registration methodologies (Fox et al., 2011; Hua et al., 2011; Reuter and Fischl, 2011; Thompson and Holland, 2011); however in the current study the baseline and follow-up scans were processed independently, ruling out that the observed change in ICV over time can be explained by such a bias. The change in ICV in this study was considered a longitudinal measurement error due to MR equipment calibration inaccuracies affecting voxel size. Results from daily phantom scans during the study period using the System Performance Test from the scanner vendor showed a small but consistent geometric drift corresponding to annual increase in voxel size of 0.12%. Given the small magnitude of this error and that actions were taken to correct for it by normalizing tissue volumes to ICV, the effect of it on the results in this study was considered negligible.
4.3 Study strengths and limitations
The study described here has some major strengths. Our findings are based on a well-characterized, large population-based cohort of older men and women. Importantly, we could study the difference between cross-sectional and longitudinal estimates of brain loss in the same cohort. Furthermore, we used a highly reliable automated tissue segmentation method that provided quantification of all brain tissues as well as WMH.
This study does have some limitations. First, individuals with no data on brain volumes were significantly different from those who had such data. They were on average older, were more often smokers, had higher prevalence of hypertension, had higher BMI and more often had diabetes. Therefore, people with lower brain volumes may have been underrepresented. Second, the core part of this study is cross-sectional in design and findings may include cohort effects not accounted for. Third, the similarity index of the automatic segmentation compared to the manual segmentation for WMH was relatively low. The mean WMH volume was slightly higher with the automatic segmentation compared to the manual segmentation. This difference was not statistically significant (p=0.18). The automatic approach had tendency to slightly overestimate the size of WMH. It has been suggested that overlaps are generally better for tissue classes with larger volumes and/or tissue classes that are contiguous with many interior voxels compared to boundary voxels. The underlying reason for this is that larger volumes with high overlaps will have relatively fewer partial-volume voxels than small regions (Cardenas et al., 2001). We believe this explains the relatively lower similarity index for WMH (0.62), compared to the other tissue classes (0.82, 0.82 and 0.83 for GM, NWM and CSF respectively).
5.0 Conclusion
The results of this study provide evidence of age and sex related patterns of structural brain changes in a general population of elderly individuals. The evidence was provided using an automatic tissue classification pipeline on the largest cross-sectional and longitudinal sample of older people to date. Total brain atrophy was found to be due to volume loss in both NWM and GM. After adjusting for intra-cranial volume, women had larger brain volumes than men. The longitudinal data showed a significant age-sex interaction in total brain parenchymal volume, white matter and total white matter volume with a greater rate of change in men than women. The longitudinal data also showed a significant age-sex interaction in white matter hyperintensity volume with a greater rate of change in women than men. The cross-sectional data did not show significant age-sex interaction. Our findings show that the cross-sectional data underestimate the rate of change in tissue volumes with age as the longitudinal data show substantially greater rate of change in tissue volumes with age for all tissue types.
Supplementary Material
Highlights.
We report structural brain changes in a general population of 4303 elderly
We report cross-sectional and longitudinal estimates from the same sample
Brain atrophy was found to be due to volume loss in both WM and GM
Total brain volume loss with age was significantly greater in men than women
Longitudinal data show greater rate of change compared to cross-sectional estimates
Acknowledgment
This study has been funded by NIH contract N01-AG-1-2100, the NIA Intramural Research Program, Hjartavernd (the Icelandic Heart Association), and the Althingi (the Icelandic Parliament). The study is approved by the Icelandic National Bioethics Committee, VSN: 00-063. The researchers are indebted to the participants for their willingness to participate in the study.
Abbreviations
- AGES
Age Gene/Environment Susceptibility
- WMH
white matter hyperintensities
- CSF
cerebrospinal fluid
- SD
standard deviation
- WM
white matter
- TWM
total white matter
- GM
grey matter
- TBP
total brain parenchyma
- CI
confidence interval
- SNR
signal-to-noise ratio
- CNR
contrast-to-noise ratio
- 3D-SPGR
three dimensional spoiled gradient echo
- FLAIR
fluid attenuated inversion recovery
- BET
brain extraction tool
- ICV
intra-cranial volume
- r
intra-class correlation
- CoV
coeffcient of variation
- GM/WM
GM-to-WM ratio
Footnotes
Publisher's Disclaimer: This is a PDF file of an unedited manuscript that has been accepted for publication. As a service to our customers we are providing this early version of the manuscript. The manuscript will undergo copyediting, typesetting, and review of the resulting proof before it is published in its final citable form. Please note that during the production process errors may be discovered which could affect the content, and all legal disclaimers that apply to the journal pertain.
Conflicts of interest
The authors have no conflict of interest in connection with this study.
References
- Allen JS, Bruss J, Brown CK, Damasio H. Normal neuroanatomical variation due to age: The major lobes and a parcellation of the temporal region. Neurobiology of Aging. 2005;26:1245–1260. doi: 10.1016/j.neurobiolaging.2005.05.023. [DOI] [PubMed] [Google Scholar]
- Barnes J, Ridgway GR, Bartlett J, Henley SMD, Lehmann M, Hobbs N, Clarkson MJ, MacManus DG, Ourselin S, Fox NC. Head size, age and gender adjustment in MRI studies: a necessary nuisance? NeuroImage. 2010;53:1244–1255. doi: 10.1016/j.neuroimage.2010.06.025. [DOI] [PubMed] [Google Scholar]
- Brickman AM, Schupf N, Manly JJ, Luchsinger JA, Andrews H, Tang MX, Reitz C, Small SA, Mayeux R, DeCarli C, Brown TR. Brain Morphology in Older African Americans, Caribbean Hispanics, and Whites From Northern Manhattan. Arch Neurol. 2008;65:1053–1061. doi: 10.1001/archneur.65.8.1053. [DOI] [PMC free article] [PubMed] [Google Scholar]
- Cardenas VA, Ezekiel F, Di Sclafani V, Gomberg B, Fein G. Reliability of tissue volumes and their spatial distribution for segmented magnetic resonance images. Psychiatry Research: Neuroimaging. 2001;106:193–205. doi: 10.1016/s0925-4927(01)00075-0. [DOI] [PubMed] [Google Scholar]
- Clarkson MJ, Ourselin S, Nielsen C, Leung KK, Barnes J, Whitwell JL, Gunter JL, Hill DLG, Weiner MW, Jack CR, Jr, Fox NC. Comparison of phantom and registration scaling corrections using the ADNI cohort. NeuroImage. 2009;47:1506–1513. doi: 10.1016/j.neuroimage.2009.05.045. [DOI] [PMC free article] [PubMed] [Google Scholar]
- Courchesne E, Chisum HJ, Townsend J, Cowles A, Covington J, Egaas B, Harwood M, Hinds S, Press GA. Normal Brain Development and Aging: Quantitative Analysis at in Vivo MR Imaging in Healthy Volunteers. Radiology. 2000;216:672–682. doi: 10.1148/radiology.216.3.r00au37672. [DOI] [PubMed] [Google Scholar]
- DeCarli C, Massaro J, Harvey D, Hald J, Tullberg M, Au R, Beiser A, D'Agostino R, Wolf PA. Measures of brain morphology and infarction in the framingham heart study: establishing what is normal. Neurobiology of Aging. 2005;26:491–510. doi: 10.1016/j.neurobiolaging.2004.05.004. [DOI] [PubMed] [Google Scholar]
- Enzinger C, Fazekas F, Matthews PM, Ropele S, Schmidt H, Smith S, Schmidt R. Risk factors for progression of brain atrophy in aging: Six-year follow-up of normal subjects. Neurology. 2005;64:1704–1711. doi: 10.1212/01.WNL.0000161871.83614.BB. [DOI] [PubMed] [Google Scholar]
- Fjell AM, Walhovd KB, Fennema-Notestine C, McEvoy LK, Hagler DJ, Holland D, Brewer JB, Dale AM. One-Year Brain Atrophy Evident in Healthy Aging. The Journal of Neuroscience. 2009;29:15223–15231. doi: 10.1523/JNEUROSCI.3252-09.2009. [DOI] [PMC free article] [PubMed] [Google Scholar]
- Fotenos AF, Snyder AZ, Girton LE, Morris JC, Buckner RL. Normative estimates of cross-sectional and longitudinal brain volume decline in aging and AD. Neurology. 2005;64:1032–1039. doi: 10.1212/01.WNL.0000154530.72969.11. [DOI] [PubMed] [Google Scholar]
- Fox NC, Ridgway GR, Schott JM. Algorithms, atrophy and Alzheimer's disease: Cautionary tales for clinical trials. NeuroImage. 2011;57:15–18. doi: 10.1016/j.neuroimage.2011.01.077. [DOI] [PubMed] [Google Scholar]
- Ge Y, Grossman RI, Babb JS, Rabin ML, Mannon LJ, Kolson DL. Age-Related Total Gray Matter and White Matter Changes in Normal Adult Brain. Part I: Volumetric MR Imaging Analysis. AJNR Am J Neuroradiol. 2002;23:1327–1333. [PMC free article] [PubMed] [Google Scholar]
- Godin O, Maillard P, Crivello F, Alpérovitch A, Mazoyer B, Tzourio C, Dufouil C. Association of White-Matter Lesions with Brain Atrophy Markers: The Three-City Dijon MRI Study. Cerebrovascular Diseases. 2009;28:177–184. doi: 10.1159/000226117. [DOI] [PubMed] [Google Scholar]
- Good CD, Johnsrude IS, Ashburner J, Henson RNA, Friston KJ, Frackowiak RSJ. A Voxel-Based Morphometric Study of Ageing in 465 Normal Adult Human Brains. NeuroImage. 2001;14:21–36. doi: 10.1006/nimg.2001.0786. [DOI] [PubMed] [Google Scholar]
- Greenberg DL, Messer DF, Payne ME, MacFall JR, Provenzale JM, Steffens DC, Krishnan RR. Aging, gender, and the elderly adult brain: An examination of analytical strategies. Neurobiology of Aging. 2008;29:290–302. doi: 10.1016/j.neurobiolaging.2006.09.016. [DOI] [PMC free article] [PubMed] [Google Scholar]
- Guttmann CR JF, Kikinis R, Killiany RJ, Moss MB, Sandor T, et al. White matter changes with normal aging. Neurology. 1998;50:972–978. doi: 10.1212/wnl.50.4.972. [DOI] [PubMed] [Google Scholar]
- Harris GS E, Peng LW, Lee S, Federman EB, Pearlson GD. Magnetic resonance imaging evaluation of the effects of ageing on grey-white ratio in the human brain. Neuropatholgy and Applied Neurobiology. 1994;20:290–293. doi: 10.1111/j.1365-2990.1994.tb00971.x. [DOI] [PubMed] [Google Scholar]
- Harris TB, Launer LJ, Eiriksdottir G, Kjartansson O, Jonsson PV, Sigurdsson G, Thorgeirsson G, Aspelund T, Garcia ME, Cotch MF, Hoffman HJ, Gudnason V, Age GES-RSI Age, Gene/Environment Susceptibility-Reykjavik Study: Multidisciplinary Applied Phenomics. Am. J. Epidemiol. 2007;165:1076–1087. doi: 10.1093/aje/kwk115. [DOI] [PMC free article] [PubMed] [Google Scholar]
- Hua X, Gutman B, Boyle CP, Rajagopalan P, Leow AD, Yanovsky I, Kumar AR, Toga AW, Jack CR, Jr, Schuff N, Alexander GE, Chen K, Reiman EM, Weiner MW, Thompson PM. Accurate measurement of brain changes in longitudinal MRI scans using tensor-based morphometry. NeuroImage. 2011;57:5–14. doi: 10.1016/j.neuroimage.2011.01.079. [DOI] [PMC free article] [PubMed] [Google Scholar]
- Ikram MA, Vrooman HA, Vernooij MW, van der Lijn F, Hofman A, van der Lugt A, Niessen WJ, Breteler MMB. Brain tissue volumes in the general elderly population: The Rotterdam Scan Study. Neurobiology of Aging. 2008;29:882–890. doi: 10.1016/j.neurobiolaging.2006.12.012. [DOI] [PubMed] [Google Scholar]
- Mazziotta AT J, Evans A, Fox P, Lancaster J, Zilles K, Woods R, Paus T, Simpson G, Pike B, Holmes C, Collins L, Thompson P, MacDonald D, Iacoboni M, Schormann T, Amunts K, Palomero-Gallagher N, Geyer S, Parsons L, Narr K, Kabani N, Le Goualher G, Boomsma D, Cannon T, Kawashima R, Mazoyer B. Stereotaxic registration of the MRI volumes was achieved using the CBM152 linear target. Philos Trans R Soc Lond B Biol Sci. 2001;356:1293–1322. doi: 10.1098/rstb.2001.0915. [DOI] [PMC free article] [PubMed] [Google Scholar]
- Jernigan TL, Archibald SL, Fennema-Notestine C, Gamst AC, Stout JC, Bonner J, Hesselink JR. Effects of age on tissues and regions of the cerebrum and cerebellum. Neurobiology of aging. 2001;22:581–594. doi: 10.1016/s0197-4580(01)00217-2. [DOI] [PubMed] [Google Scholar]
- Jernigan TL, Gamst AC. Changes in volume with age--consistency and interpretation of observed effects. Neurobiology of Aging. 2005;26:1271–1274. doi: 10.1016/j.neurobiolaging.2005.05.016. [DOI] [PubMed] [Google Scholar]
- Pfefferbaum A, Mathalon DH, Sullivan EV, Rawles JM, Zipursky RB, Lim KO. A quantitative magnetic resonance imaging study of changes in brain morphology from infancy to late adulthood. Archives of Neurology. 1994;51:874–877. doi: 10.1001/archneur.1994.00540210046012. [DOI] [PubMed] [Google Scholar]
- Raz N, Lindenberger U, Rodrigue KM, Kennedy KM, Head D, Williamson A, Dahle C, Gerstorf D, Acker JD. Regional Brain Changes in Aging Healthy Adults: General Trends, Individual Differences and Modifiers. Cerebral Cortex. 2005;15:1676–1689. doi: 10.1093/cercor/bhi044. [DOI] [PubMed] [Google Scholar]
- Raz N, Rodrigue KM, Kennedy KM, Head D, Gunning-Dixon F, Acker JD. Differential Aging of the Human Striatum: Longitudinal Evidence. AJNR Am J Neuroradiol. 2003;24:1849–1856. [PMC free article] [PubMed] [Google Scholar]
- Resnick SM, Goldszal AF, Davatzikos C, Golski S, Kraut MA, Metter EJ, Bryan RN, Zonderman AB. One-year Age Changes in MRI Brain Volumes in Older Adults. Cereb. Cortex. 2000;10:464–472. doi: 10.1093/cercor/10.5.464. [DOI] [PubMed] [Google Scholar]
- Resnick SM, Pham DL, Kraut MA, Zonderman AB, Davatzikos C. Longitudinal Magnetic Resonance Imaging Studies of Older Adults: A Shrinking Brain. J. Neurosci. 2003;23:3295–3301. doi: 10.1523/JNEUROSCI.23-08-03295.2003. [DOI] [PMC free article] [PubMed] [Google Scholar]
- Reuter M, Fischl B. Avoiding asymmetry-induced bias in longitudinal image processing. NeuroImage. 2011;57:19–21. doi: 10.1016/j.neuroimage.2011.02.076. [DOI] [PMC free article] [PubMed] [Google Scholar]
- Saczynski JS, Sigurdsson S, Jonsdottir MK, Eiriksdottir G, Jonsson PV, Garcia ME, Kjartansson O, Lopez O, van Buchem MA, Gudnason V, Launer LJ. Cerebral Infarcts and Cognitive Performance: Importance of Location and Number of Infarcts. Stroke. 2009;40:677–682. doi: 10.1161/STROKEAHA.108.530212. [DOI] [PMC free article] [PubMed] [Google Scholar]
- Scahill RI, Frost C, Jenkins R, Whitwell JL, Rossor MN, Fox NC. A Longitudinal Study of Brain Volume Changes in Normal Aging Using Serial Registered Magnetic Resonance Imaging. Arch Neurol. 2003;60:989–994. doi: 10.1001/archneur.60.7.989. [DOI] [PubMed] [Google Scholar]
- Schaie W. A general model for the study of development problems. Psychological Bulletin. 1965;64:92–107. doi: 10.1037/h0022371. [DOI] [PubMed] [Google Scholar]
- Sled J, Zijdenbos A, Evans A. A comparison of retrospective intensity non-uniformity correction methods for MRI. Information Processing in Medical Imaging. 1997:459–464. [Google Scholar]
- Sluimer JD, Bouwman FH, Vrenken H, Blankenstein MA, Barkhof F, van der Flier WM, Scheltens P. Whole-brain atrophy rate and CSF biomarker levels in MCI and AD: A longitudinal study. Neurobiology of Aging. 2010;31:758–764. doi: 10.1016/j.neurobiolaging.2008.06.016. [DOI] [PubMed] [Google Scholar]
- Smith SM. Fast robust automated brain extraction. Human Brain Mapping. 2002;17:143–155. doi: 10.1002/hbm.10062. [DOI] [PMC free article] [PubMed] [Google Scholar]
- Taki Y, Goto R, Evans A, Zijdenbos A, Neelin P, Lerch J, Sato K, Ono S, Kinomura S, Nakagawa M, Sugiura M, Watanabe J, Kawashima R, Fukuda H. Voxel-based morphometry of human brain with age and cerebrovascular risk factors. Neurobiology of Aging. 2004;25:455–463. doi: 10.1016/j.neurobiolaging.2003.09.002. [DOI] [PubMed] [Google Scholar]
- Tang Y, Whitman GT, Lopez I, Baloh RW. Brain volume changes on longitudinal magnetic resonance imaging in normal older people. J Neuroimaging. 2001;11:393–400. doi: 10.1111/j.1552-6569.2001.tb00068.x. [DOI] [PubMed] [Google Scholar]
- The American Psychiatric Association . Diagnostic and statistical manual of mental disorders. 4th ed.,text revision The American Psychiatric Association; Washington, DC: 2000. [Google Scholar]
- Thompson PM, Hayashi KM, de Zubicaray G, Janke AL, Rose SE, Semple J, Herman D, Hong MS, Dittmer SS, Doddrell DM, Toga AW. Dynamics of Gray Matter Loss in Alzheimer's Disease. J. Neurosci. 2003;23:994–1005. doi: 10.1523/JNEUROSCI.23-03-00994.2003. [DOI] [PMC free article] [PubMed] [Google Scholar]
- Thompson WK, Holland D. Bias in tensor based morphometry Stat-ROI measures may result in unrealistic power estimates. NeuroImage. 2011;57:1–4. doi: 10.1016/j.neuroimage.2010.11.092. [DOI] [PMC free article] [PubMed] [Google Scholar]
- Walhovd KB, Fjell AM, Reinvang I, Lundervold A, Dale AM, Eilertsen DE, Quinn BT, Salat D, Makris N, Fischl B. Effects of age on volumes of cortex, white matter and subcortical structures. Neurobiology of Aging. 2005;26:1261–1270. doi: 10.1016/j.neurobiolaging.2005.05.020. [DOI] [PubMed] [Google Scholar]
- WHO . International Statistical Classification of Diseases and Related Health Problems, 10th Revision. Geneva: 1992. [Google Scholar]
- Xu J, Kobayashi S, Yamaguchi S, Iijima K-i, Okada K, Yamashita K. Gender Effects on Age-Related Changes in Brain Structure. AJNR Am J Neuroradiol. 2000;21:112–118. [PMC free article] [PubMed] [Google Scholar]
- Zijdenbos AP, Dawant BM, Margolin RA, Palmer AC. Morphometric analysis of white matter lesions in MR images: method and validation. IEEE Trans Med Imaging. 1994;13:716–724. doi: 10.1109/42.363096. [DOI] [PubMed] [Google Scholar]
- Zijdenbos AP, Forghani R, Evans AC. Automatic “pipeline” analysis of 3-D MRI data for clinical trials: application to multiple sclerosis. IEEE Trans Med Imaging. 2002;21:1280–1292. doi: 10.1109/TMI.2002.806283. [DOI] [PubMed] [Google Scholar]
Associated Data
This section collects any data citations, data availability statements, or supplementary materials included in this article.