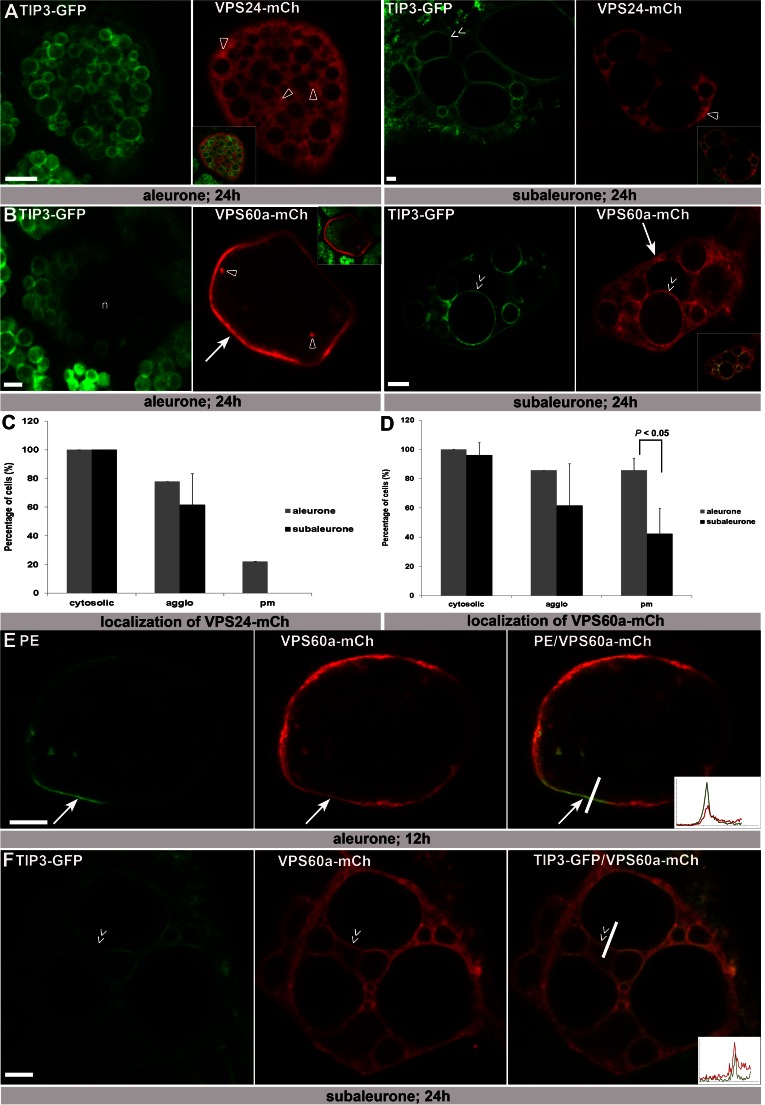
Fig. 4.
The localization of HvVPS60a-mCh differs in aleurone and subaleurone and shows plasma membrane localization in aleurone. a Single scans of barley aleurone and subaleurone cells showing transient transformation of HvVPS24-mCh in TIP3-GFP lines. In both, aleurone and subaleurone, HvVPS24-mCh localizes cytosolic and at small agglomerations (open arrowheads). Note the close ups to visualize co-localization. b Confocal single scans of HvVPS60a-mCh in TIP3-GFP lines and of co-transformation of HvVPS60a-mCh with TIP3-GFP. In aleurone, HvVPS60a-mCh shows strong signal at the pm (arrow), weak in the cytosol in parallel to small agglomeration structures (open arrowheads). Note the altered localization of HvVPS60a-mCh in subaleurone cells. HvVPS60a-mCh signal could be detected close to heterogenous, spherical PSVs (double arrow) but reduced at the PM (arrow). Note the close ups to visualize co-localization. c, d Localization of HvVPS24-mCh and HvVPS60a-mCh in aleurone and subaleurone. Relative number of cells showing localization in cytosol at agglomerations and at the PM was scored. Total number of cells: HvVPS24-mCh in aleurone (biological replicates 1; n = 18) and in subaleurone (biological replicates 3; n = 13); HvVPS60a-mCh in aleurone (biological replicates 1; n = 14) and in subaleurone (biological replicates 3; n = 24). The difference in the localization of HvVPS60a-mCh at the PM in aleurone and subaleurone is statistically significant (P < 0.05). Plus ends of the standard deviation are indicated. e Single scan of an aleurone cell showing co-localization of the plasma membrane marker PMA-EGFP (PE) and HvVPS60a-mCh at the pm (arrow). Fluorescence profile: X-axis, distance [μm] from 0 to 6 μm; Y-axis, intensity from 0 to 100. f Single confocal scan of a subaleurone cell that shows co-localization of HvVPS60a-mCh and the vacuolar membrane signal of the TIP3-GFP line. Note the double arrows indicating co-localization of HvVPS60a-mCh with the PSV membrane. Fluorescence profile: X-axis, distance [μm] from 0 to 8 μm; Y-axis, intensity from 0 to 100. Confocal single scans and z-series were made 24 h after bombardment. Scale = 5 μm

