

Abstract
Taste is responsible for evaluating the nutritious content of food, guiding essential appetitive behaviors, preventing the ingestion of toxic substances, and helping ensure the maintenance of a healthy diet. Sweet and bitter are two of the most salient sensory percepts for humans and other animals; sweet taste permits the identification of energy-rich nutrients while bitter warns against the intake of potentially noxious chemicals1. In mammals, information from taste receptor cells in the tongue is transmitted through multiple neural stations to the primary gustatory cortex in the brain2. Recent imaging studies have shown that sweet and bitter are represented in the primary gustatory cortex by neurons organized in a spatial map3,4, with each taste quality encoded by distinct cortical fields4. Here we demonstrate that by manipulating the brain fields representing sweet and bitter taste we directly control an animal’s internal representation, sensory perception, and behavioral actions. These results substantiate the segregation of taste qualities in the cortex, expose the innate nature of appetitive and aversive taste responses, and illustrate the ability of gustatory cortex to recapitulate complex behaviors in the absence of sensory input.
In mice, sweet and bitter activate cortical fields in the insula (taste cortex) that are separated topographically by approximately 2 millimeters4 (Fig. 1a and Extended Data Fig. 1). We hypothesized that if these cortical fields represent sweet and bitter percepts, their direct activation would evoke “bitter and sweet sensation” even in the absence of an actual bitter or sweet stimulus. To optogenetically control activation of the gustatory cortex, we introduced channelrhodopsin5 (ChR2) to the insula of wild type mice by stereotaxic injection of adeno-associated virus (AAV) targeted to either the bitter or the sweet cortical field (see Fig. 1a–b, Extended Data Fig. 1, Supplementary Table 1 and Methods for details). Single unit recordings of the insular cortex of transduced animals demonstrated that photostimulation evoked reliable neuronal firing that is phase locked to light delivery (Fig. 1c, see also Extended Data Fig. 1b).
Figure 1. Place preference by photostimulation of the sweet and bitter cortical fields.

a, Sample injection of reporters in stereotactic coordinates defining the sweet and bitter cortical fields. Upper panel shows sweet cortex labeled with AAV-GFP and bitter cortex with AAV-TdTomato; lower panel shows a horizontal section. See Extended Data Figure 1 for additional data. b, Coronal section of a mouse brain (bregma −0.2) stained with TO-PRO-3 (blue). Shown is a representative histological sample of the bitter cortical field expressing ChR2-YFP, illustrating the location and trajectory (dotted lines) of the implanted guide cannula; IC, insular cortex. c, In vivo recording of ChR2-expressing insular cortical neurons in response to light stimulation (10 pulses, 10 Hz). The expanded traces show responses to each light pulse (blue bars below the trace). d, Left, representative tracking of a mouse during the 5 min preference test in a two-chamber arena; Chamber 1 was coupled to light stimulation of the sweet cortical field during the training sessions. Shown are the fractions of time spent in each chamber. Right, quantitation of preference index before (pre-) and after (Chamber 1) training with photostimulation of the sweet cortical field (n = 13 animals; Mann-Whitney U test, P < 0.003). Preference can be readily reversed by light stimulation in the opposing side (Chamber 2, n = 6; P < 0.02). e, Representative mouse track and quantitation of preference index in mice expressing ChR2 in the bitter cortical field; note significant aversion to the chamber coupled to photostimulation (Chamber 1, n = 15; Mann-Whitney U test, P < 0.005); this behavioral aversion can be switched to the opposite chamber by re-exposure to photostimulation in Chamber 2 (n = 4; P < 0.03). Values are mean ± s.e.m. See Extended Data Fig. 2b for GFP control injections.
We reasoned that optogenetic activation of the sweet cortical field should trigger behavioral attraction, while stimulation of the bitter field should cause strong behavioral avoidance. We used a place-preference test6 where animals expressing ChR2 in the sweet cortex are introduced to a 2-chamber arena in which presence in one of the two chambers is coupled to optogenetic stimulation, in the absence of any reward or punishment; we then determined the animal’s preference index as a measure of the time spent in the chamber that was coupled with light stimulation. When the sweet cortical field was stimulated, animals developed strong preference to the chamber coupled to ChR2 stimulation (Fig. 1d; Extended Data Fig. 2). This preference could be transferred to either side of the arena by switching the chamber coupled to the laser stimulation of sweet cortex (Fig. 1d, compare chamber 1 versus chamber 2). When the same set of experiments were performed in animals expressing ChR2 in the bitter cortical field, mice now displayed a range of unconditioned aversive behaviors (see next section), and after just a few sessions strongly avoided the chamber linked to photostimulation (Fig. 1e). Mice injected with a control AAV-eGFP construct exhibited no significant place preference following laser stimulation of either the sweet or bitter cortical fields (Extended Data Fig. 2b). Together, these observations demonstrate that neurons in the sweet and bitter cortical fields drive attractive and aversive responses, respectively.
Next, we examined if activation of the bitter and sweet cortical fields evokes classical taste behaviors7. We hypothesized that optogenetic activation of the bitter cortical field should trigger strong light-dependent suppression of licking, while activation of the sweet cortical field should trigger appetitive responses.
We used a behavioral test where motivated animals (i.e. thirsty) were trained to lick water in response to a combination visual/tone cue in a head-restrained set-up8 (see Methods). We then subjected the trained animals expressing ChR2 in the bitter cortical field to testing sessions consisting of a series of water-only trials, but in half of the trials the bitter cortical field was stimulated upon contact of the tongue with the water spout.
During the entire session we imaged (i.e. facial features), recorded, and measured licking responses. Figure 2 demonstrates that when the bitter cortical field is stimulated, there is a dramatic suppression of licking behavior (see also Supplementary Video 1), with the animal’s response closely following the ChR2 activation of the bitter cortex. Notably, following strong laser stimulation (10–20 mW), the animals displayed prototypical taste rejection orofacial responses, sometimes including gagging (gaping9), and attempts to clean and rid the mouth of the non-existent bitter tastant (Supplementary Video 1; see legend for details).
Figure 2. Photostimulation of bitter and sweet cortical fields drives aversive and appetitive behaviors.

a, b, Representative raster plots (left panel) and histograms (right panel) illustrating licking events during a 5 sec licking window in the presence (blue) or absence (open) of light stimulation of (a) the bitter and (b) the sweet cortical field. The purple line at time zero indicates the start of each trial, and the green line indicates the onset of water delivery. c, d, Quantitation of licking responses with and without light stimulation in (c) the bitter cortical field (n = 34, Mann-Whitney U test, P < 4×10⁻¹²) or (d) sweet cortical field (n = 31, Mann-Whitney U test, P < 5×10⁻⁵) of wild type mice. e, f, Quantitation of licking responses in TrpM5 knockout mice (e, bitter cortical fields, n = 9, Mann-Whitney U test, P < 5×10⁻⁵; f, sweet cortical fields, n = 10, Mann-Whitney U test, P = 0.001). Each point indicates data from an individual mouse before and after photostimulation.
What about the sweet cortical field? A characteristic feature of sweet taste is that non-thirsty animals remain robustly attracted to sweet solutions, even though they exhibit limited interest for water10. Therefore, we predicted that a mildly water-satiated animal expressing ChR2 in the sweet cortical field would still show little attraction for water in control trials (referred to as off-trials), but would exhibit significantly enhanced licking during water trials coupled to laser stimulation of the sweet cortical field (referred to as on-trials). Importantly, the experiment is set up such that the laser shutter is under contact-licking operation, so the animal has control of its own stimulation during the on-trials, and therefore only persistent licking (i.e. self-stimulation) would continue to activate the sweet cortex. Our results demonstrate that animals aggressively self-stimulate during on-trial sessions, with ChR2 activation of the sweet cortical field radically increasing licking behavior, even though the spout still delivers only water, as in the off-trials (Fig. 2b,d).
Just as a lot of sugar can “mask” a bitter tastant, we hypothesized that strong activation of the cortical field representing sweet taste might be capable of overcoming the natural aversion to an orally applied bitter stimulus. Therefore, we asked whether photostimulation of the sweet cortical field in animals expressing ChR2 in sweet cortex can switch preference for an otherwise aversive tastant. Conversely, we also tested whether photostimulation of the bitter cortical field triggers aversion to an otherwise sweet, attractive tasting chemical. Our results (Extended Data Fig. 3) show both postulates to be correct, and highlight how activation of selective taste cortical fields can mask the hedonic value of oral taste stimulation.
The experiments described above showed that direct control of primary taste cortex can evoke specific, reliable, and robust behaviors naturally symbolic of taste responses to chemical tastants. These gain-of-function studies also illustrate how top-down control of the taste pathway can activate innate, immediate responses to sweet and bitter chemicals.
To formally demonstrate that these cortically-triggered behaviors are innate (i.e. independent of learning or experience) we carried out similar stimulation experiments in mice that never tasted sweet or bitter chemicals (TRPM5 null mice10, Extended Data Fig. 4). Indeed, our results (Fig. 2e,f) showed that even in animals that have never experienced sweet or bitter taste, ChR2-activation of the corresponding cortical fields still triggered the appropriate behavioral response, thus substantiating the predetermined nature of the sense of taste.
It has been known for a long time that decerebrated animals can still exhibit stereotyped attraction and aversion to sweet and bitter chemicals11. This is thought to be mediated by brainstem taste circuits dedicated to immediate responses11,12. Therefore, to evaluate the necessity (and sufficiency, see next section) of taste cortex in taste recognition and discrimination, we needed to design a test that bypasses immediate taste responses, and instead engages cortical circuits. In this assay (go/no-go behavioral test)13,14, thirsty animals were trained to sample a test tastant from a spout, and then to report its identity either by licking (go) or withholding licking (no-go; Fig. 3). This learned behavior requires that the animal samples the cue, recognizes the tastant and executes the appropriate behavior in each trial. We trained animals several ways, including to go to bitter and no-go to sweet, exactly the opposite of the innate drive. After 10–15 sessions of training (each consisting of 80 trials, with 40 randomly presented sweet and 40 bitter cues), mice were able to report the tastant’s identity with near 90% accuracy (Fig. 3). To further demonstrate the selectivity of the assay and responses, we next tested the animals with sweet and bitter chemicals not used in the training phase. Given that all sweet tastants activate the same sweet taste receptor15–17, and all bitters the same class of TRCs18, we expected that novel sweets should also be recognized as no-go cues, while novel bitters should be seen as go cues. Indeed, animals trained with the bitter tastant quinine and the artificial sweetener Acesulfame K (AceK), recognized and responded with similar accuracy to cycloheximide and sucrose, a bitter and a sweet tastant of completely different chemical structures from the training set (Fig. 3c).
Figure 3. Go/no-go taste discrimination task in head-restrained mice.
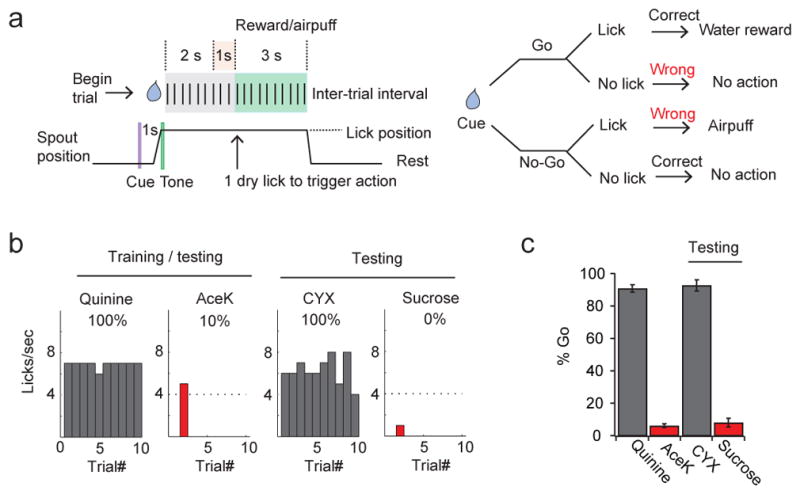
a, Schematic and flow chart of the go/no-go taste discrimination task. Each trial starts with a visual cue (purple line), followed 1 sec later by a tone (green line) to alert mice to initiate licking. After sampling, mice were given 3 sec to continue to lick (go) or withhold licking (no-go) in response to the test tastant. For go trials, mice were rewarded with water (3 sec) if they chose to lick within the 3-sec interval. For no-go trials, mice received a mild air puff to the eyelid if they failed to withhold licking. After the reward/penalty phase, the spout retracted and was cleared for the next trial; inter-trial intervals were 8 sec. b, Representative histograms illustrating recognition and generalization within bitters and sweets. This animal was trained and tested with 4 mM Acek (sweet no-go) and 0.5 mM quinine (bitter go), and then assayed with 100 mM sucrose and 10 μM cycloheximide (CYX). c, Quantitation in 9 animals, demonstrating highly reliable taste recognition and discrimination. Values are mean ± s.e.m.
We implanted cannulas bilaterally into the bitter cortical fields of trained animals (Supplementary Table 1), waited 2 weeks for recovery, and assayed tastant discrimination in the go/no-go behavioral paradigm before and after bilateral injection of a glutamate receptor antagonist (NBQX) to silence cortical activity19,20. As shown in Figure 4, silencing the bitter cortical fields prevented animals from reliably identifying the bitter tastant (see Extended Data Fig. 5 for additional examples using the reverse training paradigm). In contrast, their ability to recognize sweet tastants remained unimpaired. Importantly, the loss of bitter taste function is fully reversible upon washout of the drug (Fig. 4a), while injection of a saline control in the bitter cortical fields had no significant effect on either bitter or sweet taste sensing (Fig. 4b). We used the same strategy to conduct loss-of-function experiments in the sweet cortex. Indeed, bilateral silencing of the sweet cortical fields disrupted sweet, but not bitter taste discrimination (Fig. 4c,d). As expected, animals recovered sweet taste perception after drug washout. Taken together, these results substantiate the essential role of the sweet and bitter cortical fields in sweet and bitter taste recognition.
Figure 4. Inactivation of the bitter and sweet cortical fields disrupts taste discrimination.

a, Quantitation of performance ratios (see methods) before and after bilateral silencing (NBQX, 5 mg/ml) of the bitter cortical fields (n = 8); animals were trained to no-go to bitter and go to sweet. Note the impact in bitter taste discrimination, but no significant effect in sweet taste. After washout of the drug, the animal’s ability to recognize bitter is restored. Comparable results are obtained when animals are instead trained to go to bitter and no-go to sweet (Extended Data Fig. 2). b, Quantitation of performance ratios with saline controls in bitter cortical fields; there is no significant effect on sweet or bitter taste (n = 5; Mann-Whitney U test, P = 0.14). c, Quantitation of performance ratios with bilateral injection of NBQX in the sweet cortical fields (n = 8). Animals were trained to no-go to sweet and go to bitter; note significant deficit in sweet taste, but no effect in bitter taste. After washout of the drug, the animal’s ability to recognize sweet is restored. d, Saline injections in the sweet cortical fields have no significant effect on bitter or sweet taste (n = 7; Mann-Whitney U test, P = 0.80). Values are mean ± s.e.m. Mann-Whitney U test, **P < 0.01, ***P < 0.001.
What is the mouse sensing upon direct activation of a taste cortical field? Does optogenetic stimulation create internal representations that mimic those evoked by sweet and bitter chemicals on the tongue? If so, we reasoned that animals trained to recognize and report the sensory features of an orally provided sweet or bitter tastant (e.g. in a go/no-go assay) should respond similarly to optogenetic stimulation of the corresponding cortical fields, even though the animal was never trained with light stimulation. In essence, if light and the chemical tastant evoke similar percepts, then light will generalize to the learned responses associated with the orally supplied stimulus.
We first focused on sweet, because activation of the bitter cortical field evokes prototypical and highly salient orofacial responses that are already strongly indicative of bitter perception (Supplementary Video 1). We introduced ChR2 into the sweet cortical field of untrained mice and validated robust light-triggered appetitive responses (see Fig. 2). Then, the mice were trained in a go/no-go behavioral paradigm where they learned to associate Go with either a bitter chemical or a low-salt solution (Fig 5a), and no-go with sweet. Critically, under this paradigm mice need to report both an aversive (bitter) and an attractive cue (low salt, Extended Data Fig. 6) in the same arm of the behavioral test, hence removing pure valence21 as a way to identify tastants. After mice performed at or above 80% accuracy (Fig. 5a), we assayed whether light (previously triggering strong appetitive responses) was being sensed and reported as sweet (now a no-go response). Animals were tested with 50 randomized trials consisting of 20 bitter, 10 sweet, 10 low-salt, and 10 low-salt linked to light stimulation of the sweet cortical field. Our results (Fig. 5b) showed that light stimulation of sweet cortex is indeed being sensed as a “fictive” sweet stimulus, eliciting strong and reliable no-go responses; Extended Data Fig. 7 shows similar experiments and equivalent findings with bitter cortex. Taken together, these results show that activation of a taste cortical field recapitulates an internal representation (e.g. perceptual quality) naturally indicative of the orally presented chemical.
Figure 5. Cross-generalization between orally supplied taste stimuli and photostimulation of the sweet cortex.

a, Representative histograms illustrating mouse performance during a training session in the go/no-go discrimination task. The mouse was trained to go to bitter (0.5 mM quinine) and low-salt (20 mM NaCl), and no-go to sweet (4 mM AceK). Note that both bitter (aversive) and low salt (attractive) were used in the same branch of the behavioral task (go) to exclude the valence as an identifier. b, Left, representative histograms illustrating cross-generalization between taste stimulation and photostimulation of the sweet cortical field. Right, quantitation of the responses from individual animals to quinine, AceK, salt and salt + light (n = 8, Mann-Whitney U test, P < 0.0002).
The essential role of the sense of taste is to evaluate the quality of a food source or a meal, and activate the appropriate behavioral actions to consume or reject ingestion1. The taste cortex is thought to represent the basic sensory features of the different taste qualities22,23, and to function as a central neural “hub” that informs and integrates with other brain areas, and the internal state, to guide taste-dependent actions.
This work centered on the study of the two most distinctive taste qualities, sweet and bitter. These two differ not only in quality but also in valence, mediating innately attractive and aversive behaviors. Many studies have used optogenetics to activate ensembles of neurons and examine their physiological and behavioral consequences6,24–27. In this work we explored the internal representation of arguably the two most recognizable chemosensory percepts. Our current studies demonstrate that it is possible to govern an animal’s chemosensory percepts and behavioral responses by direct manipulation of selective taste cortical fields. Notably, unlike our other fundamental chemical sense (smell) activation of the sweet and bitter cortical fields evokes predetermined behavioral programs–independent of learning and experience, further illustrating the hardwired and innate nature of the sense of taste.
Methods
Stereotaxic injections and anatomy
All procedures were carried out according to the approved protocols at Columbia University. Six- to eight-week-old C57BL6/J and TRPM5−/− mice were used for viral injections. All surgeries were carried out using aseptic technique. Mice were anesthetized with ketamine and xylazine (100 mg/kg and 10 mg/kg, intraperitoneal), placed into a stereotaxic frame, and unilaterally injected with ~30 nl AAV carrying ChR2 (AAV9.CamKIIa.hChR2(H134R)-EYFP.WPRE.SV40, Penn Vector Core, PA) either in the sweet cortical field (bregma 1.6 mm; lateral 3.1 mm; ventral 1.8 mm), or the bitter cortical field (bregma −0.3 mm; lateral 4.2 mm; ventral 2.8 mm). Following viral injection, a guide cannula (26 gauge, PlasticsOne, Roanoke, VA) or a customized implantable fiber (200 μm, NA = 0.39) was implanted 300–500 μm above the injection site, and fixed in place with dental cement. A metal head-post was also attached and secured with dental cement for the purpose of head fixation during behavioral experiments. For pharmacological experiments, AAV-ChR2 was injected bilaterally in the sweet or bitter cortical fields, followed by bilateral implantation of guide cannulae. Mice were allowed to recover for 2–3 weeks before the start of behavioral experiments. Placements of viral injections, guide cannulae, and implantable fibers were histologically verified at the termination of the experiments by TO-PRO3 (1:1000, invitrogen) staining of coronal sections (100 μm). Fluorescent images were acquired using a confocal microscope (FV1000, Olympus).
Animals
All behavioral experiments with wild type animals used six- to eight-week-old male C57BL6/J mice. No statistical methods were used to predetermine sample size, and investigators were not blinded to group allocation. No method of randomization was used to determine how animals were allocated to experimental groups.
In vivo recordings
Mice expressing ChR2 in taste cortex were anesthetized with urethane (1.8 mg/g), and the insular cortex was exposed as previously described4. Extracellular neural activity was recorded using a tungsten electrode (resistance 2.0–4.0 MΩ, FHC, Bowdoin, ME). Data were acquired, amplified, digitized, and bandpass filtered at 600–6000 Hz with a Neuralynx data acquisition system. For photostimulation, 10 Hz, 5-ms pulses of 473 nm light (~5 mW) were delivered via a solid-state laser (Shanghai Laser & Optics Century Co.) coupled to an optical fiber (200 μm) positioned above the insular cortex.
c-Fos induction and Immunohistochemistry
Individual mice were implanted with an intraoral cannula28 3 days before c-Fos induction. On the day of experiments, mice were anaesthetized with urethane (1.6 mg/g) and the trachea was cannulated to aid breathing during oral stimulus presentation. Tastants were perfused into the mouth through the intraoral cannula for 1.5 hours at a rate of ~6 ml/hr. Mice were allowed to rest for 30 minutes and processed for immunostaining as previously described. The brains were sectioned coronally at 100 μm, and labeled with goat anti-c-Fos (Santa Cruz, sc-52-G) overnight; Alexa 488 donkey anti-goat or cy3 donkey anti-goat (Jackson immunoResearch) were used to visualize c-Fos expression. All images were taken using an Olympus FluoView 1000 confocal microscope.
Place preference assays
Individual mice were tested in a custom-built two-chamber arena (30 cm × 30 cm total size). To differentiate the chambers, one chamber was designed with alternating black and white vertical stripes on its walls, whereas the other chamber was uniformly black. The arena was contained within a sound-attenuating cubicle (Med Associates; St. Albans, VT). Mice were trained in the arena for 30-min with photostimulation of the sweet or bitter cortical field, and tested in the absence of any light stimulation for 5-min at the end of each session (defined as “preference test”). Animal locations were real-time tracked by video imaging. At the beginning of the experiments, mice were acclimated to the arena for one session without light stimulation (defined as the pre-test condition). Photostimulation sessions began the next day, with two daily sessions for ~1 week. For each mouse, one chamber was randomly selected for photostimulation (Chamber 1); when a mouse was located in this chamber, light was delivered (20 Hz, 20-ms pulses, 5–10 mW) for five-second intervals, with five-second rest periods to avoid over-stimulation or phototoxicity. After one week of sessions, a “reverse probe” study was performed in a subset of animals, during which photostimulation was delivered in the opposing chamber (Chamber 2). Animals were trained for a minimum of 8 sessions, and the preference tests from the last 3 sessions were used to calculate the preference index (PI); PI = (t1-t2)/(t1+t2), where t1 is the fractional time a mouse spent in the Chamber 1, and t2 is the time spent in Chamber 2.
Lick preference assays
Mice were first water-deprived for 24 hours to motivate drinking behavior. They were then introduced to head restraint and acclimated to drinking from a motor-positioned spout in 60-trial sessions (15 min), twice a day for 3 days. Each trial began with a flash, followed one second later by the spout swinging into position and a tone (4k Hz) to indicate the onset of water delivery. The spout remained in position for 5 sec and was then removed. Mice were weighed daily during the habituation period as well as during any behavioral tests requiring water restriction. Additional water was supplied as necessary to ensure that animals maintained at least 85% of their initial body weight. To measure attractive/appetitive responses, mice were mildly water restrained (exhibiting an average of ≤ 15 licks per 5 sec trial in the lick preference assay), and supplied with approximately 5-μl water during each trial. To measure aversion, mice were water-deprived for 24 hours, and supplied with approximately 10-μl water distributed over the full five seconds of spout presentation for each trial (so that animals remain eager to lick for all five seconds). To ensure animals were appropriately motivated in the lick preference behavioral assays (i.e. thirsty to examine lick suppression, and mildly satiated to examine attraction), we examined animals exhibiting an average of ≥ 20 licks per 5 sec trial as an indicator of “thirst”, and ≤ 15 licks per 5 sec trial for mild satiation. Animals were video recorded for the entire session, and licks were analyzed and counted by custom-written MATLAB software (Mathworks). Light stimulation and water delivery were controlled by the same software via an arduino board (Arduino, Italy). All animals analyzed in these studies had histologically confirmed expression of ChR2 in the sweet or bitter cortical fields (Supplementary Table 1).
Go/no-go taste discrimination behavior
Mice deprived of water for 24 hours were first acclimated to consuming water in a head-restrained position for 15-min sessions over 2–3 days. Animals were then trained to perform a taste discrimination task, in which they were to lick, and receive a water reward, in response to a 2 μl presentation of tastant-1 (“go”) and to withhold licking in response to tastant-2 (“no-go”). The presentation of the go and no-go stimuli was randomized. Each trial began with a visual cue (100 msec light flash), followed 1 sec later by a tone (4k Hz, 300 msec) alerting the animal to sample the test tastant (e.g. AceK or quinine; ~2μl per sample). After sampling, mice were given 3 sec to either continue to lick the spout (go trial) or withhold licking (no-go trials). On go trials, if a mouse chose to lick within the 3 sec interval, it was then rewarded with water for 3 sec. On no-go trials, if a mouse failed to withhold licking within the 3 sec interval, it was given a penalty of a gentle air puff to the eyelid. Mice were trained for 2 sessions per day, with 80 randomized trials (20 min) per session. A “go” response was defined as 4 or more licks in the second before reward or penalty. For photostimulation experiments, mice were first trained until they could effectively discriminate the tastants with ~90% accuracy (over 1–2 weeks). Then, on the “probe” sessions, tastants and/or cortical photostimulation were presented during the sample period. Neither reward nor punishment was delivered for novel tastants or light stimulation. Prior to testing, animals with correctly placed cannulas were provisionally identified by ChR2 expression followed by 1–2 sessions of lick preference pre-tests. All animals analyzed had histologically confirmed placement of cannulae and expression of ChR2 in the appropriate cortical field.
Pharmacological inhibition
Mice were trained to discriminate sweet from bitter in the go/no-go task with at least 90% accuracy. On the day of the experiment, mice were first tested with four taste stimuli (pre-test), including the original training tastants (2 mM AceK and 0.1 mM quinine) and a novel sweet and bitter tastant (50 mM sucrose and 2 μM cycloheximide). Following the test, 0.3 μl of the glutamate receptor antagonist NBQX (5 mg/ml in 0.9% NaCl, Tocris Bioscience, Bristol, UK) was bilaterally infused into the chosen insular cortical fields over a period of 3 minutes. NBQX was delivered via an internal infusion needle inserted into the same guide cannulae used for light stimulation and connected to a 1 μl Hamilton syringe (PlasticsOne, Roanoke, VA). Saline (0.9% NaCl) was used as control. After NBQX or saline infusion, animals were placed in their home cages to rest for 1.5 hours. Mice were then re-tested with the same four taste stimuli on the go/no-go task (NBQX-test) and then at 8–24 hours after rest (recovery-test). During tests, a water reward was given for correctly identifying the go cue, but no air puff was delivered for incorrectly identifying the no-go cue (to avoid possible re-learning). No reward or punishment was applied for the novel sweet and bitter tastants. A performance ratio was calculated for each taste quality: ratio = r1/r2, where r1 is the percentage of correct responses during the NBQX-test or recovery-test, and r2 is the percentage of correct responses during the pre-test. The percentage of correct responses for each taste quality is the average of %Go for go taste stimuli (e.g. quinine and cycloheximide), or the difference between [100-%Go] for no-go stimuli (e.g. AceK and sucrose). All animals analyzed had anatomically confirmed placement of cannulas in the appropriate cortical field. We note that we made several unsuccessful attempts to optogenetically silence the sweet and bitter cortical fields; this may be due in part to the requirement for expression in most, if not all relevant neurons.
Extended Data
Extended Data Figure 1. Expression of ChR2 in taste cortex.

a), samples of injection sites in the bitter and sweet cortical fields; shown are coronal sections (Fig. 1a shows a whole mount brain). ChR2-YFP expression (green), nuclei (blue; TO-PRO-3); numbers indicate position relative to bregma, and the dotted area highlight the location of the taste cortical fields (see panel c). (b), Activation of insular neurons in sweet cortex triggers robust c-Fos expression; ChR2-YFP (green), c-Fos (red) after 10 min of in vivo photostimulation at 20 Hz, 20-ms pulses (5 sec laser on, 5 sec laser off, 5 mW). Dashed lines indicate the location of the stimulating cannulae/fiber. (c), c-Fos (red) expression in bitter cortex (bregma 0, −0.2) following bitter tastant stimulation (10 mM quinine; see Methods for details). Note the absence of c-Fos expression in the middle (bregma +0.7) and sweet insular cortex (bregma +1.5). Importantly, specific labeling is abolished in taste blind animals (TrpM5 knockouts; middle row). The bottom row shows a diagram of the corresponding brain areas, adapted from the Allen Brain Atlas. Scale bars: 1 mm (a), 500 μm (b), 300 μm (c). PIR refers to piriform cortex and IC refers to insular cortex
Extended Data Figure 2. Acquisition of Place preference.

a, The graph shows the development of “place preference” as a function of session number (each session was 30 min of training and 5 min of “after-training” testing in the absence of light stimulation; n = 13 for sweet cortex, n = 15 for bitter cortex; see text and Methods for details). The average of sessions 6–8 were used in Fig. 1. Values are mean ± s.e.m. b, Representative mouse track and quantitation of preference index in control GFP-expressing mice; note no difference in preference between chambers (n = 14; Mann-Whitney U test, P = 0.74). Values are mean ± s.e.m.
Extended Data Figure 3. Photostimulation of insular cortical fields overcomes natural taste valence.

a, Quantitation of licking responses in mice expressing ChR2 in the bitter cortical fields (n = 13, ANOVA test, Tukey’s HSD post hoc). Photostimulation of the bitter cortical fields significantly suppress the natural attraction of the sweet tastant (4 mM AceK). b, Quantitation of licking responses in mice expressing ChR2 in the sweet cortical fields (n = 14, ANOVA test, Tukey’s HSD post hoc). Photostimulation of the sweet cortical fields significantly overcomes the natural aversion of the bitter tastant (1 mM quinine). In both experiments, mice were mildly water-restrained (exhibiting an average of ≤ 30 licks per 5-sec water trial) such that they were motivated to drink the bitter and while showing attraction to sweet. Values are mean ± s.e.m.
Extended Data Figure 4. TrpM5 knockout mice do not taste sweet and bitter.

Taste preference was tested in the head-restrained assay for wild type and TRPM5 homozygous mutants. Tastants were randomly delivered for a 5-sec window (10 trials/each). No significant difference was observed between water and sweet/bitter tastants in TRPM5 knockouts (ANOVA test, P = 0.62, n = 10; see ref 10 for more details); circles indicate individual animals, and the bar graphs show mean ± s.e.m.
Extended Data Figure 5. Inactivation of the bitter cortical fields in animals trained to go to bitter and no-go to sweet.

a, Quantitation of performance ratios before and after bilateral silencing of the bitter cortical fields (NBQX, 5 mg/ml; n = 7) in animals trained to go to bitter and no-go to sweet. Note the impact in bitter taste discrimination, but no significant effect in sweet taste (Mann-Whitney U test, P < 0.002). After washout of the drug, the animal’s ability to recognize bitter is restored (Mann-Whitney U test, P < 0.005). b, Quantitation of performance ratios with saline (0.9%) control in the bitter cortical fields (n = 6, Mann-Whitney U test, P = 0.56). In both experiments, mice were trained with quinine and AceK, and tested with two pairs of sweet/bitter tastants (0.1 mM quinine and 2 mM AceK, 2 μM cycloheximide and 50 mM sucrose; see Methods for details).
Extended Data Figure 6. Sweet and low salt are appetitive tastants.

Taste preference was tested during a 10-min window using the head-restrained assay (see Methods for details). Four tastants were randomly delivered to animals for 5-sec each (10 trials per tastant) . Note that animals show significant attraction to sweet (AceK) and low salt (NaCl), but strong aversion to bitter (n = 11, ANOVA test, Tukey’s HSD post hoc); circles indicate individual animals, and the bar graphs show mean ± s.e.m. These conditions were used in the experiments described in Fig 5 and Extended Data Fig. 7.
Extended Data Figure 7. Cross-generalization between orally supplied taste stimuli and photostimulation of the bitter cortex.

a, Representative histograms illustrating cross-generalization between taste stimulation and photostimulation of the bitter cortical field. The mouse was trained to go to bitter (0.5 mM quinine) and no-go to sweet (4 mM AceK) and low-salt (20 mM NaCl). b, Quantitation of the responses from individual animals to quinine, AceK, salt and salt + light (n = 8, Mann-Whitney U test, P < 0.002). See also Fig 4.
Supplementary Material
Supplementary Video 1: Behavioral responses to bitter cortex stimulation.
A mouse expressing ChR2-YFP in the bitter cortex before and after photostimulation: First trial, control experiment with the animal robustly drinking water (yellow circle indicates trial-initiation). Second trial shows prototypical orofacial responses (normally triggered by oral presentation of bitter tastants), now elicited by direct stimulation of bitter cortex (5–10 mW). Third trial shows gaping responses, and attempts to clean the mouth of the “fictive” bitter taste following strong stimulation (10–20 mW); note that the animal does not even sample the water drop; under these stimulating conditions ~30% of the animals exhibit gagging behavior. Stimulation of sweet cortex never induced such behavior.
Supplementary Table 1: Coordinates of the injection and cannulation sites.
Acknowledgments
We particularly thank Hershy Fischman and Ryan Lessard for suggestions, and members of the Zuker lab for helpful comments. We also thank Dan Salzman, Kristin Scott, and Richard Axel for valuable discussions. This research was supported in part by a grant from the National Institute of Drug Abuse (DA035025) to C.S.Z, and the Intramural Research Program of the NIH, NIDCR, (N.J.P.R.). C.S.Z. is an investigator of the Howard Hughes Medical Institute and a Senior Fellow at Janelia Farms Research Campus, HHMI.
Footnotes
Author Contributions
Y.P. designed the study, carried out experiments, and analyzed data; S.G-S. performed animals studies, viral injections, histology and analyzed data; H.J. performed c-Fos expression studies; D.T. developed our initial behavioral platforms; N.J.P.R. and C.S.Z. designed the study, analyzed data and together with Y.P. wrote the paper.
References
- 1.Lindemann B. Receptors and transduction in taste. Nature. 2001;413:219–225. doi: 10.1038/35093032. [DOI] [PubMed] [Google Scholar]
- 2.Yamamoto T. Taste responses of cortical neurons. Prog Neurobiol. 1984;23:273–315. doi: 10.1016/0301-0082(84)90007-8. [DOI] [PubMed] [Google Scholar]
- 3.Accolla R, Bathellier B, Petersen CC, Carleton A. Differential spatial representation of taste modalities in the rat gustatory cortex. J Neurosci. 2007;27:1396–1404. doi: 10.1523/JNEUROSCI.5188-06.2007. [DOI] [PMC free article] [PubMed] [Google Scholar]
- 4.Chen X, Gabitto M, Peng Y, Ryba NJ, Zuker CS. A gustotopic map of taste qualities in the mammalian brain. Science. 2011;333:1262–1266. doi: 10.1126/science.1204076. [DOI] [PMC free article] [PubMed] [Google Scholar]
- 5.Boyden ES, Zhang F, Bamberg E, Nagel G, Deisseroth K. Millisecond-timescale, genetically targeted optical control of neural activity. Nat Neurosci. 2005;8:1263–1268. doi: 10.1038/nn1525. [DOI] [PubMed] [Google Scholar]
- 6.Lammel S, et al. Input-specific control of reward and aversion in the ventral tegmental area. Nature. 2012;491:212–217. doi: 10.1038/nature11527. [DOI] [PMC free article] [PubMed] [Google Scholar]
- 7.Halpern BP. Drinking behavior. Springer; 1977. Functional anatomy of the tongue and mouth of mammals; pp. 1–92. [Google Scholar]
- 8.Guo ZV, et al. Procedures for behavioral experiments in head-fixed mice. PloS one. 2014;9:e88678. doi: 10.1371/journal.pone.0088678. [DOI] [PMC free article] [PubMed] [Google Scholar]
- 9.Grill HJ, Norgren R. The taste reactivity test. I. Mimetic responses to gustatory stimuli in neurologically normal rats. Brain research. 1978;143:263–279. doi: 10.1016/0006-8993(78)90568-1. [DOI] [PubMed] [Google Scholar]
- 10.Zhang Y, et al. Coding of sweet, bitter, and umami tastes: different receptor cells sharing similar signaling pathways. Cell. 2003;112:293–301. doi: 10.1016/s0092-8674(03)00071-0. [DOI] [PubMed] [Google Scholar]
- 11.Grill HJ, Norgren R. The taste reactivity test. II. Mimetic responses to gustatory stimuli in chronic thalamic and chronic decerebrate rats. Brain research. 1978;143:281–297. doi: 10.1016/0006-8993(78)90569-3. [DOI] [PubMed] [Google Scholar]
- 12.Reilly S, Pritchard TC. Gustatory thalamus lesions in the rat: I. Innate taste preferences and aversions. Behavioral neuroscience. 1996;110:737–745. doi: 10.1037//0735-7044.110.4.737. [DOI] [PubMed] [Google Scholar]
- 13.Gardner MP, Fontanini A. Encoding and tracking of outcome-specific expectancy in the gustatory cortex of alert rats. J Neurosci. 2014;34:13000–13017. doi: 10.1523/JNEUROSCI.1820-14.2014. [DOI] [PMC free article] [PubMed] [Google Scholar]
- 14.Graham DM, Sun C, Hill DL. Temporal signatures of taste quality driven by active sensing. J Neurosci. 2014;34:7398–7411. doi: 10.1523/JNEUROSCI.0213-14.2014. [DOI] [PMC free article] [PubMed] [Google Scholar]
- 15.Li X, et al. Human receptors for sweet and umami taste. Proc Natl Acad Sci USA. 2002;99:4692–4696. doi: 10.1073/pnas.072090199. [DOI] [PMC free article] [PubMed] [Google Scholar]
- 16.Nelson G, et al. Mammalian sweet taste receptors. Cell. 2001;106:381–390. doi: 10.1016/s0092-8674(01)00451-2. [DOI] [PubMed] [Google Scholar]
- 17.Zhao GQ, et al. The receptors for mammalian sweet and umami taste. Cell. 2003;115:255–266. doi: 10.1016/s0092-8674(03)00844-4. [DOI] [PubMed] [Google Scholar]
- 18.Mueller KL, et al. The receptors and coding logic for bitter taste. Nature. 2005;434:225–229. doi: 10.1038/nature03352. [DOI] [PubMed] [Google Scholar]
- 19.Calu DJ, Roesch MR, Haney RZ, Holland PC, Schoenbaum G. Neural correlates of variations in event processing during learning in central nucleus of amygdala. Neuron. 2010;68:991–1001. doi: 10.1016/j.neuron.2010.11.019. [DOI] [PMC free article] [PubMed] [Google Scholar]
- 20.Tye KM, et al. Amygdala circuitry mediating reversible and bidirectional control of anxiety. Nature. 2011;471:358–362. doi: 10.1038/nature09820. [DOI] [PMC free article] [PubMed] [Google Scholar]
- 21.Small DM, et al. Dissociation of neural representation of intensity and affective valuation in human gustation. Neuron. 2003;39:701–711. doi: 10.1016/s0896-6273(03)00467-7. [DOI] [PubMed] [Google Scholar]
- 22.Spector AC, Travers SP. The representation of taste quality in the mammalian nervous system. Behav Cogn Neurosci Rev. 2005;4:143–191. doi: 10.1177/1534582305280031. [DOI] [PubMed] [Google Scholar]
- 23.Simon SA, de Araujo IE, Gutierrez R, Nicolelis MA. The neural mechanisms of gustation: a distributed processing code. Nat Rev Neurosci. 2006;7:890–901. doi: 10.1038/nrn2006. [DOI] [PubMed] [Google Scholar]
- 24.Witten IB, et al. Cholinergic interneurons control local circuit activity and cocaine conditioning. Science. 2010;330:1677–1681. doi: 10.1126/science.1193771. [DOI] [PMC free article] [PubMed] [Google Scholar]
- 25.Choi GB, et al. Driving opposing behaviors with ensembles of piriform neurons. Cell. 2011;146:1004–1015. doi: 10.1016/j.cell.2011.07.041. [DOI] [PMC free article] [PubMed] [Google Scholar]
- 26.Atasoy D, Betley JN, Su HH, Sternson SM. Deconstruction of a neural circuit for hunger. Nature. 2012;488:172–177. doi: 10.1038/nature11270. [DOI] [PMC free article] [PubMed] [Google Scholar]
- 27.Nieh EH, et al. Decoding Neural Circuits that Control Compulsive Sucrose Seeking. Cell. 2015;160:528–541. doi: 10.1016/j.cell.2015.01.003. [DOI] [PMC free article] [PubMed] [Google Scholar]
- 28.Tokita K, Armstrong WE, St John SJ, Boughter JD., Jr Activation of lateral hypothalamus-projecting parabrachial neurons by intraorally delivered gustatory stimuli. Front Neural Circuits. 2014;8:86. doi: 10.3389/fncir.2014.00086. [DOI] [PMC free article] [PubMed] [Google Scholar]
Associated Data
This section collects any data citations, data availability statements, or supplementary materials included in this article.
Supplementary Materials
Supplementary Video 1: Behavioral responses to bitter cortex stimulation.
A mouse expressing ChR2-YFP in the bitter cortex before and after photostimulation: First trial, control experiment with the animal robustly drinking water (yellow circle indicates trial-initiation). Second trial shows prototypical orofacial responses (normally triggered by oral presentation of bitter tastants), now elicited by direct stimulation of bitter cortex (5–10 mW). Third trial shows gaping responses, and attempts to clean the mouth of the “fictive” bitter taste following strong stimulation (10–20 mW); note that the animal does not even sample the water drop; under these stimulating conditions ~30% of the animals exhibit gagging behavior. Stimulation of sweet cortex never induced such behavior.
Supplementary Table 1: Coordinates of the injection and cannulation sites.