

ABSTRACT
Cell surface area rapidly increases during mechanical and hypoosmotic stresses. Such expansion of the plasma membrane requires ‘membrane reservoirs' that provide surface area and buffer membrane tension, but the sources of this membrane remain poorly understood. In principle, the flattening of invaginations and buds within the plasma membrane could provide this additional surface area, as recently shown for caveolae in animal cells. Here, we used microfluidics to study the rapid expansion of the yeast plasma membrane in protoplasts, which lack the rigid cell wall. To survive hypoosmotic stress, yeast cell protoplasts required eisosomes, protein-based structures that generate long invaginations at the plasma membrane. Both budding yeast and fission yeast protoplasts lacking eisosomes were unable to expand like wild-type protoplasts during hypoosmotic stress, and subsequently lysed. By performing quantitative fluorescence microscopy on single protoplasts, we also found that eisosomes disassembled as surface area increased. During this process, invaginations generated by eisosomes at the plasma membrane became flattened, as visualized by scanning electron microscopy. We propose that eisosomes serve as tension-dependent membrane reservoirs for expansion of yeast cells in an analogous manner to caveolae in animal cells.
KEY WORDS: Yeast, Eisosome, Plasma membrane, Protoplast, Microfluidics, S. pombe
Highlighted Article: During membrane stretching in yeast protoplasts, eisosomes disassemble to release membrane invaginations and to facilitate surface area expansion.
INTRODUCTION
The plasma membrane forms a continuous barrier between a cell and its environment. During mechanical and hypoosmotic stress, the surface area of a cell increases, which requires rapid expansion of the plasma membrane. Biophysical studies have defined the mechanical properties of a ‘membrane reservoir’, which provides the needed surface area in response to increased tension at the plasma membrane (Gauthier et al., 2012; Morris and Homann, 2001; Raucher and Sheetz, 1999). The source(s) of this reservoir must be cellular membrane compartments, but their precise identity has been unclear. Mathematical modeling has revealed that plasma membrane invaginations, formed by proteins and protein complexes, have the potential to serve as mechanosensing membrane reservoirs (Sens and Turner, 2006). The plasma membrane contains such structures in the form of buds, wrinkles, folds and ruffles; this suggests that the source of material for expansion might already be present near the cell periphery.
In animal cells, this concept has been shown experimentally for plasma membrane invaginations that are formed by caveolae. Under acute mechanical or osmotic stress, caveolae coat proteins disassemble and are released from the plasma membrane (Sinha et al., 2011). This disassembly leads to the flattening of membrane invaginations, thus providing surface area and reducing membrane tension. Caveolae are present in some cell types, such as endothelial cells and adipocytes, but most cell types lack caveolae (Parton and del Pozo, 2013). More broadly, caveolae are not conserved in all eukaryotes; for example, fungal cells do not have caveolae. Thus, the source of membrane reservoirs in cells lacking caveolae is unknown.
In yeast cells, the rigid cell wall acts as the primary defense mechanism against cell lysis during dramatic changes in osmolarity (Hohmann, 2002; Orlean, 2012). However, the cell wall can become damaged by natural toxins, or weakened during stages of growth and differentiation. Furthermore, yeast cells are under extreme internal turgor pressure, which might require multiple mechanisms to buffer membrane tension and prevent cell lysis. The yeast plasma membrane contains dramatic buds and invaginations that have been observed at the ultrastructural level, and possess the potential to act as membrane reservoirs (Moor and Muhlethaler, 1963; Rodal et al., 2005; Streiblova, 1968; Takeo, 1985; Walther et al., 1984). Most strikingly, protein-based structures called eisosomes generate elongated invaginations along the yeast plasma membrane (Karotki et al., 2011; Stradalova et al., 2009). Eisosome-like invaginations are found in a wide range of fungal and algal cells despite divergent molecular components (Lee et al., 2015), suggesting that eisosome function might be intricately linked to this topology. The primary component of yeast eisosomes is the BAR domain protein Pil1, which directly binds lipids at the membrane to generate invaginations (Kabeche et al., 2011, 2014; Karotki et al., 2011; Moreira et al., 2009; Olivera-Couto et al., 2011; Stradalova et al., 2009; Ziółkowska et al., 2011). Recent studies have linked eisosome function with the control of signaling pathways (Berchtold et al., 2012; Frohlich et al., 2014; Kabeche et al., 2014), but we noted that their architecture possesses the capacity to act as a membrane reservoir. Here, we devised a single-cell assay to observe rapid expansion of the yeast plasma membrane in the absence of a cell wall and found that eisosomes display properties that suggest they act as membrane reservoirs that are required for increases in cell surface area.
RESULTS AND DISCUSSION
We established a microfluidics-based single-cell assay to determine whether yeast cells possess a membrane reservoir for rapid surface area expansion. Briefly, the cell wall was digested with enzymes, and the resulting protoplasts were loaded into a microfluidics device in medium containing 1.2 M sorbitol for osmotic support. To focus on mechanical expansion as opposed to active cell growth, we used medium lacking glucose. We then decreased the sorbitol concentration in a step-wise manner to induce hypoosmotic stress and cell expansion (see Materials and Methods for full description). As the sorbitol concentration decreased, wild-type cells became larger (Fig. 1A).
Fig. 1.

Eisosomes are required for cell survival upon hypoosmotic shock. (A) Example of a time-lapse experiment in a microfluidic device for wild-type and pil1Δ protoplasts. Hypoosmotic stress was induced by decreasing the sorbitol concentration. The wild-type strain has a Pil1–mCherry tag to distinguish it from pil1Δ. Scale bar: 5 μm. (B) Kaplan–Meir survival curve of protoplasts during hypoosmotic stress. Dotted vertical lines signify the switch in sorbitol concentrations, which are labeled at the top. n=150 cells for each strain. Log-rank test, P<0.001.
Both eisosomes and the resulting membrane invaginations that are present in yeast cells have previously been shown to remain in protoplasts lacking a cell wall (Kabeche et al., 2011; Osumi et al., 1995; Streiblova, 1968). If the membrane invaginations formed by eisosomes act as membrane reservoirs, then their absence would be expected to impact on the survival and expansion of protoplasts during hypoosmotic stress. Thus, we compared the survival of wild-type cells versus pil1Δ mutant cells, which lack eisosomes, in our assay. Protoplasts from these strains were mixed and imaged together, with a Pil1–mCherry tag distinguishing wild-type from pil1Δ cells (Fig. 1A). We calculated the survival of each strain during increasing hypoosmotic stress (Fig. 1B). Approximately half of the wild-type cells survived in 0.4 M sorbitol, and 31% survived through to concentrations of 0.2 M sorbitol. By contrast, pil1Δ cells displayed a striking reduction in viability during hypoosmotic stress (P<0.001 by log-rank test), with most pil1Δ cells lysing in 0.8 M sorbitol. Similar results were obtained when glucose was present during hypoosmotic shock, when protoplasts are actively growing (Fig. S1A,B). No cells lysed during control isotonic medium switches (Fig. S1C,D), meaning there is no effect from pressure changes induced by the microfluidics device. Pil1 functions with the protein Sle1, which localizes to eisosomes and is required for proper eisosome assembly (Kabeche et al., 2014; Moreira et al., 2012). sle1Δ protoplasts displayed a similar defect in protoplast survival, and no additive defects were observed in pil1Δ sle1Δ double mutants (Fig. S1E). Taken together, these results indicate that eisosomes promote protoplast survival during hypoosmotic stress.
We next tested the contribution of eisosomes to the increase in cell size. In movies taken during hypoosmotic stress, pil1Δ protoplasts did not expand as much as wild type (Fig. 2A). To quantify this expansion, we measured the cell surface area before and after hypoosmotic shock (Fig. 2B). Prior to hypoosmotic shock, the size of wild type and pil1Δ protoplasts did not differ significantly (99.4±10.1 µm2 for wild type, 103.3±11.7 µm2 for pil1Δ; mean±s.d. of 50 cells measured for each strain; P=0.284 by unpaired Student's t-test). During the shock, the surface area of wild-type cells increased by 55.7±12.3 µm2, but pil1Δ mutants only increased by 17.8±9.3 µm2 prior to lysis, indicating a reduced capacity for surface area expansion (Fig. 2B). We conclude that eisosomes are required for the expansion and survival of fission yeast protoplasts. To determine whether this is a conserved feature of eisosomes, we also tested their role in the hypoosmotic expansion of the budding yeast Saccharomyces cerevisiae membrane. We generated budding yeast protoplasts, and observed reduced viability and expansion of pil1Δ protoplasts compared to that in wild-type cells (Fig. S2A–C). Thus, eisosomes provide a conserved mechanism for a rapid increase in cell size.
Fig. 2.

Plasma membrane expansion requires eisosomes. (A) Time-lapse imaging of wild-type (labeled with Pil1–mCherry) and pil1Δ protoplasts in decreasing sorbitol concentrations. Circles indicate the starting circumference for reference of the change in cell size. Scale bar: 5 μm. (B) Bar graph of mean±s.d. surface area of cells pre-shock and post-shock. n=50 cells for each strain.
In budding yeast, eisosomes control a signaling response to membrane stress through the eisosome protein Slm1 (Berchtold et al., 2012). We tested the role of Slm1 in rapid membrane expansion. In contrast to the results in budding yeast, we found that fission yeast Slm1 did not colocalize with eisosomes, even under hyperosmotic or hypoosmotic stress (Fig. S3A, see also Kabeche et al., 2011). Rather, Slm1 localized to the cell tips and to cortical puncta that did not clearly overlap with eisosomes. Removal of eisosomes in pil1Δ did not affect Slm1 localization (Fig. S3B). In enlarging protoplasts, Slm1 formed cortical puncta that did not colocalize with eisosomes and were not dependent on eisosomes (Fig. S3C,D). Finally, slm1Δ protoplasts survived hypoosmotic expansion similar to wild-type protoplasts (Fig. S3E). Therefore, eisosomes promote rapid expansion of both budding yeast and fission yeast protoplast membrane, but our experiments in fission yeast indicate that the mechanism does not involve Slm1.
We next addressed the mechanism by which eisosomes promote an increase in cellular size. In animal cells, caveolae disassemble to release membrane invaginations for this cellular expansion. Pil1 generates similar invaginations by forming static filaments at the plasma membrane of yeast cells. We used endogenously tagged Pil1–mCherry to image eisosomes in fission yeast protoplasts during hypoosmotic shock. As the sorbitol concentration decreased and cells became larger, we observed a striking loss of Pil1 filaments at the cell cortex (Fig. 3A). This effect was not due to photobleaching, as no filament loss was observed in control isotonic conditions (Fig. 3A). This raises the possibility that disassembly of eisosomes accompanies expansion of cell surface area.
Fig. 3.

Eisosomes disassemble during rapid cell expansion. (A) Time-lapse microscopy of Pil1–mCherry in protoplasts in hypoosmotic (top) or isotonic (bottom) conditions. Images are inverted maximum projections from serial z-sections in the top half of cells. Note the loss of Pil1 filaments during cell expansion. Scale bars: 5 μm. (B) Quantification of fluorescence intensity (left axis; afu, arbitrary fluorescence units) and circumference (right axis) for individual Pil1–mCherry cells during hypoosmotic or isotonic stress. Additional examples are provided in Fig. S4. Both fluorescence and circumference were measured on single focal planes.
We used single-focal-plane movies to quantify the connection between Pil1 filament disassembly and cell membrane expansion (Fig. S4A). We measured both the cell circumference and Pil1–mCherry fluorescence at the cell cortex for single cells during hypoosmotic stress. Remarkably, loss of Pil1 filaments from the cell cortex always coincided with a rapid increase in cell circumference (Fig. 3B; Fig. S4B). By contrast, eisosomes did not disassemble and cells did not expand during isotonic medium switches (Fig. 3B). Thus, cells rapidly disassemble eisosomes upon hypoosmotic stress.
Finally, we observed the ultrastructure of the plasma membrane during hypoosmotic cell expansion. If the eisosome-generated membrane invaginations serve as a membrane reservoir for rapid expansion, these invaginations are predicted to flatten during hypoosmotic stress. We tested this model in our protoplast system using scanning electron microscopy (Fig. 4; Fig. S4C). Prior to hypoosmotic stress, we observed pronounced invaginations at the plasma membrane of wild-type fission yeast protoplasts. These invaginations were absent in pil1Δ mutant protoplasts, consistent with previous results from budding yeast freeze-fracture studies (Stradalova et al., 2009). When wild-type protoplasts were subjected to hypoosmotic stress, we observed a striking loss of eisosome-dependent invaginations. In rare cases, we still observed some invaginations after hypoosmotic stress (Fig. S4C), but these structures were largely abolished during the increase in cell size. Thus, Pil1 filament disassembly translates to a flattening of membrane invaginations during cell expansion.
Fig. 4.

Flattening of eisosome-dependent membrane invaginations during hypoosmotic stress. All images are scanning electron micrographs for single protoplasts. Left, wild-type cell prior to hypoosmotic stress; membrane invaginations are highlighted by arrows. Middle, wild-type cell after hypoosmotic stress. Right, pil1Δ protoplast lacking membrane invaginations. Boxed areas in the upper panels are magnified in the lower panels. Scale bars: 500 nm (upper panels); 250 nm (lower panels).
We have presented four lines of evidence that identify eisosomes as membrane reservoirs at the yeast plasma membrane. First, eisosomes are required to prevent the lysis of protoplasts during hypoosmotic stress. Second, cells containing eisosomes increase surface area more than cell lacking eisosomes. Third, eisosomes disassemble from the plasma membrane as cell surface area increases. Fourth, eisosome disassembly releases invaginations at the plasma membrane. These results suggest a simple model, whereby increased membrane tension during hypoosmotic stress triggers eisosome disassembly, which releases membrane invaginations to promote cell expansion and to reduce membrane tension.
We estimate that the surface area of wild-type protoplasts grows 56 µm2 on average in our microfluidics assay, but pil1Δ protoplasts still retain the ability to expand 18 µm2. This indicates the existence of additional, as yet unidentified, membrane reservoirs for the expansion of the yeast plasma membrane. These reservoirs might include additional ultrastructural components of the plasma membrane, including endocytic actin patches, or alternative internal membrane sources, such as the endoplasmic reticulum or endosomes. We estimate that flattening of eisosome-dependent invaginations would contribute ∼5.3 µm2 to protoplast surface area during expansion (see Materials and Methods for calculations). This suggests that eisosomes play additional roles in facilitating membrane expansion, potentially through other membrane reservoirs and/or signaling pathways.
We have used protoplasts to establish the principle of membrane reservoirs in the yeast plasma membrane. The role of this mechanism in the presence of an intact cell wall remains a key question for the future. Hypoosmotic stress did not induce eisosome disassembly in cells with a fully intact cell wall (Fig. S4D), but we estimate that these cells only increase in surface area ∼10 µm2 under these conditions due to the cell wall barrier. We speculate that this eisosome-dependent mechanism could be important under conditions – pathological or developmental – that weaken the stiffness of the cell wall. Identifying such conditions and their link with eisosome regulation represents a key future challenge. We note that many unexpected aspects of bacterial cell biology have emerged from so-called L-form growth, which entails removal of the cell wall and osmotic stabilization (Allan, 1991; Errington, 2013; Mercier et al., 2014). Similar insights into yeast cell biology might be uncovered from continued work on protoplasts and conditions that weaken the cell wall.
Our findings reveal a remarkable similarity between yeast eisosomes and animal caveolae, which share a similar geometry despite having completely distinct protein components. Both protein-based structures generate inward-facing membrane curvature at the plasma membrane and disassemble during osmotic stretch in cells. These similar behaviors provide experimental support for the principle that multi-protein structures generate membrane reservoirs through the assembly of ultrastructural buds and invaginations (Sens and Turner, 2006). Both caveolae and eisosomes only generate a fraction of the total surface area expansion, meaning that additional membrane reservoirs are present in both yeast and animal cells (Gauthier et al., 2012; Mayor, 2011; Sinha et al., 2011). In addition to their mechanical role as membrane reservoirs, caveolae and eisosomes also regulate signaling pathways (Berchtold et al., 2012; Frohlich et al., 2014; Kabeche et al., 2014; Parton and del Pozo, 2013; Shvets et al., 2014). Thus, an interesting future direction will be to determine how these signaling and mechanical functions might be connected. The ultrastructure of eisosomes and caveolae might have evolved to facilitate their roles as signaling hubs, and then been coopted by cells to act as membrane reservoirs. Alternatively, their geometry might reflect a primitive role in the facilitation of cell membrane expansion. The presence of eisosome invaginations in algal species that lack genes for fungal eisosome proteins supports a conserved role for this geometry despite differences in molecular composition (Lee et al., 2015). Quantitative and comparative studies of these structures have the potential to illuminate their ancestral origins, as well as general cellular approaches for controlling the continuous, dynamic plasma membrane.
MATERIALS AND METHODS
Yeast strains and methods
Standard Schizosaccharomyces pombe methods and media were used. Strains in this study were JM366 (972 h-), JM1243 (pil1Δ::natR h-), JM1262 (pil1-mCherry::natR h-), JM1341 (slm1-mEGFP::kanMX6 h-), JM1362 (slm1-mEGFP::kanMX6 pil1-mcherry::natR), JM1363 (slm1-mEGFP::kanMX6 pil1Δ::natR), JM1457 (sle1Δ::natR h-), JM3741 (pil1Δ::natR sle1Δ::kanMX6), JM3742 (slm1Δ::kanMX6), JM_Sc4 (MAT-a pil1Δ::NAT,LSP1-mCherry::KANMX4 his320, leu2-3,112 ura3-52 lys2-801) and JM_Sc10 (MATa his320, leu2-3,112 ura3-52 lys2-801).
Protoplast formation
Protoplasts were generated by washing log-phase cells into 50 ml of 5 mM citrate phosphate buffer (7.1 g/l Na2HPO4 and 11.5 g/l citric acid, pH 5.6) with 1.2 M sorbitol three times at 376 g for 5 min. Cells were then incubated in 500 μl of the same buffer containing 10 μl zymolyase (zymolyase 100T, in water 10 mg/ml) and 25 μl novozyme (lysing enzymes from Trichoderma harzianum, Sigma, #L1412, in water 25 mg/ml). Cells were incubated at 37°C with shaking for 30–60 min. Cells were checked every 10 min for 90% digestion, and the absence of cell wall was confirmed by blankophor staining. Once digestion was complete, cells were washed three times by centrifugation at 376 g for 5 min, resuspensed in 10 ml EMM-Glucose with 1.2 M sorbitol and cell wall digestion enzymes and then inverted to mix. The resulting pellet was resuspended and washed twice in 1 ml of EMM-Glucose with 1.2 M sorbitol and containing cell wall digestion enzymes. In wild-type and pil1Δ experiments, pellets were combined and resuspended in 500 μl of EMM-Glucose with 1.2 M sorbitol and containing cell wall digestion enzymes for imaging in the microfluidics device.
Imaging
Cells were imaged in a CellASIC ONIX Microfluidics Plate using a Deltavision Imaging System (Applied Precision, GE), comprising a customized Olympus IX-71 inverted wide-field microscope, a Photometrics CoolSNAP HQ2 camera and an Insight solid state illumination unit. Images were either single focal planes or were captured as z-series and processed by iterative deconvolution in SoftWoRx (Applied Precision, GE) and then analyzed in ImageJ (National Institutes of Health). Maximum intensity projections were generated using 0.2-μm z-stacks at the top cortex of cell.
After protoplast formation, protoplasts were loaded into a microfluidic flow cell in 1.2 M sorbitol medium containing enzymes in Y04C CellASIC ONIX plates (Millipore). Before loading cells into the imaging chamber of the flow cell, the chamber was primed with 1.2 M sorbitol medium containing enzymes using the ONIX microfluidic perfusion platform (Millipore). Protoplasts were loaded into the viewing chamber at 5 psi for 5–10 s. To ensure that cells were at a steady state, cells were incubated for 2 h in the viewing chamber with fresh medium containing 1.2 M sorbitol and cell wall digestion enzymes before introducing osmotic shock. During osmotic shock, the medium in the flow cell was exchanged using the ONIX system at 1 psi every 5 min. Each step introduced a 0.2 M decrease in sorbitol concentration. At these settings, we estimate a 1-min lag for the new medium to reach the cells. This estimate is based on a visible increase in the size of the cells, as well as our other experience with the microfluidics system. In control ‘isotonic’ experiments, the identical program was used but all media contained 1.2 M sorbitol. This was performed to ensure that protoplasts do not expand or lyse upon switching the media chamber itself. Time points were acquired using the Deltavision Imaging System described above with UltimateFocus.
For experiments with cells containing a cell wall, cells were loaded into a microfluidic flow cell in 1.2 M sorbitol medium in Y04C CellAsic ONIX plates (CellASIC). Before loading cells into the imaging chamber of the flow cell, the chamber was primed with 1.2 M sorbitol medium using the ONIX microfluidic perfusion platform (CellASIC). Cells were loaded into the viewing chamber at 8 psi for 5–10 s. To ensure that cells were at a steady state, cells were incubated for 2 h in the viewing chamber with fresh medium containing 1.2 M sorbitol before introducing osmotic shock. All other CellASIC protocols were identical to protoplast experiments.
For Fig. 3B and Fig. S2, single-focal-plane images of the cell middle were acquired. Control and stressed cells were imaged under identical conditions. mCherry intensity on the cortex was measured using the ImageJ circle tool around the cortex and the background signal from the image was subtracted. The circle tool was adjusted through time points as cell size of protoplasts increased. The circumference of each protoplast was calculated by measuring the diameter using the line tool in ImageJ. For Fig. 3A and Fig. S4, 0.2-μm stacks at the top cortex of cell were acquired. Control and stressed cells were imaged under identical conditions.
To measure protoplast surface area, we assumed a spheroid shape in the microfluidic device and used the protoplast circumference to measure surface area with the formula:
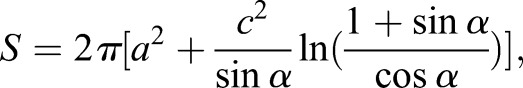 |
where angular eccentricity=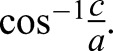 From this equation, the average surface area of a pre-stress wild-type protoplast is 100 µm2 and the surface area after expansion is 155 µm2 (n=50 cells). These values for pil1Δ protoplasts are 103 µm2 before stress and 121 µm2 after expansion (i.e. before lysis).
To estimate the surface area provided by eisosomes, we first measured the average length of eisosomes per µm2 at the plasma membrane. For 50 cells, we drew a 1 µm2 box at the top cortex and quantified the total Pil1–mCherry length in each box. This indicated that there were 1.6 µm of eisosomes per µm2 of plasma membrane. For a pre-stress protoplast of 100 µm2, this leads to 160 linear µm of eisosomes. Electron microscopy studies from budding yeast and fission yeast have defined eisosomes as a ‘half-elliptical cylinder’, with dimensions 30–50 nm wide and 50 nm in depth (Lee et al., 2015; Moor and Muhlethaler, 1963; Stradalova et al., 2009; Takeo, 1985). Therefore, we calculated lateral surface area of a half-elliptical cylinder with dimensions 160 µm long, 30 nm wide and 50 nm deep using the following formula:
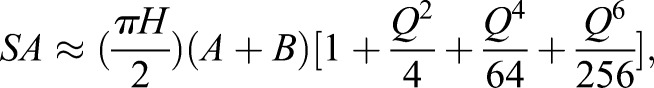 |
where 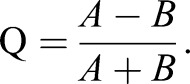
This leads to 10.15 µm2 of surface area covered by eisosome invaginations for a 100 µm2 protoplast prior to stress. We then subtracted the rectangular base width of eisosomes because this value already contributes to protoplast surface area prior to membrane expansion. For 160 µm of eisosome length with a width of 30 nm, this value is 4.8 µm2 per protoplast, resulting in our final estimate that eisosomes contribute 5.35 µm2 of net surface area for membrane expansion.
Scanning electron microscopy
For scanning electron microscopy, we used clean sterilized 12-mm-diameter round glass coverslips. Protoplasts were made as described above and hypoosmotically stressed by placing them in medium containing 0.8 M sorbitol for 10 min. Protoplasts in solution were incubated on coverslips until adhesion to coverslip. Samples were fixed with a primary fixative of 2% glutaraldehyde and 0.1% Ruthenium Red in 0.1 M sodium cacodylate, pH 7.2. (2× Ruthenium Red is added 1:1 to 2× stock primary fix, just before use). Samples were then post-fixed in 1% osmium tetroxide (OsO4) with 0.1% Ruthenium Red in 0.1 M sodium cacodylate, pH 7.2. (2× Ruthenium Red is added 1:1 to 2× stock post-fix, just before use). After dehydrating through a ethanol series to 100% ethanol, samples were critical point dried using a Samdri 795 (Tousimis Corp., Rockville, MD) and coated with 2–3 nm of osmium using an SPI plasma coater (SPI Supplies, West Chester, PA). Images were generated at 10 kV by an FEI XL-30 (FEI Company, Salem, MA) field emission SEM.
Acknowledgements
We thank members of the Moseley laboratory and the Biochemistry Department for discussions.
Footnotes
Competing interests
The authors declare no competing or financial interests.
Author contributions
R.K. and J.B.M conceived the study; R.K. performed all experiments; L.H. performed electron microscopy; J.M. wrote the paper; all authors analyzed the experiments, reviewed the results, and edited and approved the final version of the manuscript.
Funding
This work was funded by the National Institutes of Health [grant number GM099774 to J.B.M.]; the Norris Cotton Cancer Center; and a Robert D. Watkins Fellowship from the American Society for Microbiology (to R.K.). J.B.M. is a Pew Scholar in the Biomedical Sciences. Deposited in PMC for release after 12 months.
Supplementary information
Supplementary information available online at http://jcs.biologists.org/lookup/suppl/doi:10.1242/jcs.176867/-/DC1
References
- Allan E. J. (1991). Induction and cultivation of a stable L-form of Bacillus subtilis. J. Appl. Bacteriol. 70, 339-343. 10.1111/j.1365-2672.1991.tb02946.x [DOI] [PubMed] [Google Scholar]
- Berchtold D., Piccolis M., Chiaruttini N., Riezman I., Riezman H., Roux A., Walther T. C. and Loewith R. (2012). Plasma membrane stress induces relocalization of Slm proteins and activation of TORC2 to promote sphingolipid synthesis. Nat. Cell Biol. 14, 542-547. 10.1038/ncb2480 [DOI] [PubMed] [Google Scholar]
- Errington J. (2013). L-form bacteria, cell walls and the origins of life. Open Biol. 3, 120143 10.1098/rsob.120143 [DOI] [PMC free article] [PubMed] [Google Scholar]
- Frohlich F., Christiano R., Olson D. K., Alcazar-Roman A., DeCamilli P. and Walther T. C. (2014). A role for eisosomes in maintenance of plasma membrane phosphoinositide levels. Mol. Biol. Cell 25, 2797-2806. 10.1091/mbc.E13-11-0639 [DOI] [PMC free article] [PubMed] [Google Scholar]
- Gauthier N. C., Masters T. A. and Sheetz M. P. (2012). Mechanical feedback between membrane tension and dynamics. Trends Cell Biol. 22, 527-535. 10.1016/j.tcb.2012.07.005 [DOI] [PubMed] [Google Scholar]
- Hohmann S. (2002). Osmotic stress signaling and osmoadaptation in yeasts. Microbiol. Mol. Biol. Rev. 66, 300-372. 10.1128/MMBR.66.2.300-372.2002 [DOI] [PMC free article] [PubMed] [Google Scholar]
- Kabeche R., Baldissard S., Hammond J., Howard L. and Moseley J. B. (2011). The filament-forming protein Pil1 assembles linear eisosomes in fission yeast. Mol. Biol. Cell 22, 4059-4067. 10.1091/mbc.E11-07-0605 [DOI] [PMC free article] [PubMed] [Google Scholar]
- Kabeche R., Roguev A., Krogan N. J. and Moseley J. B. (2014). A Pil1-Sle1-Syj1-Tax4 functional pathway links eisosomes with PI(4,5)P2 regulation. J. Cell Sci. 127, 1318-1326. 10.1242/jcs.143545 [DOI] [PMC free article] [PubMed] [Google Scholar]
- Karotki L., Huiskonen J. T., Stefan C. J., Ziolkowska N. E., Roth R., Surma M. A., Krogan N. J., Emr S. D., Heuser J., Grunewald K. et al. (2011). Eisosome proteins assemble into a membrane scaffold. J. Cell Biol. 195, 889-902. 10.1083/jcb.201104040 [DOI] [PMC free article] [PubMed] [Google Scholar]
- Lee J.-H., Heuser J. E., Roth R. and Goodenough U. (2015). Eisosome ultrastructure and evolution in fungi, microalgae and lichens. Eukaryot. Cell. 14, 1017-1042. 10.1128/EC.00106-15 [DOI] [PMC free article] [PubMed] [Google Scholar]
- Mayor S. (2011). Need tension relief fast? Try caveolae. Cell 144, 323-324. 10.1016/j.cell.2011.01.018 [DOI] [PubMed] [Google Scholar]
- Mercier R., Kawai Y. and Errington J. (2014). General principles for the formation and proliferation of a wall-free (L-form) state in bacteria. eLife 3, e04629 10.7554/eLife.04629 [DOI] [PMC free article] [PubMed] [Google Scholar]
- Moor H. and Mühlethaler K. (1963). Fine structure in frozen-etched Yeast Cells. J. Cell Biol. 17, 609-628. 10.1083/jcb.17.3.609 [DOI] [PMC free article] [PubMed] [Google Scholar]
- Moreira K. E., Walther T. C., Aguilar P. S. and Walter P. (2009). Pil1 controls eisosome biogenesis. Mol. Biol. Cell 20, 809-818. 10.1091/mbc.E08-03-0313 [DOI] [PMC free article] [PubMed] [Google Scholar]
- Moreira K. E., Schuck S., Schrul B., Frohlich F., Moseley J. B., Walther T. C. and Walter P. (2012). Seg1 controls eisosome assembly and shape. J. Cell Biol. 198, 405-420. 10.1083/jcb.201202097 [DOI] [PMC free article] [PubMed] [Google Scholar]
- Morris C. E. and Homann U. (2001). Cell surface area regulation and membrane tension. J. Membr. Biol. 179, 79-102. [DOI] [PubMed] [Google Scholar]
- Olivera-Couto A., Grana M., Harispe L. and Aguilar P. S. (2011). The eisosome core is composed of BAR domain proteins. Mol. Biol. Cell 22, 2360-2372. 10.1091/mbc.E10-12-1021 [DOI] [PMC free article] [PubMed] [Google Scholar]
- Orlean P. (2012). Architecture and biosynthesis of the Saccharomyces cerevisiae cell wall. Genetics 192, 775-818. 10.1534/genetics.112.144485 [DOI] [PMC free article] [PubMed] [Google Scholar]
- Osumi M., Yamada N., Yaguchi H., Kobori H., Nagatani T. and Sato M. (1995). Ultrahigh-resolution low-voltage SEM reveals ultrastructure of the glucan network formation from fission yeast protoplast. J. Electron Microsc. 44, 198-206. [PubMed] [Google Scholar]
- Parton R. G. and del Pozo M. A. (2013). Caveolae as plasma membrane sensors, protectors and organizers. Nat. Rev. Mol. Cell Biol. 14, 98-112. 10.1038/nrm3512 [DOI] [PubMed] [Google Scholar]
- Raucher D. and Sheetz M. P. (1999). Characteristics of a membrane reservoir buffering membrane tension. Biophys. J. 77, 1992-2002. 10.1016/S0006-3495(99)77040-2 [DOI] [PMC free article] [PubMed] [Google Scholar]
- Rodal A. A., Kozubowski L., Goode B. L., Drubin D. G. and Hartwig J. H. (2005). Actin and septin ultrastructures at the budding yeast cell cortex. Mol. Biol. Cell 16, 372-384. 10.1091/mbc.E04-08-0734 [DOI] [PMC free article] [PubMed] [Google Scholar]
- Sens P. and Turner M. S. (2006). Budded membrane microdomains as tension regulators. Phys. Rev. E Stat. Nonlin. Soft Matter Phys. 73, 031918 10.1103/PhysRevE.73.031918 [DOI] [PubMed] [Google Scholar]
- Shvets E., Ludwig A. and Nichols B. J. (2014). News from the caves: update on the structure and function of caveolae. Curr. Opin. Cell Biol. 29, 99-106. 10.1016/j.ceb.2014.04.011 [DOI] [PubMed] [Google Scholar]
- Sinha B., Köster D., Ruez R., Gonnord P., Bastiani M., Abankwa D., Stan R. V., Butler-Browne G., Vedie B., Johannes L. et al. (2011). Cells respond to mechanical stress by rapid disassembly of caveolae. Cell 144, 402-413. 10.1016/j.cell.2010.12.031 [DOI] [PMC free article] [PubMed] [Google Scholar]
- Stradalova V., Stahlschmidt W., Grossmann G., Blazikova M., Rachel R., Tanner W. and Malinsky J. (2009). Furrow-like invaginations of the yeast plasma membrane correspond to membrane compartment of Can1. J. Cell Sci. 122, 2887-2894. 10.1242/jcs.051227 [DOI] [PubMed] [Google Scholar]
- Streiblova E. (1968). Surface structure of yeast protoplasts. J. Bacteriol. 95, 700-707. [DOI] [PMC free article] [PubMed] [Google Scholar]
- Takeo K. (1985). A correlation between mode of growth and regional ultrastructure of the plasma membrane of Schizosaccharomyces pombe as revealed by freeze-fracturing before and after filipin treatment. J. Gen. Microbiol. 131, 309-316. 10.1099/00221287-131-2-309 [DOI] [PubMed] [Google Scholar]
- Walther P., Müller M. and Schweingruber M. E. (1984). The ultrastructure of the cell surface and plasma membrane of exponential and stationary phase cells of Schizosaccharomyces pombe, grown in different media. Arch. Microbiol. 137, 128-134. 10.1007/BF00414453 [DOI] [Google Scholar]
- Ziółkowska N. E., Karotki L., Rehman M., Huiskonen J. T. and Walther T. C. (2011). Eisosome-driven plasma membrane organization is mediated by BAR domains. Nat. Struct. Mol. Biol. 18, 854-856. 10.1038/nsmb.2080 [DOI] [PubMed] [Google Scholar]