

Abstract
Understanding the structural and functional mechanisms underlying the development of individual brain microcircuits is critical for elucidating their computational properties. As synapses are the key structures defining a given microcircuit, it is imperative to investigate their development and precise structural features. Here, synapses in cortical layer 4 were analyzed throughout the first postnatal month using high-end electron microscopy to generate realistic quantitative 3D models. Besides their overall geometry, the size of active zones and the pools of synaptic vesicles were analyzed. At postnatal day 2 only a few shaft synapses were found, but spine synapses steadily increased with ongoing corticogenesis. From postnatal day 2 to 30 synaptic boutons significantly decreased in size whereas that of active zones remained nearly unchanged despite a reshaping. During the first 2 weeks of postnatal development, a rearrangement of synaptic vesicles from a loose distribution toward a densely packed organization close to the presynaptic density was observed, accompanied by the formation of, first a putative readily releasable pool and later a recycling and reserve pool. The quantitative 3D reconstructions of synapses will enable the comparison of structural and functional aspects of signal transduction thus leading to a better understanding of networks in the developing neocortex.
Keywords: 3D reconstructions, electron microscopy, pool of synaptic vesicles, synapse geometry, synaptogenesis
Introduction
Although synapses are key elements in the establishment and maintenance of cortical networks, most of the existing structural studies have mainly focused on their density and distribution during development without providing further quantifications of synaptic parameters (Aghajanian and Bloom 1967; Cragg 1972, 1975; Dyson and Jones 1980; Blue and Parnavelas 1983a,1983b; Rakic et al. 1986; Markus et al. 1987; Bourgeois et al. 1989; Zecevic and Rakic 1991; Micheva and Beaulieu 1996; De Felipe et al. 1997). However, a detailed and quantitative description of synaptic structures is required to understand the functional signal cascades underlying the computational properties in early neocortical networks. This would allow answering important questions about cortico- and synaptogenesis; for example, when are the first synapses generated in the neocortex? Second, are synapses rearranged and/or reshaped during early phases of development? Third, when do these synapses become structurally mature? And finally what are the structural substrates of synaptic transmission and efficacy during development? These questions can be adequately addressed taking advantage of high-end electron microscopy (EM) and computer-assisted quantitative 3D reconstructions of synaptic structures based on serial ultrathin sections and digital electron micrographs.
So far, several quantitative 3D studies of synaptic structures are available in adult CNS (hippocampus: Harris and Sultan 1995; Rollenhagen et al. 2007; Popov and Stewart 2009; cerebellum: Xu-Friedman et al. 2001; Xu-Friedman and Regehr 2003; calyx of Held: Sätzler et al. 2002; reviewed by Rollenhagen and Lübke 2006), but only a few for development (hippocampus: Harris et al. 1992; Sorra et al. 1998; Fiala et al. 1998; Wilke et al. 2013; calyx of Held: Holcomb et al. 2013), and rather nothing for neocortical synapses. Recently, using 3D volumetric reconstruction, Rollenhagen et al. (2014) quantitatively investigated the structural characteristics of synaptic boutons terminating on excitatory spiny neurons in layer 4 (L4) of the adult rat barrel cortex. They showed that the geometry and size of active zones (AZs; transmitter release sites) and the size and organization of the pools of synaptic vesicles explain the specific functional behavior of L4 synapses (Egger et al. 1999; Feldmeyer et al. 2002, 2005, 2006; Beierlein et al. 2003; Silver et al. 2003; Staiger et al. 2004; Bruno and Sakmann 2006; Qi and Feldmeyer 2015; reviewed by Lübke and Feldmeyer 2007; Feldmeyer et al. 2013).
Here, we provide a detailed quantitative analysis of the structural subelements constituting excitatory synapses at early stages of postnatal development day (P) 2–30 in L4 of the rat barrel cortex to compare developing and adult L4 synapses. The so-called barrel field in the primary somatosensory area (S1) of the neocortex is the cortical representation of the whisker pad on the rodent's muzzle (Woolsey and Van der Loos 1970) and is thought to represent the major input layer for thalamocortical (TC) afferents from the somatosensory periphery, and thus, the first station of cortical information processing (Armstrong-James et al. 1992; but see Constantinople and Bruno 2013; reviewed by Feldmeyer et al. 2013). Besides the overall geometry of presynaptic boutons, the distribution, size, and shape of the AZs, as well as the development, organization, and size of the pools of synaptic vesicles, that represent 2 of the key structural determinants of synaptic transmission and plasticity, were investigated. Both undergo profound changes during ongoing cortico-, synapto-, and spinogenesis in the first postnatal weeks. This study is the first coherent quantitative description of developing cortical synapses in such detail and may thus help to explain the behavior of synapses in early brain networks.
Materials and Methods
Fixation and Tissue Processing
All animals were handled in accordance with the Animal Research Committee of the Research Centre Jülich GmbH and the European Community Council directives regarding the protection of animals used for experimental and scientific purposes (2010/63/EU).
Experiments were performed on Wistar rats of different postnatal ages: P2, P4, P7, P10, P14, and almost mature animals (P30). It has to be noted that L4 is not present at birth (P0), but emerges from the lower part of the dense cortical plate (DCP) at P1 (Catalano et al. 1996), thus we started investigations at P2. Four rats of each age were investigated in order to examine the interindividual variability.
P2 pups (n = 2) were deeply anesthetized with pentobarbital (Narkodorm®; 100 mg/kg; CP-Pharma GmbH, Germany) and then decapitated. Brains were removed from the skulls, immediately immersion-fixed for 24 h at 4°C in a phosphate-buffered solution (PB; 0.1 M, pH 7.4) containing 4% paraformaldehyde and 2.5% glutaraldehyde, and then extensively washed in PB.
After being anesthetized with Narkodorm®, the other animals (including 2 extra animals for P2) were perfused through the ascending aorta at a constant flow rate (1.75 mL/min for P2 and P4, 3 mL/min for P7 and P10, 6 mL/min for P14 and P30) with saline PB for 1 min, followed by the same ice-cold fixative as described above for 10–15 min. Brains were removed, post-fixed 1 h in the same but fresh fixative at 4°C and then extensively washed in PB.
Coronal sections (150 μm in thickness) were cut through the barrel field using a vibratome (VT1000S; Leica Microsystems GmbH, Germany) and collected in PB. After incubation for 1 h in sucrose-PB containing 1% osmium tetroxide, sections were washed in PB, and dehydrated in ascending series of ethanol to absolute ethanol. Sections were transferred to propylene oxide, to a mixture (1:1) of propylene oxide and epoxy resin (Durcupan™; ACM, Fluca, Sigma-Aldrich Inc., USA) for 1 h, and then to pure Durcupan™ overnight. Finally, sections were flat-embedded in Durcupan™ and polymerized at 60°C for 2 days.
Individual barrels from the posteromedial barrel subfield (rows A and B) were chosen for analyses. This region is a highly consistent region, containing the largest barrels and displaying a striking isomorphic representation of the major facial whiskers (Woolsey and Van der Loos 1970). However, a clear identification of the barrel field was not possible for P2 and P4 in coronal sections, although prebarrels are visible in acute slice preparations under infrared contrast video microscopy (D. Feldmeyer, personal communication). For both ages the rostro-caudal extension of the A and B rows was defined within the neocortex with respect to the location of barrels in older animals. The area of interest was trimmed out and glued onto prepolymerized resin blocks. A progressive cropping was made using semithin sections counterstained with toluidine-blue for light microscopy examination (for more details see Supplementary Fig. 1a,b). Then serial ultrathin sections (∼50–70 sections/series; ∼55 nm in thickness, silver to light gray interference contrast appearance) were cut through the level of L4 (or the lower part of the DCP for P2 and P4 rats; Catalano et al. 1996) with an ultramicrotome (Ultracut S; Leica Microsystems GmbH). Sections were collected on Pioloform-coated slot copper grids. After counterstaining with 5% uranyl acetate in double distilled water (5–20 min) and lead citrate (1–7 min; Reynolds 1963), grids were examined with a Libra 120 electron microscope (Carl Zeiss GmbH, Germany) equipped with a bottom-mounted ProScan 2 K digital camera, using the SIS Analysis software (Olympus Soft Imaging Solutions GmbH, Germany). Serial digital images using the Multi Images Acquisition software were taken at a magnification of ×8000 providing the basis for 3D reconstruction and quantitative analysis.
Aldehyde fixation and dehydration are thought to cause tissue shrinkage leading to a possible bias in morphological parameters. A recent study by Korogod et al. (2015) reported a reduction by 16% of cortical thickness in the mouse somatosensory neocortex, with, nevertheless, no shrinkage along the barrel arcs. Comparing aldehyde- and cryofixation, they described a marked difference in extracellular and glia volume but no difference in the volume of axons and dendrites. On the other hand older studies have shown that there were no significant differences in the values of synaptic structural parameters, similar to those measured here, of samples prepared by high pressure freezing or cryosubstitution when compared with conventionally embedded electron microscopic material (Zhao, Studer, Graber et al. 2012; Zhao, Studer, Chai et al. 2012). Thus, no correction for shrinkage was performed.
3D reconstruction and Analyses
Electron micrographs composing the series were imported, stacked, and aligned in the reconstruction software OpenCAR (Contour Alignment Reconstruction; Sätzler et al. 2002). Presynaptic boutons, their mitochondria as well as their postsynaptic target structures, either dendritic shafts or spines were outlined on the outer edge of their membranes using closed contour lines. From these contours, 3D volumetric reconstructions were performed to obtain surface and volume measurements. The pre- and postsynaptic densities that, together with the synaptic cleft, compose the AZ were analyzed separately. The presynaptic density (or presynaptic AZ, PreAZ) was computed by extracting the area from the reconstructed presynaptic membrane covered by the membrane specializations defined by contour lines in consecutive sections. The surface area of the postsynaptic density (PSD) was estimated by its contour lines.
Measurements of the synaptic cleft width under the AZs in P2 (n = 96 in 4 animals) and P30 rats (n = 100 in 4 animals) were performed on random images taken from the series using the SIS Analysis software. Only synapses cut perpendicular through the AZ were included in these samples. The distance between the outer edge of pre- and the postsynaptic membranes was measured at the 2 lateral edges and at the center of the synapse; the 2 values of the lateral edges were averaged for each synapse according to Rollenhagen et al. (2014).
To estimate the number and size of the clear synaptic and dense-core vesicles (DCVs), all vesicles were marked throughout each synaptic bouton and their diameters were individually measured. To determine the distribution of vesicles, 2 different methods were used. First, the minimal distance between each vesicle membrane and the projection of the contour lines of the PreAZ on the boutons membrane was measured in 2 dimensions. However, this method, which only includes the vesicles in the same serial sections as the AZ, is only appropriate for vesicles within a short distance from the PreAZ. Thus, we developed another method of measurement more appropriate for longer distances (≥100 nm) that follows the same principle of measurement as before, but in “real” 3D in order to estimate the total pool of vesicles. To avoid double counts, DCVs were measured only in the section where they appear largest. All calculations were performed off-line using a batch version of OpenCAR. For additional information on 3D reconstruction, see also Sätzler et al. (2002) and Rollenhagen et al. (2014).
Statistical Procedures and Image Editing
Statistical tests were computed with InStat (GraphPad Software Inc., USA) and XLSTAT (Addinsoft SARL, France). To look for interindividual differences between animals of the same age and for each structural parameter, data distributions were analyzed using boxplots (see Rollenhagen et al. 2014). For each parameter the mean ± standard deviation (SD) was calculated per bouton, animal, and then per age. Statistical differences between 2 groups were tested using the non-parametric Mann–Whitney test (MW), whereas comparisons among more than 2 groups were accomplished with the non-parametric Kruskal–Wallis test (KW). Differences between 2 distributions were assessed using the non-parametric Kolmogorov–Smirnov test. Correlations were tested using the non-parametric Spearman test. The significance level was set at P ≤ 0.05. For better clarity, results were summarized in tables. Image editing and layout were performed using Adobe Photoshop (Adobe Systems Inc., USA).
Results
A total of 274 synaptic boutons and 386 AZs taken from 24 animals between P2 and P30 were analyzed regardless of their different possible origin and their target structures (glutamatergic and GABAergic dendritic segments, and dendritic spines) in L4 of the barrel cortex. We focused on asymmetric synapses; synapses on somata as well as symmetric synapses were not included. From the sample, 226 synaptic boutons and 348 AZs were completely reconstructed (see Table 1). A synaptic bouton was considered complete when it was possible to follow the axon in both directions through the entire z-stack (en passant bouton) or the enlargement of the axon leading into an end-terminal bouton. An AZ was regarded as complete when its perimeter was entirely reconstructed. Spines were categorized in filopodial (length > 2 µm), thin (length < 2 µm), stubby (length/width ratio < 1), mushroom (width > 0.6 µm), and branched (2 or more heads) spines according to Risher et al. (2014). At the EM level synapses were identified by the presence of 2 apposed membrane specializations, a pre- and postsynaptic density forming the AZ, a synaptic cleft, and a pool of synaptic vesicles (Gray 1959b; 1959a).
Table 1.
Quantitative analysis of structural parameters of L4 synaptic boutons and AZs
| P2 (n = 4) | P4 (n = 4) | P7 (n = 4) | P10 (n = 4) | P14 (n = 4) | P30 (n = 4) | Statistical test | |
|---|---|---|---|---|---|---|---|
| Boutons | |||||||
| No. of analyzed boutons | 26 | 27 | 45 | 37 | 50 | 41 | |
| Mean bouton surface (µm2) | 11.23 ± 5.10; 9.81 | 10.66 ± 3.52; 10.33 | 4.62 ± 1.01; 4.76 | 6.46 ± 1.65; 6.50 | 5.14 ± 1.68; 5.35 | 3.85 ± 0.82; 3.90 | KW P = 0.0051 |
| Mean bouton volume (µm3) | 1.081 ± 0.576; 1.047 | 0.873 ± 0.333; 0.784 | 0.335 ± 0.078; 0.355 | 0.420 ± 0.192; 0.356 | 0.336 ± 0.146; 0.339 | 0.209 ± 0.049; 0.206 | KW P = 0.0055 |
| Correlation bouton surface versus bouton volume |
r = 0.926 P < 0.0001 |
r = 0.939 P < 0.0001 |
r = 0.953 P < 0.0001 |
r = 0.912 P < 0.0001 |
r = 0.962 P < 0.0001 |
r = 0.952 P < 0.0001 |
Spearman test |
| Percentage of boutons with a single AZ | 71.87 ± 26.65; 75 | 61.16 ± 44.56; 72.32 | 79.49 ± 22.23; 90.45 | 61.30 ± 9.33; 61.25 | 67.85 ± 38.36; 78.57 | 83.13 ± 8.40; 84.44 | |
| Mitochondria | |||||||
| Percentage of boutons containing mitochondria | 56.54 ± 18.17; 50 | 53.21 ± 33.71; 46.42 | 57.08 ± 8.37; 54.54 | 44.26 ± 16.02; 46.02 | 55.15 ± 4.95; 54.76 | 43.33 ± 13.80; 38.18 | KW P = 0.5706 |
| Mean volume of mitochondria per bouton (µm3) | 0.050 ± 0.003; 0.049 | 0.044 ± 0.027; 0.040 | 0.045 ± 0.028; 0.037 | 0.046 ± 0.013; 0.052 | 0.056 ± 0.038; 0.040 | 0.073 ± 0.033; 0.061 | KW P = 0.3948 |
| Percentage of mitochondria volume in bouton volume | 4.61 ± 2.27; 4.45 | 4.21 ± 3.21; 3.64 | 10.66 ± 4.40; 9.09 | 7.02 ± 3.11; 7.90 | 12.90 ± 4.75; 12.14 | 21.02 ± 8.84; 17.92 | KW P = 0.0049 |
| Mean mitochondrion volume (µm3) | 0.033 ± 0.006; 0.033 | 0.043 ± 0.025; 0.032 | 0.041 ± 0.028; 0.030 | 0.031 ± 0.006; 0.032 | 0.041 ± 0.015; 0.035 | 0.042 ± 0.009; 0.045 | KW P = 0.7507 |
| Active zones | |||||||
| No. of analyzed AZs | 47 | 59 | 62 | 62 | 70 | 48 | |
| Percentage of AZs on spines | 8.51 ± 7.63; 7.94 | 22.91 ± 22.71; 22.02 | 61.81 ± 18.52; 68.26 | 60.92 ± 15.08; 62.78 | 74.53 ± 8.94; 72.88 | 92.88 ± 10.49; 96.87 | |
| Percentage of spines containing a spine apparatus | 0 | 6.25 ± 12.50; 0 | 33.85 ± 30.06; 34.37 | 11.53 ± 13.32; 11.53 | 26.36 ± 23.23; 27.73 | 42.90 ± 20.54; 34.84 | |
| Percentage of perforated AZs | 1.47 ± 2.94; 0 | 4.89 ± 3.50; 5.95 | 5.92 ± 7.42; 4.16 | 3.25 ± 3.79; 2.94 | 9.73 ± 7.45; 11.14 | 31.77 ± 13.54; 29.16 | |
| Synaptic cleft width (nm) lateral mean value |
16.28 ± 0.27; 16.23 | 16.97 ± 0.58; 17.06 | MW P = 0.1143 |
||||
| Synaptic cleft width (nm) central mean value |
16.75 ± 0.40; 16.80 | 17.10 ± 1.41; 17.33 | MW P = 0.3429 |
||||
| PSD mean area (µm2) | 0.178 ± 0.064; 0.149 | 0.163 ± 0.043; 0.148 | 0.164 ± 0.042; 0.179 | 0.186 ± 0.032; 0.191 | 0.177 ± 0.024; 0.169 | 0.204 ± 0.045; 0.204 | KW P = 0.7154 |
| PreAZ mean area (µm2) | 0.236 ± 0.066; 0.208 | 0.243 ± 0.048; 0.226 | 0.220 ± 0.052; 0.235 | 0.273 ± 0.050; 0.280 | 0.227 ± 0.026; 0.231 | 0.268 ± 0.051; 0.269 | KW P = 0.5309 |
| Ratio PreAZ /PSD areas | 1.43 ± 0.05; 1.43 | 1.50 ± 0.08; 1.49 | 1.42 ± 0.09; 1.41 | 1.41 ± 0.06; 1.40 | 1.40 ± 0.10; 1.44 | 1.33 ± 0.05; 1.33 | KW P = 0.2076 |
| Correlation PreAZ versus PSD areas |
r = 0.975 P < 0.0001 |
r = 0.971 P < 0.0001 |
r = 0.970 P < 0.0001 |
r = 0.964 P < 0.0001 |
r = 0.943 P < 0.0001 |
r = 0.955 P < 0.0001 |
Spearman test |
| PreAZ mean area on shafts (µm2) | 0.244 ± 0.059; 0.217 | 0.256 ± 0.039; 0.254 | 0.160 ± 0.037; 0.160 | 0.254 ± 0.094; 0.250 | 0.158 ± 0.036; 0.162 | 0.271 ± 0.035; 0.271 | KW P = 0.0274 |
| PreAZ mean area on spines (µm2) | 0.216 ± 0.127; 0.165 | 0.217 ± 0.044; 0.226 | 0.237 ± 0.065; 0.253 | 0.268 ± 0.071; 0.282 | 0.244 ± 0.036; 0.243 | 0.270 ± 0.047; 0.270 | KW P = 0.8425 |
| Correlation bouton surface versus PreAZ area |
r = 0.434 P = 0.0299 |
r = 0.390 P = 0.0443 |
r = 0.282 P = 0.0628 |
r = 0.435 P = 0.0207 |
r = 0.430 P = 0.0023 |
r = 0.581 P < 0.0001 |
Spearman test |
Note: Summary of structural parameters estimated from the 3D reconstructions of L4 synaptic boutons during postnatal development. Mean ± SD and median values are given for each age. KW, MW, and Spearman correlation tests were used for statistics.
General Observations on the Development of Synaptic Structures in L4
At P2, L4 in the barrel field of the rat S1 neocortex is still developing and thus not unequivocally identifiable and distinguishable from the DCP (Catalano et al. 1996). Therefore, the lower part of the DCP, which develops into L4 with ongoing maturation, was examined. At this age, the neuropil shows a loose organization (Fig. 1A). The large extracellular space contains sparse cellular elements including somata, dendritic, and axonal profiles of different caliber. Somatic and dendritic gap-junctional coupling were frequently observed (this study; Sutor and Hagerty 2005). Within the neuropil only a few synaptic contacts, predominantly established on dendritic shafts (∼91%) but very rarely on spines, are present. Dendrodendritic synapses were also infrequently observed (Fig. 1A). P2 is characterized by a large variability in the shape and size of synaptic profiles with a large gradient in maturity between individual synaptic contacts. AZs are always found in synapses but vary substantially in shape and size; in particular in the thickness of their PSD due to differences in the accumulation of dense material. At P2, the majority of the synaptic boutons contain a relatively small number of synaptic vesicles distributed over the entire terminal, although with a large variability (Table 1). Only a few were found close to the PreAZ with only one to 2 docked vesicles (Fig. 1A inset). Besides synaptic vesicles, large DCVs are present in approximately 83% of the synaptic boutons. However, this number decreases with ongoing development.
Figure 1.

Structural organization of the neuropil in L4 during the first postnatal week. (A) At P2 developing L4 is characterized by a very loose neuropil which contains only a few synapses (synaptic bouton–dendrite contacts, sb–de), dendro-dendritic contacts (de1–de2), dendrites and axons of different caliber. Inset: higher magnification of the AZ shown in (A) Note the occurrence of a single docked vesicle, highlighted in green, attached to the PreAZ. (B,C) At P4 the extracellular space decreases while the density of synapses increases. The majority of the synapses are established between large cell processes, presumably on dendritic shafts. Synaptic vesicles seem to be randomly distributed throughout the entire terminals (B) although in some synaptic boutons vesicles are located in close proximity to the PreAZ (C). Note the presence of a DCV in (C). (D) At the end of the first postnatal week (P7) the neuropil appears more condensed and contains a higher density of synapses still displaying different levels of maturity. Three types of synapses are present: dendro-dendritic (de1–de2), dendritic shaft (sb–de) and spines (sb–sp) some of which are drawn in yellow (sb) and blue (de, sp). The long spine neck is indicated by a black arrow. (E) High magnification of a synaptic bouton (sb) establishing synaptic contacts with 2 dendrites (de1, de2) at P7. (F) Another example of a synaptic bouton (sb) taken at the same age containing a relatively large number of small and large synaptic vesicles as well as DCVs. In all figures AZs are delimited by red dots. Scale bars in A–F 0.5 µm.
At P4, as the lower part of the DCP further develops into L4, the steady increase in cellular profiles and synapses lead to a pronounced decrease in extracellular space (Fig. 1B). Besides shaft synapses (Fig. 1B), more spine synapses are present at this age (∼23% of the synapses; Fig. 1B,C). In general, AZs appear more mature as indicated by the adding of dense material to both the pre- and postsynaptic densities (Fig. 1B,C). The number of synaptic vesicles per bouton increases, still loosely distributed over the entire terminal, but with more vesicles close to the PreAZ (Fig. 1C).
At the end of the first postnatal week the neuropil is even more compact, densely filled with cellular profiles and synapses (Fig. 1D). At P7, >60% of the synaptic contacts are established on spines (Fig. 1D). At this age a prominent spine apparatus, a specialized form of the endoplasmic reticulum, was clearly identifiable in approximately 34% of the total population of spines. The majority of the AZs show an increase in thickness with a further condensation of their dense material (Fig. 1E,F). There is a tendency for synaptic vesicles to be located closer to the PreAZ.
At the end of the second postnatal week, L4 is still in the process of ongoing maturation. Here, the majority of synapses appear mature based on their structural geometry, but in particular the rearrangement of the AZs and the increasing pools of synaptic vesicles (Fig. 2A–C). At P14 a spine apparatus was observed in approximately 26% of the spines as exemplified in Figure 2B. AZs can be categorized according to their nonperforated (Fig. 2A–C) and perforated (Fig. 2A) appearance. Perforations occur in approximately 10% of the AZs; they were observed always at both the pre- and postsynaptic sides. The pools of synaptic vesicles become more densely packed and loose the random distribution throughout the entire terminal (Fig. 2A,C), although their number and distribution is still highly variable (Fig. 2B).
Figure 2.

Structural organization of L4 at P14 versus P30 stages of postnatal development. (A) At P14 the number of spine synapses (sb–sp, some of which are given in yellow and blue) steadily increases when compared with shaft synapses (sb–de). The asterisk shows a perforated AZ. (B,C) Two examples of synaptic boutons of different size contacting dendritic spines at P14. Note the presence of a spine apparatus in (B). (D) At P30, the neuropil of L4 appears similar to the adult with a high density of synapses; approximately one-third shows a perforation of their AZ (asterisks). (E,F) Examples of synaptic boutons contacting dendritic spines at P30. Note the perforation of the AZ in (E). The spine in (F) contains a spine apparatus shown at higher magnification in the inset. In all figures AZs are delimited by red dots. Scale bars in A–F 0.5 µm.
At P30, the neocortex is regarded to be nearly adult-like as indicated by the organization of the neuropil, the density of synapses and their morphology (Fig. 2D–F; see also Blue and Parnavelas 1983a; 1983b; Markus et al. 1987; Micheva and Beaulieu 1996; Rollenhagen et al. 2014). The number of spine synapses further increases by a third when compared with P7 (Table 1). In parallel, an increase in the number of perforated AZs to approximately 32% of the total is observed. The organization of the synaptic vesicle pools is now similar to that found for adult synapses (Rollenhagen et al. 2014).
No obvious signs of synapse and spine degeneration or elimination were observed as characterized for the development of cat and rat visual cortex (Cragg 1972, 1975; Dyson and Jones 1980). However, it has to be mentioned that a synaptic elimination could occur later as described in the mouse barrel cortex (between P32 and adulthood, De Felipe et al. 1997).
Geometry of Synaptic Boutons
One unexpected finding was that the size of synaptic boutons significantly decreases by 5-fold with ongoing development (Fig. 3). However, a large variability in both shape and size of synaptic boutons was observed throughout the age groups. The surface area of synaptic boutons significantly decreases (from 11.23 ± 5.10 µm2 at P2 to 3.85 ± 0.82 µm2 at P30; P = 0.0051, KW test; Table 1) as well as the bouton volume (from 1.08 ± 0.58 µm3 at P2 to 0.21 ± 0.05 µm3 at P30; P = 0.0055, KW test; Table 1; Fig. 4A). Surface area and volume are always highly correlated (see Table 1).
Figure 3.

Comparison of synaptic boutons at P4 and P30. (A1–A3) Consecutive electron micrographs taken from a series used for the 3D reconstructions of the P4 synaptic boutons shown in A4. (A4) Example of a P4 synaptic bouton. At this age, the majority of boutons are large and synaptic vesicles are most often distributed throughout the entire terminal. The synaptic bouton is reconstructed in transparent yellow, the mitochondrion in white, the PreAZ in red, synaptic vesicles in green, and the DCV in magenta. Axons are pointed out by arrows and the axonal vesicle by an asterisk. (B,C) Different views of the distribution of synaptic vesicles with respect to their location to the PreAZ. Although the majority of synaptic vesicles are distributed throughout the entire terminal, a small fraction is found in close proximity to the PreAZ (C). (D1–D3) Consecutive electron micrographs taken from a series used for the 3D reconstructions of the P30 synaptic boutons shown in D4. (D4) Example of a P30 synaptic bouton. Same color code as described above. Note that this bouton establishes 2 synaptic contacts (syn1, syn2). In P30 boutons synaptic vesicles are densely packed close to the PreAZ. (E,F) Different views of the pool of synaptic vesicles with respect to their location to the PreAZ. Scale bars in A–F 0.5 µm.
Figure 4.

Developmental change in synaptic bouton volume and size of the vesicle pool. (A) Line histogram showing, despite a large variability, the steady decline in bouton volume throughout postnatal development (P = 0.0055, KW test; see Table 1). (B) Line histogram showing the increase in the mean number of synaptic vesicles per synaptic bouton during postnatal development (P = 0.0347, KW test; see Table 2). Error bars represent SD.
The majority of the synaptic boutons form only a single AZ (∼72% at P2; ∼83% at P30; see Table 1); the remainder has 2–4 AZs, with the exception of 7 AZs for one P4 bouton.
Approximately half of the synaptic boutons contain at least one, at most 4 mitochondria with no significant change during postnatal development (P = 0.5706, KW test; Table 1). The mean volume of a mitochondrion is 0.033 ± 0.006 µm3 at P2 and 0.043 ± 0.001 µm3 at P30 (P = 0.7507, KW test; Table 1).
Synaptic Vesicles
The most striking observation during postnatal development is the dramatic change in the organization of synaptic vesicles from a loose distribution (Fig. 3A–C) to a highly organized, densely accumulated pool of synaptic vesicles relatively close to the PreAZ (Fig. 3D–F). At P2 synaptic vesicles were randomly distributed over the entire terminal with only a few docked or vesicles close to the PreAZ (Fig. 1A inset). At P30 synaptic vesicles may already constitute the 3 functionally defined pools: the readily releasable pool (RRP), recycling pool (RP) and the reserve pool. However, except for the docked vesicles primed to the PreAZ, no morphological distinction can be made between the 3 pools; RP and reserve pool are strongly intermingled (reviewed by Rizzoli and Betz 2005; Denker and Rizzoli 2010). For this study, since it is impossible to differentiate the pools upon morphological criteria, we performed a distance analysis which determines the exact location of each synaptic vesicle to the PreAZ. Nevertheless, we defined a distance of ≤10 nm for docked vesicles and one of ≤40 nm (∼1 vesicle diameter) for the nondocked vesicles located in close proximity of the PreAZ, from which synaptic vesicles could be easily and fast recruited upon stimulation.
Number of Vesicles
The total pool of vesicles per synaptic bouton increases significantly by approximately 4-fold during postnatal development, from 88.27 ± 89.65 vesicles at P2 to 439.98 ± 214.93 vesicles at P30 (Fig. 4B; P = 0.0347, KW test; Table 2). However, the variability observed for this parameter is always very large for each age as indicated by the SD, the minimum and maximum values (Table 2). The mean volume occupied by the vesicles to the total volume of synaptic boutons significantly increases from approximately 0.7% at P2 to approximately 8% at P30 (P = 0.0094, KW test; Table 2). Notably, no correlation between the volume of the boutons and the total number of vesicles was detected except at P30 (see Table 2) suggesting that, during development, the number of synaptic vesicles is independently regulated from bouton size.
Table 2.
Quantitative analysis of L4 synaptic vesicles and DCVs
| P2 (n = 4) | P4 (n = 4) | P7 (n = 4) | P10 (n = 4) | P14 (n = 4) | P30 (n = 4) | Statistical test | |
|---|---|---|---|---|---|---|---|
| Synaptic vesicles | |||||||
| Mean number of vesicles per bouton | 88.27 ± 89.65; 49.67 | 199.18 ± 84.39; 207.67 | 242.53 ± 76.88; 265.97 | 250.93 ± 93.73; 236.77 | 274.40 ± 133.57; 222.98 | 439.98 ± 214.93; 342.71 | KW P = 0.0347 |
| Min and Max number of vesicles per bouton | 14 470 |
22 559 |
6 683 |
22 934 |
9 1063 |
37 3345 |
|
| Correlation bouton volume versus number of vesicles per bouton |
r = 0.553 P = 0.0033 |
r = 0.511 P = 0.0063 |
r = 0.510 P = 0.0003 |
r = 0.620 P < 0.0001 |
r = 0.737 P < 0.0001 |
r = 0.800 P < 0.0001 |
Spearman test |
| Mean vesicle pool volume per bouton (µm3) | 0.007 ± 0.008; 0.003 | 0.014 ± 0.006; 0.015 | 0.012 ± 0.004; 0.013 | 0.014 ± 0.007; 0.012 | 0.011 ± 0.005; 0.010 | 0.016 ± 0.007; 0.013 | KW P = 0.4826 |
| Percentage of the vesicle pool volume in the bouton volume | 0.67 ± 0.56; 0.39 | 2.27 ± 1.10; 2.34 | 4.47 ± 1.57; 4.91 | 4.33 ± 2.83; 3.87 | 3.87 ± 1.30; 3.55 | 8.22 ± 2.94; 8.45 | KW P = 0.0094 |
| Mean number of vesicles ≤10 nm from PreAZ* | 1.54 ± 2.04; 0.63 | 3.87 ± 3.46; 3.12 | 2.54 ± 1.31; 2.23 | 3.58 ± 2.71; 2.98 | 4.42 ± 0.71; 4.16 | 7.71 ± 0.71; 7.70 | KW P = 0.0608 |
| Mean number of vesicles ≤20 nm from PreAZ* | 5.18 ± 6.56; 2.27 | 9.04 ± 4.99; 9.05 | 8.20 ± 4.17; 8.97 | 8.25 ± 2.79; 7.96 | 10.94 ± 1.29; 10.83 | 19.25 ± 4.72; 19.55 | KW P = 0.0559 |
| Mean number of vesicles ≤30 nm from PreAZ* | 7.88 ± 9.81; 3.21 | 13.68 ± 6.59; 13.78 | 13.29 ± 6.45; 14.72 | 12.73 ± 3.01; 12.77 | 16.53 ± 1.59; 16.57 | 28.14 ± 7.39; 28.36 | KW P = 0.0492 |
| Mean number of vesicles ≤40 nm from PreAZ* | 10.22 ± 11.85; 4.50 | 16.68 ± 8.05; 17.12 | 17.56 ± 7.94; 18.22 | 17.22 ± 4.09; 17.27 | 22.51 ± 3.01; 22.78 | 37.24 ± 9.65; 38.53 | KW P = 0.0625 |
| Mean number of vesicles ≤100 nm from PreAZ* | 22.34 ± 28.06; 9.16 | 34.64 ± 18.78; 35.89 | 47.00 ± 22.80; 48.59 | 42.64 ± 11.71; 43.72 | 57.53 ± 9.38; 59.51 | 95.49 ± 24.88; 102.64 | KW P = 0.0289 |
| Percentage of vesicles ≤10 nm from PreAZ* | 1.55 ± 0.92; 1.45 | 1.71 ± 1.24; 1.36 | 1.02 ± 0.29; 0.96 | 1.29 ± 0.56; 1.24 | 1.77 ± 0.49; 1.78 | 1.98 ± 0.66; 2.20 | KW P = 0.4510 |
| Percentage of vesicles ≤40 nm from PreAZ* | 10.83 ± 2.07; 11.18 | 8.24 ± 1.53; 7.74 | 6.99 ± 1.30; 6.72 | 7.14 ± 1.04; 7.34 | 9.35 ± 3.76; 9.01 | 9.32 ± 3.41; 8.98 | KW P = 0.2297 |
| Percentage of vesicles ≤100 nm from PreAZ* | 21.98 ± 5.40; 21.45 | 16.65 ± 4.07; 15.87 | 18.55 ± 4.21; 17.84 | 17.52 ± 2.40; 17.64 | 23.75 ± 9.50; 22.48 | 23.61 ± 7.66; 23.64 | KW P = 0.5380 |
| Correlation PreAZ area versus number of vesicles ≤10 nm from PreAZ* |
r = 0.279 P = 0.1671 |
r = 0.554 P = 0.0027 |
r = 0.383 P = 0.0102 |
r = 0.474 P = 0.0030 |
r = 0.777 P < 0.0001 |
r = 0.682 P < 0.0001 |
Spearman test |
| Correlation PreAZ area versus number of vesicles ≤40 nm from PreAZ* |
r = 0.437 P = 0.0286 |
r = 0.760 P < 0.0001 |
r = 0.849 P < 0.0001 |
r = 0.684 P < 0.0001 |
r = 0.909 P < 0.0001 |
r = 0.909 P < 0.0001 |
Spearman test |
| Correlation PreAZ area versus number of vesicles ≤100 nm from PreAZ* |
r = 0.613 P = 0.0011 |
r = 0.750 P < 0.0001 |
r = 0.864 P < 0.0001 |
r = 0.594 P = 0.0001 |
r = 0.902 P < 0.0001 |
r = 0.921 P < 0.0001 |
Spearman test |
| Mean number of vesicles ≤100 nm from PreAZ** | 26.12 ± 29.00; 12.45 | 66.35 ± 53.58; 58.01 | 62.10 ± 22.26; 61.88 | 72.57 ± 28.68; 68.67 | 85.66 ± 38.26; 69.52 | 122.87 ± 34.30; 119.82 | KW P = 0.0557 |
| Mean number of vesicles ≤500 nm from PreAZ** | 63.82 ± 74.00; 27.53 | 163.98 ± 103.14; 166.41 | 210.57 ± 68.72; 227.95 | 217.70 ± 99.14; 212.77 | 236.07 ± 115.69; 192.46 | 401.88 ± 214.83; 316.51 | KW P = 0.0457 |
| Mean number of vesicles ≤1000 nm from PreAZ** | 76.70 ± 77.38; 41.71 | 186.70 ± 89.45; 192.11 | 238.10 ± 78.21; 260.23 | 240.52 ± 95.80; 229.06 | 261.35 ± 134.94; 207.53 | 438.59 ± 213.99; 342.53 | KW P = 0.0298 |
| Mean vesicle-to-vesicle distance (nm) | 112.07 ± 25.45; 116.29 | 79.34 ± 20.53; 73.73 | 65.20 ± 13.42; 62.54 | 58.25 ± 5.07; 57.32 | 57.23 ± 13.13; 54.08 | 44.47 ± 2.92; 43.98 | KW P = 0.0041 |
| Correlation bouton volume versus mean vesicle-to-vesicle distance |
r = 0.242 P = 0.2432 |
r = 0.285 P = 0.1485 |
r = 0.124 P = 0.4146 |
r = 0.234 P = 0.1616 |
r = 0.125 P = 0.3864 |
r = 0.225 P = 0.1558 |
Spearman test |
| Mean vesicle diameter per bouton (nm) | 50.27 ± 4.14; 51.33 | 51.55 ± 0.61; 51.49 | 46.31 ± 4.70; 45.48 | 45.62 ± 2.41; 45.23 | 42.79 ± 1.52; 42.61 | 40.73 ± 0.99; 40.63 | KW P = 0.0079 |
| Dense-core vesicles | |||||||
| Percentage of boutons containing DCVs | 83.42 ± 19.41; 85.71 | 61.80 ± 27.03; 55.00 | 48.46 ± 12.61; 46.92 | 52.38 ± 20.08; 46.02 | 46.92 ± 19.79; 45.63 | 42.00 ± 17.63; 38.18 | KW P = 0.1958 |
| Mean number of DCVs per bouton | 4.25 ± 2.56; 3.31 | 5.04 ± 5.31; 2.59 | 2.21 ± 0.50; 2.33 | 3.44 ± 0.49; 3.47 | 2.07 ± 0.45; 2.20 | 1.72 ± 0.42; 1.75 | KW P = 0.0217 |
| Mean DCV diameter (nm) | 88.05 ± 5.79; 89.79 | 89.67 ± 4.95; 88.60 | 84.05 ± 8.02; 87.70 | 79.88 ± 4.98; 78.32 | 80.67 ± 4.57; 81.39 | 74.95 ± 7.11; 73.63 | KW P = 0.0311 |
Note: Summary of synaptic vesicles and DCVs parameters collected from the 3D reconstructions of L4 boutons during development. Mean ± SD and median values are given for each age. KW and Spearman correlation tests were used for statistics. Asterisks indicate results from the “2D” distance analysis while double asterisks indicate results from the “3D” distance analysis.
Vesicles Distance Analyses
As already mentioned above, a dramatic rearrangement in the distribution pattern of synaptic vesicles was observed with ongoing maturation. This is reflected by changes in the distance of individual vesicles to the PreAZ and their nearest-neighbor relationship. Figure 5A shows the cumulative distribution of the vesicles within a distance of ≤100 nm from the PreAZ, with a gradual increase in steepness observed over all ages (Table 2). Interestingly, although the mean number of vesicles within the ≤100 nm distance significantly increases by approximately 5-fold (Fig. 5B; from 22.34 ± 28.06 vesicles at P2 to 95.49 ± 24.88 vesicles at P30; P = 0.0289, KW test; Table 2) their proportion to the total number of vesicles per bouton remains constant (∼22% at P2 to ∼24% at P30; P = 0.5380, KW test; Table 2). The number of vesicles close to the PreAZ (≤40 nm) increases by approximately 4-fold (Fig. 5B; 10.22 ± 11.85 vesicles at P2 to 37.24 ± 9.65 vesicles at P30; Table 2) although the average number of docked vesicles (≤10 nm) is not significantly different (Fig. 5B; 1.54 ± 2.04 vesicles at P2 to 7.71 ± 0.71 vesicles at P30; P = 0.0608, KW test; Table 2). No correlation was found between the number of vesicles at ≤10, ≤40, and ≤100 nm distance and the surface area of the PreAZ at the early stages (see Table 2). In addition, the overall distribution of synaptic vesicles throughout the entire terminal was estimated. The number of synaptic vesicles beyond 100 nm from the PreAZ steadily increases by approximately 5-fold from P2 to P30 (Fig. 5C; Table 2). The difference in the slope (∼9% for P2 versus ∼70% for P30 between 100 and 500 nm) of the cumulative distribution lines, which rapidly reach a plateau for the older animals, reflects the developmental rearrangement of synaptic vesicles pools in terms of accumulation and condensation.
Figure 5.

Quantitative analysis of synaptic vesicle distribution. (A) Cumulative distribution of the synaptic vesicles within a 100 nm distance from the PreAZ. Note the steady increase of vesicle numbers in all ages. (B) Bar histograms of the mean number of vesicles in a 10 (docked vesicles), 40 and 100 nm distance from the PreAZ during postnatal development. (C) Cumulative distribution of the vesicles in a 100 to 3000 nm distance from the PreAZ. (D) Line histogram showing the steady decrease in the mean distance between synaptic vesicles per bouton during postnatal development (P = 0.0041, KW test; see Table 2). Error bars represent SD.
Interestingly, for both distance analyses, differences in the number of vesicles tend to be more significant with increasing distance (Table 2). This suggests a progressive composition of the mature vesicle pool by accumulation of vesicles near the PreAZ.
Finally, the nearest-neighbor relationship between individual synaptic vesicles regardless of their location to the PreAZ was calculated (Fig. 5D; see Table 2). A significant decrease from approximately 112 nm (P2) to approximately 44 nm (P30) was observed throughout ongoing development (P = 0.0041, KW test; Table 2). This further supports the rearrangement of the pool of synaptic vesicles from a loose distribution throughout the terminal at P2 to a densely packed pool at P30 (Fig. 3). No correlation between the volume of the synaptic bouton and the total pool of synaptic vesicles was found before P30. Furthermore, no correlation between the volume of the bouton and the vesicle-to-vesicle distance has been observed for all ages investigated (see Table 2) indicating that the rearrangement of the vesicle pool is independent from the size of the bouton.
Vesicles Diameter
A significant decrease of approximately 20% in the mean diameter of vesicles was found from 50.27 ± 4.14 nm at P2 to 40.73 ± 0.99 nm at P30 (Fig. 6A; P = 0.0079, KW test; Table 2). This difference is exemplified for P2 versus P30 by the frequency distribution histogram in Figure 6B (P < 0.0001, Kolmogorov–Smirnov test). Our findings are in line with results by Markus et al. (1987) in the motor-sensory neocortex, which report a decrease in vesicle diameter parallel with an increase in their number.
Figure 6.

Synaptic vesicle diameter. (A) Line histogram of the mean vesicle diameter per synaptic bouton during postnatal development. Note the significant decrease with ongoing maturation of synaptic boutons (P = 0.0079, KW test; see Table 2). Error bars indicate SD. (B) Bar histogram of the normalized distribution of vesicle diameters at P2 (white open bars) versus P30 (solid black bars) synaptic boutons. They are significantly different (P < 0.0001, Kolmogorov–Smirnov test).
Dense-core Vesicles
DCVs are known to contain various neuropeptides, growth factors, but also components involved in the build-up of the AZs (Dieni et al. 2012; Torrealba and Carrasco 2004; Ziv and Garner 2004; reviewed by Vaughn 1989). They were frequently found in synaptic terminals throughout postnatal development. In immature terminals the number of DCVs per individual bouton is higher than for older animals, with a maximum of 19 observed in a P2 synaptic bouton. However, it should be pointed out that the percentage of synaptic boutons containing DCVs gradually declines from approximately 83% at P2 to approximately 42% at P30 going along with a significant reduction in both number and size (Fig. 7; Table 2). The strong presence of DCVs in L4 terminals at early stages of synapse development supports their role in the formation and maturation processes of the PreAZ.
Figure 7.

Dense-core vesicles. (A) Line histogram of the percentage of boutons containing DCVs. (B) Line histogram showing the decrease in the mean number of DCVs per synaptic bouton during development (P = 0.0217, KW test; see Table 2). (C) Line histogram of the mean DCVs diameter per synaptic bouton which significantly decreases during development (P = 0.0311, KW test; see also Table 2). Error bars represent SD.
The Pre- and Postsynaptic AZs
In the adult, per definition, an AZ, the structural equivalent to a functional transmitter release site, is characterized by the typical broadening of the synaptic cleft, the symmetric or asymmetric pre- and postsynaptic densities, and the accumulation of synaptic vesicles located close to the PreAZ (Gray 1959b; 1959a). At all ages investigated prominent asymmetric AZs were always observed. At P2 and P4, dendritic shaft synapses represent the large majority but a significant and steady increase of spine AZs was found with ongoing postnatal development. Although spines are, at first, relatively sparse (∼8.5% and ∼23% of the samples at P2 and P4, respectively versus ∼93% at P30; see Table 1), they already display a broad spectrum, from filopodia and thin spines (Fig. 8A1–A3) to mushroom and branched spines (Fig. 8A4–A7). In L4 of S1 mouse cortex, it was indeed reported that spines display the shape and size of adult spines very early (around P6, White et al. 1997). Due to a small sample size it was not feasible to properly estimate proportions, but filopodia as well as stubby (not shown) and mushroom spines were observed as early as P2.
Figure 8.

Shape and size of different types of spines at the early stages of development. (A) 3D reconstructed spines at P2 and P4. Besides thin (A1, A2) and filopodial spines (A3), also mushroom (A4–A6) and branched (A7) spines were found. For all spines the corresponding PreAZs are given in red; those labelled with asterisks are closest to the mean surface area for the same age. The arrow in A6 points to a second synaptic contact established by the same synaptic bouton. Double arrowheads in A7 indicate protrusions of a branched spine without synaptic contacts. (B) Typical mushroom spine reconstruction from P30. On this dendritic segment 3 synaptic contacts (red areas) were established at different spines and locations. Arrows point to synaptic contacts that are not completely visible in this orientation. Scale bar 0.5 µm.
The second profound change is an increasing number of synapses with a perforated appearance on both pre- and postsynaptic densities. Perforated synapses are present as early as P2, but their proportions do not exceed 6% of the synapses investigated before P14 when an increase is finally observed. At P30, approximately 32% of the synapses show perforations of their AZ (Table 1; Fig. 9A–C) which is in line with similar findings in adult L4 synapses (∼35%, Rollenhagen et al. 2014).
Figure 9.
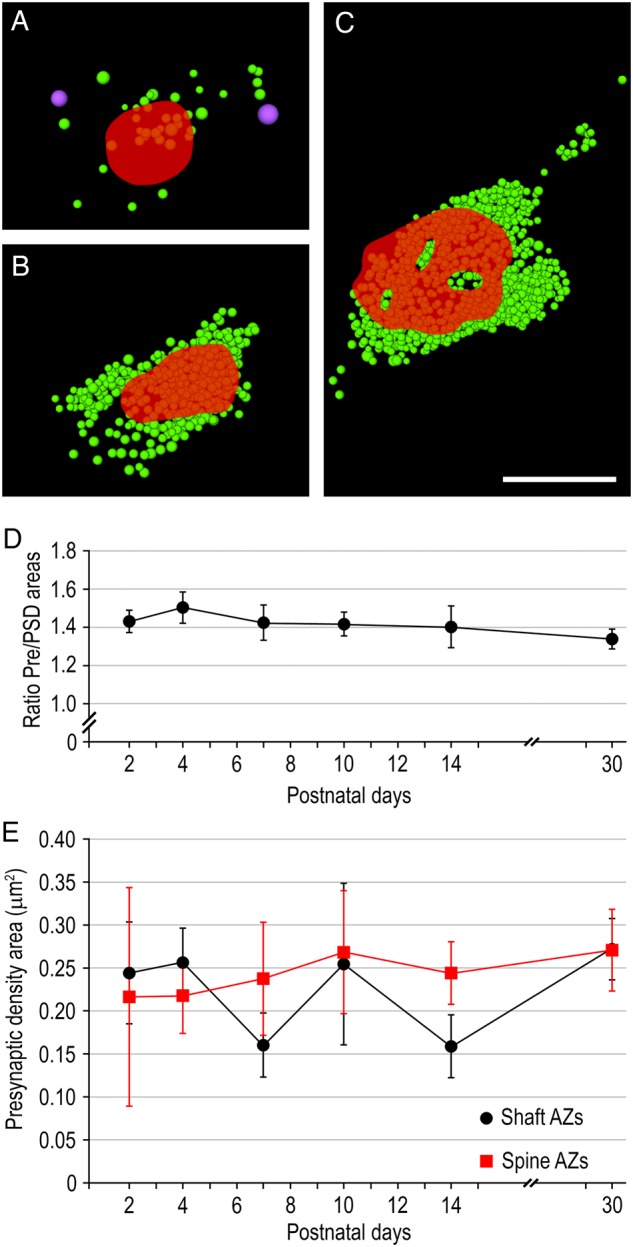
Shape and size of the AZ during postnatal development. (A–C) 3D reconstructions of presynaptic densities (in red) at P2 (A) and P30 (B,C) with their corresponding pool of synaptic (in green) and dense-core (in magenta) vesicles. Note the perforation of the PreAZ in (C). Scale bar 0.5 µm. (D) Line histogram showing the ratio between the PreAZ and the PSD areas per synaptic bouton during postnatal development. (E) Distribution profile of the mean surface area of presynaptic densities during postnatal development shown for presynaptic densities apposed on shafts (in black) or spines (in red). Error bars represent SD.
The width of the synaptic cleft was 16.28 ± 0.27 nm for the lateral and 16.75 ± 0.40 nm for the central region at P2, 16.97 ± 0.58 nm for the lateral and 17.12 ± 1.41 nm for the central region at P30 with no significant change between both ages (see Table 1). This is in line with Markus et al. (1987), but different from previously published findings (18–22 nm at P0 and 25–30 nm after P10 in mouse visual cortex, Li et al. 2010; ∼30 nm in adult rat L4, Rollenhagen et al. 2014).
PreAZ and PSD areas always perfectly overlap in size as indicated by the ratio and the correlation factors (Fig. 9D; Table 1). Notably, the mean surface area of both PreAZ and PSD do not undergo significant changes during postnatal development estimated for all synapses (shaft and spines pooled together: 0.236 ± 0.066 µm2 at P2 to 0.268 ± 0.051 µm2 at P30 for the PreAZ; P = 0.5309, KW test; Table 1). The mean surface area of the PreAZs opposing spines is similar in size when compared with those on dendritic shafts (Fig. 9E; Table 1) although spines form a much smaller compartment than dendritic shafts. Hence spine synapses could be more efficient in synaptic transmission than shaft synapses.
Finally, no correlation between the mean surface area of synaptic boutons and that of AZs was found for all ages investigated (Table 1), suggesting that the size of the AZ is an independent structural parameter.
Discussion
In contrast to the structural and functional synaptic organization in adult rodent barrel cortex (Egger et al. 1999; Lübke et al. 2000, 2003; Feldmeyer et al. 2002, 2005, 2006; Beierlein et al. 2003; Silver et al. 2003; Lefort et al. 2009; Meyer, Wimmer, Oberlaender, et al. 2010; Meyer, Wimmer, Hemberger; et al. 2010; Wimmer et al. 2010; Oberlaender et al. 2012; Kuhlman et al. 2014; Reyes-Puerta et al. 2014; Qi and Feldmeyer 2015; reviewed by Lübke and Feldmeyer 2007; Feldmeyer et al. 2013), our knowledge about synapses and their respective synaptic connections in early cortical networks is rather limited (Daw et al. 2007; Frick et al. 2007, 2008; Ashby and Isaac 2011).
The present study is the first coherent quantitative description of the structural characteristics and changes of cortical synapses during the first postnatal month. While some structural parameters undergo profound changes and adjustments, which occur in parallel to the barrel and L4 formation, spinogenesis and the onset of whisking, others remain relatively constant (Fig. 10). In particular, the size of the presynaptic bouton decreases significantly, whereas that of the AZs remains unchanged, although with a late reshaping. The rearrangement of the pool of synaptic vesicles from a loose distribution with only a small releasable pool towards a dense organization at the PreAZ is the most important structural modification. The structural alterations underlie changes in intrinsic electrophysiological properties and paired-pulse behavior in early cortical networks to adulthood (Feldmeyer et al. 1999; Frick et al. 2007, 2008; Ashby and Isaac 2011). Moreover, the large variability in almost all the parameters probably reflects (1) differences in the structural and functional maturation coexisting at the same age, and (2) the different origins of synapses in L4.
Figure 10.

Summary diagram of the time scale of events in cortico- and synaptogenesis. Summary of the structural changes of synapses observed in this study in comparison to L4 and barrel formation (Catalano et al. 1996) and the onset of whisking (Landers and Zeigler 2006) during postnatal development in the rat barrel cortex.
Signal Transduction in the Early Neocortical Network
Information processing in an early cortical network, in particular during the first postnatal week, is induced and mediated via electrical synapses by gap-junctional coupling (Peinado et al. 1993; Peinado 2001; reviewed by Sutor and Hagerty 2005; Niculescu and Lohmann 2014). In the developing rat neocortex, a high level of gap-junctional coupling was observed between P5 and P12 with a steady decline at P18 (Peinado et al. 1993; Peinado 2001). Nevertheless, it has to be mentioned here that gap-junctional coupling is found between certain types of GABAergic interneurons in the adult neocortex forming highly specific independent networks (Gibson et al. 1999; Beierlein et al. 2003; reviewed by Hestrin and Galarreta 2005). Throughout early postnatal development, the high level of gap junctions goes in parallel with a progressive rearrangement of the neuropil and the early formation of synapses starting at P2 (this study; see also Blue and Parnavelas 1983b; Micheva and Beaulieu 1996). Thus, during a transition window when the network switches from electrical to chemical transmission, gap-junctional coupling, and synapses structurally and functionally coexist. Since during early cortex development gap-junctions drive network activity via electrical coupling (Peinado 2001; reviewed by Niculescu and Lohmann 2014), they may help to induce the formation of synaptic structures and connections. However, after their dramatic decrease at P18 (Peinado 2001) a fine tuning of synapses, in particular a reshaping of the AZ and an ongoing addition and reorganization of synaptic vesicles, was observed which will be discussed in detail below.
Quantitative Evaluation of Synaptic Structural Parameters
So far several studies have investigated the development of cortical synapses at the EM level, but focused on certain aspects such as their density and distribution pattern (rat: Aghajanian and Bloom 1967; Dyson and Jones 1980; Blue and Parnavelas 1983b; Markus et al. 1987; Micheva and Beaulieu 1996; mouse: De Felipe et al. 1997; cat: Cragg 1972, 1975; monkey: Rakic et al. 1986; Bourgeois et al. 1989; Zecevic and Rakic 1991). Among them, only a few studies have further quantified other structural parameters such as the size of synaptic boutons (Dyson and Jones 1980), the AZ size (Dyson and Jones 1980; Blue and Parnavelas 1983b; Markus et al. 1987; Bourgeois et al. 1989), the synaptic cleft width (Markus et al. 1987), or the number and size of synaptic vesicles (Dyson and Jones 1980; Blue and Parnavelas 1983b; Markus et al. 1987). All these analyses were based on single ultrathin sections. Such 2D measurements are inaccurate because the extension and shape of a given structure is not completely followed as in consecutive serial sections (this study). Quantitative 3D models of synaptic structures are, to date, the best solution to estimate synaptic parameters such as the geometry of synaptic boutons, the surface area of AZs or the number of synaptic vesicles and their distribution profile, which can then be used for realistic numerical and Monte Carlo simulations.
It should be mentioned that although synapses are composed of nearly the same structural subelements, it is their individual composition that critically determines their function. Synapses are unique entities perfectly adapted to the network in which they are embedded (hippocampus CA1: Harris and Sultan 1995; hippocampus CA3: Rollenhagen et al. 2007; neocortex: Rollenhagen et al. 2014; cerebellum: Xu-Friedman and Regehr 2003; calyx of Held: Sätzler et al. 2002; reviewed by Rollenhagen and Lübke 2006). Thus it is difficult to compare the structural parameters of synapses from different brain regions.
Refinement of Synaptic Structural Parameters During Postnatal Development
Size and Shape of AZs
In the adult, the shape and size of the AZ represent key parameters that critically determine synaptic transmission and plasticity. Here, the average size of the AZ was similar to that reported for adult L4 and other CNS synapses comparable in size, although a high variability was observed in our study and adult synapses (Rollenhagen et al. 2014; reviewed by Xu-Friedman and Regehr 2004; Rollenhagen and Lübke 2006). This variability may partially contribute to the wide distributions of release probability, reliability and quantal size observed at developing and almost mature L4 synapses (Feldmeyer et al. 1999, 2002, 2006; Silver et al. 2003; Frick et al. 2007, 2008; Ashby and Isaac 2011; Qi and Feldmeyer 2015). In addition, it has been shown for hippocampal CA1 synapses that both the size and shape of the AZ drive reliability, strength, and RRP size (Matz et al. 2010; Freche et al. 2011; Holderith et al. 2012). Large AZs have a much higher release probability, RRP and a higher number of presynaptic Ca2+ channels than smaller AZs (Holderith et al. 2012). Whether the size of the AZ in developing synapses is as determinant in synaptic behavior as in the adult is arguable, because of the profound changes in the composition and accumulation of various pre- and postsynaptic synaptic proteins and channels not yet established or due to their rearrangement during early postnatal development (Südhof 2012).
As early as P2 synaptic boutons have prominent pre- and opposing postsynaptic densities. As mentioned above, the average size of the AZ does not significantly change with age. However, at the end of the second postnatal week, the proportion of AZs with perforations of their pre- and postsynaptic density starts to increase, and finally represents a third of the total population comparable to published values in adult L4 synapses (Rollenhagen et al. 2014). It has been shown that perforations of PSDs contribute to high synaptic efficacy in adult hippocampal synapses; in line with a strong correlation between AZs area, perforated PSDs and the number of docked and reserve pool vesicles (Geinisman et al. 1991; Geinisman 1993). Both the total number of docked and reserve pool vesicles at perforated AZs significantly exceeds that of AZs with a nonperforated PSD (Nava et al. 2014). Notably, this structural refinement of the AZ with ongoing development may partially contribute to changes in synaptic reliability, efficacy, strength, and short-term plasticity as observed in developing L5–L5 excitatory connections (Frick et al. 2007, 2008).
Although shaft synapses represent the majority at P2 also a few spine synapses are already established in L4 rat barrel cortex. This is much earlier than the spinogenesis starting as late as P9 reported at mouse L4 spiny stellate neurons by Ashby and Isaac (2011). The profound increase in spine density by approximately 10-fold from P2 onwards is accompanied by an increase in spine apparatus occurrence (from ∼6% at P4 to ∼43% at P30). It has been hypothesized, that spines containing this structure are more mobile. Spine motility may be required to ease the establishment of a contact with a presynaptic bouton. This steady add-on of spine connections may help in the establishment and maintenance of an early cortical network and its reshaping until adulthood, and, as a consequence, modulate changes in the functional properties of neurons and short- and long-term plasticity during development (Gray 1959b; 1959a; Deller et al. 2003; Konur and Yuste 2004; Holtmaat et al. 2005; Umeda et al. 2005). Hence, it may be speculated that the early appearance (P2) of spines with a prominent AZ and the early presence of a spine apparatus may partially contribute to functional changes in synaptic efficacy, strength, and reliability in an early L4 network in rat.
Rearrangement of the Pool of Synaptic Vesicles
During development, the pool of synaptic vesicles undergoes the most pronounced changes (Fig. 3). Besides a significant increase in number, a gradual decrease in the diameter was observed in-line with Markus et al. (1987). By changing the amount of releasable neurotransmitters, the size of synaptic vesicles may constitute another mechanism in the regulation and modulation of synaptic function (Hu et al. 2008; Qu et al. 2009).
Strikingly, a rearrangement of the vesicle pool occurs by progressive accumulation of vesicles near the PreAZ, with also a shift from a loose to a highly densely packed organization. With the exception of docked vesicles, no clear morphological correlate can be defined for the 3 functional vesicle pools (RRP, RP, and reserve pool; reviewed by Rizzoli and Betz 2005; Denker and Rizzoli 2010). However, docked and primed vesicles are regarded to represent the RRP (Schikorski and Stevens 2001; Watanabe et al. 2013; reviewed by Denker and Rizzoli 2010). Taken the ≤40 nm distance measurements (Table 2), we tried to estimate this particular pool. A putative RRP was already present as early as P2 and increases by nearly 4-fold at P30. The steady add-on and rapid refill of vesicles to the putative RRP from the RP is a prerequisite for repetitive or high-frequency firing described for mature L4 synaptic connections (Feldmeyer et al. 1999, 2002, 2006; Watanabe et al. 2013; Schikorski 2014; reviewed by Denker and Rizzoli 2010). Such a developmental maturation and refill of the RRP has been reported for cultured neocortical neurons (Mohrmann et al. 2003), resulting in an improved synaptic efficacy during strong, repetitive stimulation.
Vesicles beyond 40 nm from the PreAZ thus constitute the putative RP and reserve pool which also progressively increase with age (Table 2) in line with findings in developing cultured hippocampal neurons (Mozhayeva et al. 2002). Based on the sparse distribution of the vesicles beyond 40 nm in early phases of development it may be speculated that the RP and reserve pool are constituted later than the RRP.
Thalamocortical versus Corticocortical Synaptic Inputs in L4
The main sources of synaptic inputs to L4 spiny neurons during early development include TC afferents from the ventroposterior medial nucleus, corticocortical (CC) established mainly by excitatory L4 neurons (reviewed by Feldmeyer 2012) and synapses made by transient subplate neurons (Schlaggar and O'Leary 1994; Zhao et al. 2009; Liao and Lee 2012; reviewed by Kanold and Luhmann 2010). The morphological properties, density and distribution pattern of synaptic boutons from subplate neurons terminating on L4 neurons are largely unknown, but they may contribute to the large variability of the synaptic profiles observed in this study. Although TC afferents constitute only a small fraction of synaptic contacts in adult L4 (10–20%, Benshalom and White 1986), their proportion during early development might be substantially higher, since TC inputs are established prior to CC synapses (Schlaggar and O'Leary 1994; Catalano et al. 1996; Isaac et al. 1997; White et al. 1997; Miller et al. 2001; Daw et al. 2007; Ashby and Isaac 2011; reviewed by Erzurumlu and Gaspar 2012). Moreover, TC terminals have a larger range in size than CC terminals (Kharazia and Weinberg 1994; Nahmani and Erisir 2005). We observed a severe decrease in bouton size while the proportion of TC synapses progressively declines compared with CC connections. Thus, during the first week of development, our data set may reflect the TC synaptic activity.
The thalamic drive of the cortex is highly influential (Benshalom and White 1986; Peters and Payne 1993; Gil et al. 1999; Bruno and Sakmann 2006). However, on the level of individual synapses, it has been shown that TC and CC synapses are similar in strength and dendritic location (Schoonover et al. 2014). Thus, they may be considered as relatively homogeneous in terms of structure. Then how to morphologically differentiate TC from CC synapses? Vesicular glutamate transporter type 2 immunolabeling (Nahmani and Erisir 2005; Coleman et al. 2010) or tracer injections into the VPM (Kharazia and Weinberg 1994; da Costa and Martin 2011) allow TC afferents identification. However, those methods interfere with the quantification of fine synaptic structures, such as the AZ and synaptic vesicles, because of the DAB reaction product diffusing and masking entirely the interior of the labeled element.
In summary, our observations and quantifications reflect the general state of development of excitatory synapses in L4 of the barrel cortex, regardless whether they are TC or CC synapses, or even synapses established by subplate neurons. Furthermore, our results reveal that the reorganization of the vesicles pool, most important in synapse maturation, always occurs independently of the volume of the bouton. So the “size” parameter of a presynaptic bouton and its related origin is not important for the process of synapse maturation.
Supplementary Material
Supplementary material can be found at http://www.cercor.oxfordjournals.org/online.
Funding
Funding to pay the Open Access publication charges for this article was provided by the Research Centre Jülich GmbH.
Supplementary Material
Notes
We would like to thank Brigitte Marshallsay whose excellent technical assistance was always very much appreciated, Drs. Gabriele Radnikow, Nicola Palomero-Gallagher, and Prof. Dirk Feldmeyer for critically reading and helpful comments on a preversion of the manuscript; as well as Prof. John Parnavelas for having provided us with additional EM blocks from younger rats. This work was supported by a grant of the Deutsche Forschungsgemeinschaft DFG (J.L.). Conflict of Interest: The authors declare no competing financial interests.
References
- Aghajanian GK, Bloom FE. 1967. The formation of synaptic junctions in developing rat brain: a quantitative electron microscopic study. Brain Res. 6:716–727. [DOI] [PubMed] [Google Scholar]
- Armstrong-James M, Fox K, Das-Gupta A. 1992. Flow of excitation within rat barrel cortex on striking a single vibrissa. J Neurophysiol. 68:1345–1358. [DOI] [PubMed] [Google Scholar]
- Ashby MC, Isaac JT. 2011. Maturation of a recurrent excitatory neocortical circuit by experience-dependent unsilencing of newly formed dendritic spines. Neuron. 70:510–521. [DOI] [PMC free article] [PubMed] [Google Scholar]
- Beierlein M, Gibson JR, Connors BW. 2003. Two dynamically distinct inhibitory networks in layer 4 of the neocortex. J Neurophysiol. 90:2987–3000. [DOI] [PubMed] [Google Scholar]
- Benshalom G, White EL. 1986. Quantification of thalamocortical synapses with spiny stellate neurons in layer IV of mouse somatosensory cortex. J Comp Neurol. 253:303–314. [DOI] [PubMed] [Google Scholar]
- Blue ME, Parnavelas JG. 1983a. The formation and maturation of synapses in the visual cortex of the rat. I. Qualitative analysis. J Neurocytol. 12:599–616. [DOI] [PubMed] [Google Scholar]
- Blue ME, Parnavelas JG. 1983b. The formation and maturation of synapses in the visual cortex of the rat. II. Quantitative analysis. J Neurocytol. 12:697–712. [DOI] [PubMed] [Google Scholar]
- Bourgeois JP, Jastreboff PJ, Rakic P. 1989. Synaptogenesis in visual cortex of normal and preterm monkeys: evidence for intrinsic regulation of synaptic overproduction. Proc Natl Acad Sci USA. 86:4297–4301. [DOI] [PMC free article] [PubMed] [Google Scholar]
- Bruno RM, Sakmann B. 2006. Cortex is driven by weak but synchronously active thalamocortical synapses. Science. 312:1622–1627. [DOI] [PubMed] [Google Scholar]
- Catalano SM, Robertson RT, Killackey HP. 1996. Individual axon morphology and thalamocortical topography in developing rat somatosensory cortex. J Comp Neurol. 367:36–53. [DOI] [PubMed] [Google Scholar]
- Coleman JE, Nahmani M, Gavornik JP, Haslinger R, Heynen AJ, Erisir A, Bear MF. 2010. Rapid structural remodeling of thalamocortical synapses parallels experience-dependent functional plasticity in mouse primary visual cortex. J Neurosci. 30:9670–9682. [DOI] [PMC free article] [PubMed] [Google Scholar]
- Constantinople CM, Bruno RM. 2013. Deep cortical layers are activated directly by thalamus. Science. 340:1591–1594. [DOI] [PMC free article] [PubMed] [Google Scholar]
- Cragg BG. 1972. The development of synapses in cat visual cortex. Invest Ophthalmol. 11:377–385. [PubMed] [Google Scholar]
- Cragg BG. 1975. The development of synapses in the visual system of the cat. J Comp Neurol. 160:147–166. [DOI] [PubMed] [Google Scholar]
- da Costa NM, Martin KA. 2011. How thalamus connects to spiny stellate cells in the cat’s visual cortex. J Neurosci. 31:2925–2937. [DOI] [PMC free article] [PubMed] [Google Scholar]
- Daw MI, Scott HL, Isaac JT. 2007. Developmental synaptic plasticity at the thalamocortical input to barrel cortex: mechanisms and roles. Mol Cell Neurosci. 34:493–502. [DOI] [PMC free article] [PubMed] [Google Scholar]
- De Felipe J, Marco P, Fairén A, Jones EG. 1997. Inhibitory synaptogenesis in mouse somatosensory cortex. Cereb Cortex. 7:619–634. [DOI] [PubMed] [Google Scholar]
- Deller T, Korte M, Chabanis S, Drakew A, Schwegler H, Stefani GG, Zuniga A, Schwarz K, Bonhoeffer T, Zeller R et al. 2003. Synaptopodin-deficient mice lack a spine apparatus and show deficits in synaptic plasticity. Proc Natl Acad Sci USA. 100:10494–10499. [DOI] [PMC free article] [PubMed] [Google Scholar]
- Denker A, Rizzoli SO. 2010. Synaptic vesicle pools: an update. Front Synaptic Neurosci. 2:135 10.3389/fnsyn.2010.00135. eCollection 2010. [DOI] [PMC free article] [PubMed] [Google Scholar]
- Dieni S, Matsumoto T, Dekkers M, Rauskolb S, Ionescu MS, Deogracias R, Gundelfinger ED, Kojima M, Nestel S, Frotscher M et al. 2012. BDNF and its pro-peptide are stored in presynaptic dense core vesicles in brain neurons. J Cell Biol. 196:775–788. [DOI] [PMC free article] [PubMed] [Google Scholar]
- Dyson SE, Jones DG. 1980. Quantitation of terminal parameters and their inter-relationships in maturing central synapses: a perspective for experimental studies. Brain Res. 183:43–59. [DOI] [PubMed] [Google Scholar]
- Egger V, Feldmeyer D, Sakmann B. 1999. Coincidence detection and changes of synaptic efficacy in spiny stellate neurons in rat barrel cortex. Nat Neurosci. 2:1098–1105. [DOI] [PubMed] [Google Scholar]
- Erzurumlu RS, Gaspar P. 2012. Development and critical period plasticity of the barrel cortex. Eur J Neurosci. 35:1540–1553. [DOI] [PMC free article] [PubMed] [Google Scholar]
- Feldmeyer D. 2012. Excitatory neuronal connectivity in the barrel cortex. Front Neuroanat. 6:24 10.3389/fnana.2012.00024. eCollection 2012. [DOI] [PMC free article] [PubMed] [Google Scholar]
- Feldmeyer D, Brecht M, Helmchen F, Petersen CC, Poulet JF, Staiger JF, Luhmann HJ, Schwarz C. 2013. Barrel cortex function. Prog Neurobiol. 103:3–27. [DOI] [PubMed] [Google Scholar]
- Feldmeyer D, Egger V, Lübke J, Sakmann B. 1999. Reliable synaptic connections between pairs of excitatory layer 4 neurones within a single barrel of developing rat somatosensory cortex. J Physiol. 521:169–190. [DOI] [PMC free article] [PubMed] [Google Scholar]
- Feldmeyer D, Lübke J, Sakmann B. 2006. Efficacy and connectivity of intracolumnar pairs of layer 2/3 pyramidal cells in the barrel cortex of juvenile rats. J Physiol. 575:583–602. [DOI] [PMC free article] [PubMed] [Google Scholar]
- Feldmeyer D, Lübke J, Silver RA, Sakmann B. 2002. Synaptic connections between layer 4 spiny neurone-layer 2/3 pyramidal cell pairs in juvenile rat barrel cortex: physiology and anatomy of interlaminar signalling within a cortical column. J Physiol. 538:803–822. [DOI] [PMC free article] [PubMed] [Google Scholar]
- Feldmeyer D, Roth A, Sakmann B. 2005. Monosynaptic connections between pairs of spiny stellate cells in layer 4 and pyramidal cells in layer 5A indicate that lemniscal and paralemniscal afferent pathways converge in the infragranular somatosensory cortex. J Neurosci. 25:3423–3431. [DOI] [PMC free article] [PubMed] [Google Scholar]
- Fiala JC, Feinberq M, Popov V, Harris KM. 1998. Synaptogenesis via dendritic filopodia in developing hippocampal area CA1. J Neurosci. 18:8900–8911. [DOI] [PMC free article] [PubMed] [Google Scholar]
- Freche D, Pannasch U, Rouach N, Holcman D. 2011. Synapse geometry and receptor dynamics modulate synaptic strength. PLoS One. 6:e25122 10.1371/journal.pone.0025122. [DOI] [PMC free article] [PubMed] [Google Scholar]
- Frick A, Feldmeyer D, Helmstaedter M, Sakmann B. 2008. Monosynaptic connections between pairs of L5A pyramidal neurons in columns of juvenile rat somatosensory cortex. Cereb Cortex. 18:397–406. [DOI] [PubMed] [Google Scholar]
- Frick A, Feldmeyer D, Sakmann B. 2007. Postnatal development of synaptic transmission in local networks of L5A pyramidal neurons in rat somatosensory cortex. J Physiol. 585:103–106. [DOI] [PMC free article] [PubMed] [Google Scholar]
- Geinisman Y. 1993. Perforated axospinous synapses with multiple, completely partitioned transmission zones: probable structural intermediates in synaptic plasticity. Hippocampus. 3:417–433. [DOI] [PubMed] [Google Scholar]
- Geinisman Y, deToledo-Morrell L, Morrell F. 1991. Induction of long-term potentiation is associated with an increase in the number of axospinous synapses with segmented postsynaptic densities. Brain Res. 566:77–88. [DOI] [PubMed] [Google Scholar]
- Gibson JR, Beierlein M, Connors BW. 1999. Two networks of electrically coupled inhibitory neurons in neocortex. Nature. 402:75–79. [DOI] [PubMed] [Google Scholar]
- Gil Z, Connors BW, Amitai Y. 1999. Efficacy of thalamocortical and intracortical synaptic connections: quanta, innervation, and reliability. Neuron. 23:385–397. [DOI] [PubMed] [Google Scholar]
- Gray EG. 1959a. Axo-somatic and axo-dendritic synapses of the cerebral cortex: an electron microscope study. J Anat. 93:420–433. [PMC free article] [PubMed] [Google Scholar]
- Gray EG. 1959b. Electron microscopy of synaptic contacts on dendrite spines of the cerebral cortex. Nature. 183:1592–1593. [DOI] [PubMed] [Google Scholar]
- Harris KM, Jensen FE, Tsao B. 1992. Three-dimensional structure of dendritic spines and synapses in rat hippocampus (CA1) at postnatal day 15 and adult ages: implications for the maturation of synaptic physiology and long-term potentiation. J Neurosci. 12:2685–2705. [DOI] [PMC free article] [PubMed] [Google Scholar]
- Harris KM, Sultan P. 1995. Variation in the number, location and size of synaptic vesicles provides an anatomical basis for the nonuniform probability of release at hippocampal CA1 synapses. Neuropharmacology. 34:1387–1395. [DOI] [PubMed] [Google Scholar]
- Hestrin S, Galarreta M. 2005. Electrical synapses define networks of neocortical GABAergic neurons. Trends Neurosci. 28:304–309. [DOI] [PubMed] [Google Scholar]
- Holcomb PS, Hoffpauir BK, Hoyson MC, Jackson DR, Deerinck TJ, Marrs GS, Dehoff M, Wu J, Ellisman MH, Spirou GA. 2013. Synaptic inputs compete during rapid formation of the calyx of Held: a new model system for neural development. J Neurosci. 33:12954–12969. [DOI] [PMC free article] [PubMed] [Google Scholar]
- Holderith N, Lorincz A, Katona G, Rózsa B, Kulik A, Watanabe M, Nusser Z. 2012. Release probability of hippocampal glutamatergic terminals scales with the size of the active zone. Nat Neurosci. 15:988–997. [DOI] [PMC free article] [PubMed] [Google Scholar]
- Holtmaat AJ, Trachtenberg JT, Wilbrecht L, Shepherd GM, Zhang X, Knott GW, Svoboda K. 2005. Transient and persistent dendritic spines in the neocortex in vivo. Neuron. 45:279–291. [DOI] [PubMed] [Google Scholar]
- Hu Y, Qu L, Schikorski T. 2008. Mean synaptic vesicle size varies among individual excitatory hippocampal synapses. Synapse. 62:953–957. 10.1002/syn.20567. [DOI] [PubMed] [Google Scholar]
- Isaac JT, Crair MC, Nicoll RA, Malenka RC. 1997. Silent synapses during development of thalamocortical inputs. Neuron. 18:269–280. [DOI] [PubMed] [Google Scholar]
- Kanold PO, Luhmann HJ. 2010. The subplate and early cortical circuits. Annu Rev Neurosci. 33:23–48. [DOI] [PubMed] [Google Scholar]
- Kharazia VN, Weinberg RJ. 1994. Glutamate in thalamic fibers terminating in layer IV of primary sensory cortex. J Neurosci. 14:6021–6032. [DOI] [PMC free article] [PubMed] [Google Scholar]
- Konur S, Yuste R. 2004. Imaging the motility of dendritic protrusions and axon terminals: roles in axon sampling and synaptic competition. Mol Cell Neurosci. 27:427–440. [DOI] [PubMed] [Google Scholar]
- Korogod N, Petersen CC, Knott GW. 2015. Ultrastructural analysis of adult mouse neocortex comparing aldehyde perfusion with cryo fixation. eLife. 10.7554/eLife05793. [DOI] [PMC free article] [PubMed] [Google Scholar]
- Kuhlman SJ, O'Connor DH, Fox K, Svoboda K. 2014. Structural plasticity within the barrel cortex during initial phases of whisker-dependent learning. J Neurosci. 34:6078–6083. [DOI] [PMC free article] [PubMed] [Google Scholar]
- Landers M, Zeigler H. 2006. Development of rodent whisking: trigeminal input and central pattern generation. Somatosens Mot Res. 23:1–10. [DOI] [PubMed] [Google Scholar]
- Lefort S, Tomm C, Floyd Sarria JC, Petersen CC. 2009. The excitatory neuronal network of the C2 barrel column in mouse primary somatosensory cortex. Neuron. 61:301–316. [DOI] [PubMed] [Google Scholar]
- Li M, Cui Z, Niu Y, Liu B, Fan W, Yu D, Deng J. 2010. Synaptogenesis in the developing mouse visual cortex. Brain Res Bull. 81:107–113. [DOI] [PubMed] [Google Scholar]
- Liao CC, Lee LJ. 2012. Evidence for structural and functional changes of subplate neurons in developing rat barrel cortex. Brain Struct Funct. 217:275–292. [DOI] [PubMed] [Google Scholar]
- Lübke J, Egger V, Sakmann B, Feldmeyer D. 2000. Columnar organization of dendrites and axons of single and synaptically coupled excitatory spiny neurons in layer 4 of the rat barrel cortex. J Neurosci. 20:5300–5311. [DOI] [PMC free article] [PubMed] [Google Scholar]
- Lübke J, Feldmeyer D. 2007. Excitatory signal flow and connectivity in a cortical column: focus on barrel cortex. Brain Struct Funct. 212:3–17. [DOI] [PubMed] [Google Scholar]
- Lübke J, Roth A, Feldmeyer D, Sakmann B. 2003. Morphometric analysis of the columnar innervation domain of neurons connecting layer 4 and layer 2/3 of juvenile rat barrel cortex. Cereb Cortex. 13:1051–1063. [DOI] [PubMed] [Google Scholar]
- Markus EJ, Petit TL, LeBoutillier JC. 1987. Synaptic changes during development and aging. Dev Brain Res. 35:239–248. [DOI] [PubMed] [Google Scholar]
- Matz J, Gilyan A, Kolar A, McCarvill T, Krueger SR. 2010. Rapid structural alterations of the active zone lead to sustained changes in neurotransmitter release. Proc Natl Acad Sci USA. 107:8836–8841. [DOI] [PMC free article] [PubMed] [Google Scholar]
- Meyer HS, Wimmer VC, Hemberger M, Bruni RM, de Kock CP, Frick A, Sakmann B, Helmstaedter M. 2010. Cell type-specific thalamic innervation in a column of rat vibrissal cortex. Cereb Cortex. 20:2287–2303. [DOI] [PMC free article] [PubMed] [Google Scholar]
- Meyer HS, Wimmer VC, Oberlaender M, de Kock CP, Sakmann B, Helmstaedter M. 2010. Number and laminar distribution of neurons in a thalamocortical projection column of rat vibrissal cortex. Cereb Cortex. 20:2277–2286. [DOI] [PMC free article] [PubMed] [Google Scholar]
- Micheva KD, Beaulieu C. 1996. Quantitative aspects of synaptogenesis in the rat barrel field cortex with special reference to GABA circuitry. J Comp Neurol. 373:340–354. [DOI] [PubMed] [Google Scholar]
- Miller B, Blake NM, Erinjeri JP, Reistad CE, Sexton T, Admire P, Woolsey TA. 2001. Postnatal growth of intrinsic connections in mouse barrel cortex. J Comp Neurol. 436:17–31. [PubMed] [Google Scholar]
- Mohrmann R, Lessmann V, Gottmann K. 2003. Developmental maturation of synaptic vesicle cycling as a distinctive feature of central glutamatergic synapses. Neuroscience. 117:7–18. [DOI] [PubMed] [Google Scholar]
- Mozhayeva MG, Sara Y, Liu X, Kavalali ET. 2002. Development of vesicle pools during maturation of hippocampal synapses. J Neurosci. 22:654–665. [DOI] [PMC free article] [PubMed] [Google Scholar]
- Nahmani M, Erisir A. 2005. VGluT2 immunochemistry identifies thalamocortical terminals in layer 4 of adult and developing visual cortex. J Comp Neurol. 484:458–473. [DOI] [PubMed] [Google Scholar]
- Nava N, Chen F, Wegener G, Popoli M, Nyengaard JR. 2014. A new efficient method for synaptic vesicle quantification reveals differences between medial prefrontal cortex perforated and nonperforated synapses. J Comp Neurol. 522:284–297. [DOI] [PubMed] [Google Scholar]
- Niculescu D, Lohmann C. 2014. Gap junctions in developing thalamic and neocortical neuronal networks. Cereb Cortex. 24:3097–3106. [DOI] [PMC free article] [PubMed] [Google Scholar]
- Oberlaender M, de Kock CP, Bruno RM, Ramirez A, Meyer HS, Dercksen VJ, Helmstaedter M, Sakmann B. 2012. Cell type-specific three-dimensional structure of thalamocortical circuits in a column of rat vibrissal cortex. Cereb Cortex. 22:2375–2391. [DOI] [PMC free article] [PubMed] [Google Scholar]
- Peinado A. 2001. Immature neocortical neurons exist as extensive syncytial networks linked by dendrodendritic electrical connections. J Neurophysiol. 85:620–629. [DOI] [PubMed] [Google Scholar]
- Peinado A, Yuste R, Katz LC. 1993. Extensive dye coupling between rat neocortical neurons during the period of circuit formation. Neuron. 10:103–114. [DOI] [PubMed] [Google Scholar]
- Peters A, Payne BR. 1993. Numerical relationships between geniculocortical afferents and pyramidal cell modules in cat primary visual cortex. Cereb Cortex. 3:69–78. [DOI] [PubMed] [Google Scholar]
- Popov VI, Stewart MG. 2009. Complexity of contacts between synaptic boutons and dendritic spines in rat hippocampus: three-dimensional reconstructions from serial ultrathin sections in vivo. Synapse. 63:369–377. [DOI] [PubMed] [Google Scholar]
- Qi G, Feldmeyer D. 2015. Dendritic region-specific formation of synapses between excitatory layer 4 neurons and layer 6 pyramidal cells. Cereb Cortex. 10.1093/cercor/bhu334. Epub ahead of print 15 January 2015. [DOI] [PubMed] [Google Scholar]
- Qu L, Akbergenova Y, Hu Y, Schikorski T. 2009. Synapse-to-synapse variation in mean synaptic vesicle size and its relashionship with synaptic morphology and function. J Comp Neurol. 514:343–352. [DOI] [PubMed] [Google Scholar]
- Rakic P, Bourgeois JP, Eckenhoff MF, Zecevic N, Goldman-Rakic PS. 1986. Concurrent overproduction of synapses in diverse regions of the primate cerebral cortex. Science. 232:232–235. [DOI] [PubMed] [Google Scholar]
- Reyes-Puerta V, Sun JJ, Kim S, Kilb W, Luhmann HJ. 2014. Laminar and columnar structure of sensory-evoked multineuronal spike sequence in adult rat barrel cortex in vivo. Cereb Cortex. 25:2001–2021. [DOI] [PubMed] [Google Scholar]
- Reynolds ES. 1963. The use of lead citrate at high pH as an electron-opaque stain in electron microscopy. J Cell Biol. 17:208–212. [DOI] [PMC free article] [PubMed] [Google Scholar]
- Risher WC, Ustunkaya T, Singh Alvarado J, Eroglu C. 2014. Rapid Golgi analysis method for efficient and unbiased classification of dendritic spines. PLoS One. 9:e107591 10.1371/journal.pone.0107591. eCollection 2014. [DOI] [PMC free article] [PubMed] [Google Scholar]
- Rizzoli SO, Betz WJ. 2005. Synaptic vesicle pools. Nat Rev Neurosci. 6:57–69. [DOI] [PubMed] [Google Scholar]
- Rollenhagen A, Klook K, Sätzler K, Qi G, Anstötz M, Feldmeyer D, Lübke JHR. 2014. Structural determinants underlying the high efficacy of synaptic transmission and plasticity at synaptic boutons in layer 4 of the adult rat barrel cortex. Brain Struct Funct. 220:3185–3209. [DOI] [PubMed] [Google Scholar]
- Rollenhagen A, Lübke JHR. 2006. The morphology of excitatory central synapses: from structure to function. Cell Tissue Res. 326:221–237. [DOI] [PubMed] [Google Scholar]
- Rollenhagen A, Sätzler K, Rodríguez EP, Jonas P, Frotscher M, Lübke JHR. 2007. Structural determinants of transmission at large hippocampal mossy fiber synapses. J Neurosci. 27:10434–10444. [DOI] [PMC free article] [PubMed] [Google Scholar]
- Sätzler K, Söhl LF, Bollmann JH, Borst JG, Frotscher M, Sakmann B, Lübke JHR. 2002. Three-dimensional reconstruction of a calyx of Held and its postsynaptic principal neuron in the medial nucleus of the trapezoid body. J Neurosci. 22:10567–10579. [DOI] [PMC free article] [PubMed] [Google Scholar]
- Schikorski T. 2014. Readily releasable vesicles recycle at the active zone of hippocampal synapses. Proc Natl Acad Sci USA. 111:5415–5420. [DOI] [PMC free article] [PubMed] [Google Scholar]
- Schikorski T, Stevens CF. 2001. Morphological correlates of functionally defined synaptic vesicle populations. Nat Neurosci. 4:391–395. [DOI] [PubMed] [Google Scholar]
- Schlaggar BL, O'Leary DD. 1994. Early development of the somatotopic map and barrel patterning in rat somatosensory cortex. J Comp Neurol. 346:80–96. [DOI] [PubMed] [Google Scholar]
- Schoonover CE, Tapia JC, Schilling VC, Wimmer V, Blazeski R, Zhang W, Mason CA, Bruno RM. 2014. Comparative strength and dendritic organization of thalamocortical and corticocortical synapses onto excitatory layer 4 neurons. J Neurosci. 34:6746–6758. [DOI] [PMC free article] [PubMed] [Google Scholar]
- Silver RA, Lübke J, Sakmann B, Feldmeyer D. 2003. High-probability uniquantal transmission at excitatory synapses in barrel cortex. Science. 302:1981–1984. [DOI] [PubMed] [Google Scholar]
- Sorra KE, Fiala JC, Harris KM. 1998. Critical assessment of the involvement of perforations, spinules, and spine branching in hippocampal synapse formation. J Comp Neurol. 398:225–240. [PubMed] [Google Scholar]
- Staiger JF, Flagmeyer I, Schubert D, Zilles K, Kötter R, Luhmann HJ. 2004. Functional diversity of layer IV spiny neurons in rat somatosensory cortex: quantitative morphology of electrophysiologically characterized and biocytin labeled cells. Cereb Cortex. 14:690–701. [DOI] [PubMed] [Google Scholar]
- Südhof TC. 2012. The presynaptic active zone. Neuron. 75:11–25. [DOI] [PMC free article] [PubMed] [Google Scholar]
- Sutor B, Hagerty T. 2005. Involvement of gap junctions in the development of the neocortex. Biochem Biophys Acta. 1719:59–68. [DOI] [PubMed] [Google Scholar]
- Torrealba F, Carrasco MA. 2004. A review on electron microscopy and neurotransmitter systems. Brain Res Rev. 47:5–17. [DOI] [PubMed] [Google Scholar]
- Umeda T, Ebihara T, Okabe S. 2005. Simultaneous observation of stably associated presynaptic varicosities and postsynaptic spines: morphological alterations of CA3-CA1 synapses in hippocampal slice cultures. Mol Cell Neurosci. 28:264–274. [DOI] [PubMed] [Google Scholar]
- Vaughn JE. 1989. Fine structure of synaptogenesis in the vertebrate central nervous system. Synapse. 3:255–285. [DOI] [PubMed] [Google Scholar]
- Watanabe S, Rost BR, Camacho-Pérez M, Davis MW, Söhl-Kielczynski B, Rosenmund C, Jorgensen EM. 2013. Ultrafast endocytosis at mouse hippocampal synapses. Nature. 504:242–247. [DOI] [PMC free article] [PubMed] [Google Scholar]
- White EL, Weinfeld L, Lev DL. 1997. A survey of morphogenesis during the early postnatal period in PMBSF barrels of mouse SmI cortex with emphasis on barrel D4. Somatosens Mot Res. 14:34–55. [DOI] [PubMed] [Google Scholar]
- Wilke SA, Antonios JK, Bushong EA, Badkoobehi A, Malek E, Hwang M, Terada M, Ellisman MH, Ghosh A. 2013. Deconstructing complexity: serial block-face electron microscopic analysis of the hippocampal mossy fiber synapse. J Neurosci. 33:507–522. [DOI] [PMC free article] [PubMed] [Google Scholar]
- Wimmer VC, Bruno RM, de Kock CP, Kuner T, Sakmann B. 2010. Dimensions of a projection column and architecture of VPM and POm axons in rat vibrissal cortex. Cereb Cortex. 20:2265–2276. [DOI] [PMC free article] [PubMed] [Google Scholar]
- Woolsey TA, Van der Loos H. 1970. The structural organization of layer IV in the somatosensory region (SI) of mouse cerebral cortex. The description of a cortical field composed of discrete cytoarchitectonic units. Brain Res. 17:205–242. [DOI] [PubMed] [Google Scholar]
- Xu-Friedman MA, Harris KM, Regehr WG. 2001. Three-dimensional comparison of ultrastructural characteristics at depressing and facilitating synapses onto cerebellar Purkinje cells. J Neurosci. 21:6666–6672. [DOI] [PMC free article] [PubMed] [Google Scholar]
- Xu-Friedman MA, Regehr WG. 2004. Structural contributions to short-term synaptic plasticity. Physiol Rev. 84:69–85. [DOI] [PubMed] [Google Scholar]
- Xu-Friedman MA, Regehr WG. 2003. Ultrastructural contributions to desensitization at cerebellar mossy fiber to granule cell synapses. J Neurosci. 23:2182–2192. [DOI] [PMC free article] [PubMed] [Google Scholar]
- Zecevic N, Rakic P. 1991. Synaptogenesis in monkey somatosensory cortex. Cereb Cortex. 1:510–523. [DOI] [PubMed] [Google Scholar]
- Zhao C, Kao JP, Kanold PO. 2009. Functional excitatory microcircuits in neonatal cortex connect thalamus and layer 4. J Neurosci. 29:15479–15488. [DOI] [PMC free article] [PubMed] [Google Scholar]
- Zhao S, Studer D, Chai X, Graber W, Brose N, Nestel S, Young C, Rodriguez EP, Sätzler K, Frotscher M. 2012. Structural plasticity of hippocampal mossy fiber synapses as revealed by high-pressure freezing. J Comp Neurol. 520:2340–2351. [DOI] [PubMed] [Google Scholar]
- Zhao S, Studer D, Graber W, Nestel S, Frotscher M. 2012. Fine structure of hippocampal mossy fiber synapses following rapid high-pressure freezing. Epilepsia. 53(Suppl 1):4–8. 10.1111/j.1528-1167.2012.03469.x. [DOI] [PubMed] [Google Scholar]
- Ziv NE, Garner CC. 2004. Cellular and molecular mechanisms of presynaptic assembly. Nat Rev Neurosci. 5:385–399. [DOI] [PubMed] [Google Scholar]
Associated Data
This section collects any data citations, data availability statements, or supplementary materials included in this article.