

Abstract
Neuronal activity, including intrinsic neuronal excitability and synaptic transmission, is an essential regulator of brain development. However, how the intrinsic neuronal excitability of distinct neurons affects their integration into developing circuits remains poorly understood. To investigate this problem, we created several transgenic mouse lines in which intrinsic excitability is suppressed, and the neurons are effectively silenced, in different excitatory neuronal populations of the hippocampus. Here we show that CA1, CA3 and dentate gyrus neurons each have unique responses to suppressed intrinsic excitability during circuit development. Silenced CA1 pyramidal neurons show altered spine development and synaptic transmission after postnatal day 15. By contrast, silenced CA3 pyramidal neurons seem to develop normally. Silenced dentate granule cells develop with input-specific decreases in spine density starting at postnatal day 11; however, a compensatory enhancement of neurotransmitter release onto these neurons maintains normal levels of synaptic activity. The synaptic changes in CA1 and dentate granule neurons are not observed when synaptic transmission, rather than intrinsic excitability, is blocked in these neurons. Thus, our results demonstrate a crucial role for intrinsic neuronal excitability in establishing hippocampal connectivity and reveal that neuronal development in each hippocampal region is distinctly regulated by excitability.
KEY WORDS: Neural activity, Synaptogenesis, Dendritic spines, Hippocampus, Transgenic mice
Summary: In the developing mouse hippocampus, intrinsic neuronal excitability does not alter CA3 neuron development but regulates spine formation and synaptic transmission in CA1 neurons.
INTRODUCTION
The proper functioning of neural networks depends crucially on their precise topography being correctly established and maintained. A crucial regulator of neural network development is neural activity, which has been shown to be vital for many aspects of brain development (Zhang and Poo, 2001; Goda and Davis, 2003; Waites et al., 2005; Fox and Umemori, 2006; Ackman and Crair, 2014). There are many facets to neural activity, including cell-intrinsic types of activity, such as membrane excitability and spontaneous neurotransmitter release; network-driven activity, such as synaptic transmission; and more global forms of activity, such as synchronous activity waves. Synaptic transmission-dependent competition between neighboring axons in target brain areas and global activity waves are well-established mechanisms contributing to circuit maturation (Zhang and Poo, 2001; Waites et al., 2005; Kirkby et al., 2013). However, how the intrinsic excitability of a neuron affects its integration into developing circuits in vivo is less well understood.
Owing to its crucial role in many aspects of learning and memory and its clearly defined connectivity, the hippocampus is an ideal structure in which to study network development. Furthermore, perturbations in hippocampal development contribute to many diseases, including epilepsy, autism and schizophrenia (Beck and Yaari, 2008; Koyama and Matsuki, 2010; Guerrini et al., 2011; Kaphzan et al., 2011). There are three types of principal excitatory neuron within the hippocampus: CA1 pyramidal, CA3 pyramidal and dentate gyrus (DG) neurons. These neuronal types share many features, including the use of glutamate as a transmitter. CA3 and CA1 pyramidal neurons even share similar morphology and ontogeny (Bayer, 1980a,b). Nonetheless, there are also distinct differences between these cell populations, particularly those related to intrinsic excitability, including membrane properties, HCN channel expression and firing rate (Spigelman et al., 1992; Santoro et al., 2000; Tyzio et al., 2003; Spruston and McBain, 2006; Hemond et al., 2009; Nowacki et al., 2011). Perhaps because of these differences in intrinsic excitability, these neurons also display unique forms of synaptic plasticity (Lynch, 2004) and have different disease susceptibility (Mathern et al., 1995; Borges et al., 2003; Fujita et al., 2014). We hypothesize that the differences in intrinsic excitability affect the manner by which hippocampal neurons integrate into developing circuits.
To understand the specific role of intrinsic excitability in distinct neuronal populations during development in vivo, we created transgenic mice that overexpress the inwardly rectifying potassium channel Kir2.1 (Kcnj2 – Mouse Genome Informatics) to suppress intrinsic excitability, along with mCherry to label the neurons. This transgenic system allowed us to address the following three main questions. (1) Does intrinsic excitability regulate the development of excitatory neurons within the hippocampus in vivo? (2) Is this regulation the same for CA1, CA3 and DG neurons? (3) Is there a specific period of development that is activity dependent? We found that suppression of excitability affects the excitatory neurons of CA1, CA3 and the DG in different ways, and that early stages of spine development are independent of intrinsic excitability in CA1 and CA3 but not in the DG. Suppression of synaptic transmission, by contrast, did not affect spine development. Our results demonstrate that unique intrinsic excitability-dependent mechanisms govern the development of hippocampal neurons.
RESULTS
Creation of an in vivo system to study the role of intrinsic excitability in hippocampal development
To address the region-specific role of cell-intrinsic excitability in hippocampal development in vivo, we created a genetic system to suppress excitability in different subsets of neurons. As a strategy, we took advantage of the suppression of excitability that accompanies overexpression of Kir2.1. We thus generated a construct in which tetracycline transactivator (tTA)-responsive promoter (tetO) drives expression of Kir2.1, mCherry and tTA, which allows for significant amplification of Kir2.1 expression (Fig. 1A). Co-transfection of this construct with a plasmid encoding tTA into HEK293 cells drove pronounced inwardly rectifying K+ currents in transfected cells (Fig. S1A,B). To test the efficacy of this construct in silencing neurons in active networks, we used sparse co-transfection of the two plasmids into hippocampal neurons. As expected from high Kir2.1 expression, transfected neurons exhibited a significant hyperpolarization in resting membrane potential and a near-complete cessation of firing (Fig. S1C-E).
Fig. 1.

Establishment of an in vivo system to study the role of intrinsic neuronal excitability in hippocampal development. (A) The transgenic strategy: a tTA-expressing line and Kir2.1-mCherry-tTA-expressing lines were mated. Kir2.1 suppresses intrinsic excitability, mCherry labels neurons, and tTA from the second line boosts the expression of Kir2.1 and mCherry. (B) tTA expression in the tTA mouse line used in this study. The tTA line was crossed with the tetO-nls-lacZ line and subjected to β-galactosidase staining. (C,D) Low-magnification images showing mCherry expression in the hippocampus from double-transgenic (tTA::Kir2.1-mCherry) Line-1 (C) and Line-2 mice (D; note that the signals in CA3 are from dentate granule cell axons and not from CA3 pyramidal cells) at P21. Scale bars: 500 µm. (E,F) Quantification of the percentage of cells expressing mCherry in CA1, CA3 and DG at P21 in Line-1 (E) and Line-2 (F). (n=3-5). (G-I) Kir2.1-expressing lines were crossed with the GFP-M line to obtain neurons that express green fluorescent protein (GFP), mCherry, or both (yellow). Scale bars: 50 µm.
As the Kir2.1 expression strategy effectively inhibited excitability in individual neurons in vitro, we generated several transgenic mouse lines expressing the tetO-Kir2.1-mCherry-tTA cassette. To induce the transgene expression, we crossed these mice with a transgenic line expressing tTA pan-neuronally in the brain, including expression in all major excitatory neurons in the hippocampus (Fig. 1B). Single-transgenic mice expressing only the tetO-Kir2.1-mCherry-tTA cassette did not exhibit any leak of expression, as determined by the lack of mCherry immunoreactivity, but crossing them with the tTA line effectively induced mCherry. Double-transgenic mice were then screened for specific expression patterns of mCherry within the developing hippocampus (note that the expression pattern of Kir2.1/mCherry in double-transgenic mice is not only determined by the tTA expression of the tTA line but also by the genomic integration site of the tetO-Kir2.1-mCherry-tTA cassette in the tetO line). After screening many transgenic lines, two double-transgenic lines with region-restricted expression patterns were selected for detailed analysis. At postnatal day (P) 21, Line-1 primarily exhibits expression in a subset of CA1 and CA3 pyramidal neurons, whereas Line-2 exhibits expression in a subset of CA1 pyramidal neurons and dentate granule cells (DGCs; Fig. 1C-F; Table S1). In both lines, expression of the transgene is restricted to <26% of primary hippocampal neurons, small enough to allow for morphological analysis but high enough to find positive cells for electrophysiological recordings. Kir2.1 expression in the presynaptic neurons was <10% for any postsynaptic neurons (CA1, CA3 or DG) that we studied (Table S1). In addition, we did not detect any expression of Kir2.1 in interneurons. Thus, presynaptic input neurons express Kir2.1 at a sufficiently low percentage to assume that the effects we observed are postsynaptic cell intrinsic. For imaging experiments, the two Kir2.1-expressing lines were each crossed with the thy1-GFP-M mouse line, which has sparse expression of green fluorescent protein (GFP) throughout the hippocampus, in order to have fluorescently labeled, neighboring control neurons (Feng et al., 2000; Fig. 1G-I). By analyzing neighboring neurons, we have an ideal intrahippocampal control; the control and Kir2.1-expressing neurons develop in the same environment, so that we can analyze the cell-autonomous effect of inhibiting intrinsic excitability in individual neurons.
To confirm that intrinsic excitability was effectively suppressed by transgenic expression of Kir2.1, we examined cell excitability in acutely prepared hippocampal slices. As expected, in both Line-1 and Line-2, expression of Kir2.1 caused a significant hyperpolarization of the resting membrane potential in CA1 pyramidal neurons, CA3 pyramidal neurons and DGCs at the beginning and end of our analysis (around P7 and around P20, respectively; Fig. 2A-C: CA1 in Line-2, CA3 in Line-1 and DGCs in Line-2, respectively; Fig. S2A: CA1 in Line-1). Neuronal excitability was also greatly reduced in CA1, CA3 and DG neurons expressing Kir2.1 (∼P20). With both prolonged (500 ms; Fig. 2D-I) and short (10 ms; Fig. 2J,L,N) current pulses, significantly more current is required to elicit an action potential in neurons expressing Kir2.1 in CA1, CA3 and the DG. However, once the peak of firing is reached, Kir2.1-expressing and control neurons fire a similar number of action potentials in all three regions (data not shown), demonstrating that although Kir2.1-expressing neurons have reduced intrinsic excitability, these neurons seem otherwise healthy.
Fig. 2.

Inhibited neuronal excitability of Kir2.1-expressing neurons in the transgenic mice. (A-C) Resting membrane potential (RMP) is significantly hyperpolarized in CA1 (A) of Line-2 (∼P7: n=12,14, *P=0.023; ∼P20: n=15,14, *P=0.005 by Student's t-test), CA3 (B) of Line-1 (∼P7: n=14,8, *P=0.018; ∼P20: n=16,12, *P<0.001 by Student's t-test) and dentate gyrus (DG; C) of Line-2 (∼P7: n=13,13, *P=0.049; ∼P20: n=12,9, *P=0.001 by t-test). (D-I) Responses of control or Kir2.1-expressing neurons to various degrees of current injected for 500 ms in CA1 (D,G), CA3 (E,H) and dentate granule cells (DGCs; F,I). Scale bars: 20 mV (vertical); 100 ms (horizontal). Graphs depict the number of action potentials (APs) that fire with different amounts of injected current (G-I). Significantly fewer action potentials were elicited by current injections in Kir2.1-expressing neurons relative to controls in all three regions (P<0.001 by two-way ANOVA). (J,L,N) Bar graphs show the average current required to elicit a single action potential in CA1 (J), CA3 (L) and DGCs (N). Insets show representative examples of traces from control (left) and Kir2.1-expressing (right) neurons with 60 (red), 140 (green), 200 (purple) and 240 pA (blue) of current injection. Each current step was injected for 10 ms. Scale bars: 20 mV (vertical); 10 ms (horizontal). In all three regions, significantly more current is required to elicit a single action potential in Kir2.1-expressing neurons than in control neurons [*P=0.026 (J), 0.004 (L) and 0.027 (N) by Student's t-test]. (K,M,O) Percentages of Fos-positive cells in Kir2.1-expressing and control non-expressing neurons in seizure-induced mice. Significantly fewer Kir2.1-expressing neurons express Fos after seizure in CA1 (K; n=5,5, *P<0.001 by Student's t-test), CA3 (M; n=5,5, *P<0.001 by Student's t-test) and DGCs (O; n=5,5, *P<0.001 by Student's t-test).
We then examined whether Kir2.1-expressing cells still fire spontaneously in acute slices. Control cells showed spontaneous firing, but we never saw firing in Kir2.1-expressing neurons; thus, suppression of intrinsic excitability by Kir2.1 effectively silences the hippocampal neurons in these mouse lines (Fig. S2B-E). To provide further confirmation that the suppression of neuronal activity by Kir2.1 is functioning within the intact hippocampal network in vivo, we examined the expression of the activity-dependent immediate early gene Fos in response to kainic acid-induced seizures in Kir2.1-expressing transgenic mice. In all three regions (CA1, CA3 and DG), significantly fewer neurons became positive for Fos immunoreactivity in Kir2.1-expressing neurons than in neighboring non-Kir2.1-expressing control neurons (Fig. 2K,M,O). Even in positive neurons, there was a 66% reduction in Fos intensity in Kir2.1-expressing neurons relative to non-Kir2.1-expressing neurons in CA1, a 75% reduction in CA3 and a 75% reduction in the DG (data not shown). These results indicate that Kir2.1 is indeed effectively suppressing neuronal excitability in vivo in all three hippocampal regions. Thus, these mice represent an excellent tool to investigate how the cell-autonomous excitability of a neuron affects its integration into the developing hippocampus.
Inhibition of excitability impairs the development of CA1 pyramidal neurons
Having validated the effectiveness of inhibiting excitability with transgenic Kir2.1 expression, we studied the effect of intrinsic excitability inhibition on the development of individual neurons within the hippocampus. Transgene expression, visualized with mCherry immunoreactivity, was evident as early as P3 and remained throughout adulthood (data not shown). Although we document specific effects of excitability suppression below, several aspects of neuronal development were unaffected by Kir2.1 expression. When examined at P21, silenced neurons in all three regions of the hippocampus seemed to have migrated appropriately (Fig. 1). Furthermore, the persistence of mCherry-positive cells throughout development suggests that suppression does not seem to compromise cell health or lead to apoptosis.
To investigate whether intrinsic excitability regulates the network integration of individual neurons, we examined the morphology of dendrites and dendritic spines at P21. We first focused on Kir2.1-expressing neurons and neighboring non-Kir2.1-expressing control neurons in CA1 from Line-1. To ensure that these neurons were compared as precisely as possible, we used the GFP signal in both non-silenced (GFP alone) and silenced (GFP+mCherry/Kir2.1) pyramidal neurons (Fig. 3A). CA1 pyramidal neurons receive different sources of input onto their basal and apical dendrites; the basal dendrites in the stratum oriens receive input mostly from the contralateral hippocampus, whereas the apical dendrite in the stratum radiatum receives input primarily from the Schaeffer collaterals of CA3 pyramidal neurons. We analyzed dendritic development in both regions by measuring dendritic complexity. Neither the number of basal dendrites branching off the soma nor the number of branches from the primary apical dendrite differed between silenced and neighboring control neurons at P21 (Fig. 3B). We next measured the density of spines along a basal dendrite in the stratum oriens and the primary branch of the apical dendrite in the stratum radiatum. We found that spine density was significantly lower in Kir2.1-expressing neurons relative to neighboring control neurons in both layers (Fig. 3C); therefore, intrinsic excitability is important for spine development in CA1 pyramidal neurons, regardless of input. We also assessed the morphology of dendritic spines in inactive and control neurons. Spines were classified as mushroom, stubby, thin or other. We found that the percentage of spines that are classified as mushroom is significantly lower in Kir2.1-expressing neurons (Fig. 3D). These neurons also have more stubby spines (Fig. 3E,F). When compared with mushroom spines, stubby spines represent more immature, less efficient synaptic connections (Petrak et al., 2005), suggesting that transmission onto these silent neurons might also be impaired. In order to investigate directly whether there are functional consequences to these morphological changes, we compared miniature excitatory postsynaptic currents (mEPSCs) recorded from mCherry-positive (inactive) neurons with neighboring non-fluorescent control neurons (Fig. 3G,H). mEPSCs in silenced CA1 pyramidal neurons had significantly smaller amplitude and were significantly less frequent compared with neighboring non-silenced cells. There was no correlation between rise time and mEPSC amplitude and no change in capacitance, suggesting that Kir2.1 expression did not deteriorate the ability to voltage clamp dendrites (Fig. S3A,B). These electrophysiological data complement the morphological data, demonstrating that inhibition of intrinsic excitability in CA1 pyramidal neurons disrupts their proper integration into the developing hippocampal circuit.
Fig. 3.

Expression of Kir2.1 impairs spine development and synaptic transmission of CA1 pyramidal neurons. (A-H) CA1 pyramidal neurons of Line-1. (A) Example images of a GFP-expressing (control) and an mCherry- and GFP-expressing pyramidal neuron (Kir2.1) in CA1 of triple-transgenic mice (Line-1::GFP-M). Example images of spines along the main dendrite are shown in the right-hand panels. Spine images were from the stratum oriens (SO) and the stratum radiatum (SR) (white boxes in the left panels). Scale bars: 40 µm (left); 3 µm (right). (B) The number of dendritic branches. There are no differences in the number of basal (n=7,16, P=0.460 by Student's t-test) or apical (n=7,16, P=0.348 by Student's t-test) branches between control and Kir2.1-expressing neurons. (C) Spine density was significantly lower in the primary dendrite in Kir2.1-expressing neurons compared with control neurons in SO (n=10,10, *P=0.029 by Student's t-test) and in SR (n=15,15, *P<0.001 by Student's t-test). (D) There are significantly fewer mushroom spines in Kir2.1-expressing neurons than in control neurons in both SO and SR (*P<0.001 by Student's t-test). (E,F) Classification of spine morphology is significantly different between control and Kir2.1-expressing neurons (P<0.001 by χ2 test) in both SO (E; n=548-661 spines) and SR (F; n=141-196 spines). (G) Amplitude is significantly decreased in Kir2.1-expressing neurons (n=23) compared with control neurons (n=18, *P=0.041 by Student's t-test). (H) Frequency is significantly decreased in Kir2.1-expressing neurons (*P=0.049 by Student's t-test). (I-M) CA1 pyramidal neurons of Line-2. (I) Spine density is significantly lower in SR (n=10,10; *P<0.001 by Student's t-test). (J) Example traces of miniature excitatory postsynaptic currents (mEPSCs) from control and Kir2.1-expressing pyramidal neurons. Scale bars: 15 pA (vertical); 50 ms (horizontal). (K) Amplitude is significantly decreased in Kir2.1-expressing neurons (n=20) compared with control neurons (n=40, *P=0.037 by Student's t-test). (L) Frequency is significantly decreased in Kir2.1-expressing neurons (*P=0.041 by Student's t-test). (M) Inter-event interval is shifted to the right in Kir2.1-expressing neurons.
To determine whether presynaptic expression of Kir2.1 could be influencing our results, we compared CA1 neurons between Line-1 and Line-2, because they show similar Kir2.1 expression in CA1 but different expression patterns upstream of CA1; Line-1 mice had higher expression of Kir2.1 in CA3 pyramidal neurons than Line-2, which had almost no expression in CA3 pyramidal neurons (Table S1). In Line-2, spine density was significantly (by 22%) suppressed in the stratum radiatum of Kir2.1-expressing pyramidal neurons at P21 (Fig. 3I), as in Line-1 (by 20%). We also found a significant decrease in mEPSC amplitude, frequency and inter-event interval in Line-2 (Fig. 3J-M), which did not show significant differences from Line-1 by two-way ANOVA. Thus, both lines of mice have similarly impaired spine development and impaired excitatory synaptic transmission in neurons expressing Kir2.1. The similarities in the results between the two lines of mice underscore the importance of intrinsic excitability in the cell-autonomous synaptic development rather than suppression of neurons upstream in the network.
CA3 pyramidal neurons develop normally even when intrinsic excitability is inhibited
Given the profound effects of suppression of neuronal excitability on the development of CA1 pyramidal neurons, one might expect that spine development would be altered in a similar manner in the primary dendrites of CA3 pyramidal neurons. However, we found that the integration of CA3 pyramidal neurons was highly resistant to inhibition of intrinsic excitability (Fig. 4; data are from Line-1). As in CA1, dendritic branching was unaltered in Kir2.1-expressing neurons in CA3 (Fig. 4B). However, unlike CA1, spine density was similar between control and Kir2.1-expressing neurons in CA3 when analyzed in each hippocampal layer (Fig. 4C). The percentage of mushroom spines also did not differ between silenced and control neurons in any of the regions examined (Fig. 4D). Overall spine classification was also similar between neurons with decreased excitability and control neurons in both the stratum lucidum and the stratum radiatum (Fig. 4E,F).
Fig. 4.

CA3 pyramidal neurons develop normally even if intrinsic excitability is inhibited. (A) Example images of a GFP-expressing (control) and an mCherry- and GFP-expressing (Kir2.1) pyramidal neuron in CA3 of triple-transgenic mice (Line-1). High-magnification images of spines from stratum oriens (SO), stratum lucidum (SL) and stratum radiatum (SR) along the main dendrite are shown in the right panels (collected from the regions shown in the white boxes). Scale bars: 40 µm (left panels); 3 µm (right panels). (B) The number of dendritic branches. There are no differences in the number of basal (P=0.188 by Student's t-test; n=6,6) or apical (P=0.653 by Student's t-test; n=6,6) branches between control and Kir2.1-expressing neurons. (C) Spine density was not significantly different in Kir2.1-expressing neurons when compared with GFP-only neurons in SO (n=10,10, P=0.076 by Student's t-test), SL (n=12,12, P=0.938 by Student's t-test), SR (n=18,12, P=0.557 by Student's t-test) or the stratum lucidum moleculare (SLM; n=5,5, P=0.095 by Student's t-test). (D) There is a similar percentage of mushroom spines in Kir2.1-expressing neurons and control neurons in all regions examined (SO, P=0.831; SL, P=0.680; SR, P=0.656 by Student's t-test). (E,F) Relative distribution of spine classification in SL (E) and SR (F). There are no differences between control and Kir2.1 neurons in SL (n=86-168 spines, P=0.182 by χ2 test) or SR (n=86-168 spines, P=0.332 by χ2 test). (G) Example traces of mEPSCs from control and Kir2.1-expressing pyramidal neurons in CA3. Scale bars: 15 pA (vertical); 50 ms (horizontal). (H) Amplitude is similar between Kir2.1-expressing neurons (n=19) and control neurons (n=28; P=0.319 by Student's t-test). (I) Frequency is unchanged in Kir2.1-expressing neurons (P=0.465 by Student's t-test). (J) Cumulative probability graph of inter-event interval shows that Kir2.1-expressing neurons and control neurons have nearly identical curves.
Functional studies also showed that inhibition of intrinsic excitability in CA3 pyramidal neurons had little consequence for their integration into the network. mEPSC amplitude and frequency were unaltered in silenced CA3 pyramidal neurons (Line-1; Fig. 4G-J). The lack of change in the development of spines in the excitability-suppressed CA3 pyramidal neurons was in stark contrast to the changes in CA1 pyramidal neurons, in spite of the effectiveness of Kir2.1 in suppressing excitability in CA3 pyramidal neurons (Fig. 2). Taken together, these data demonstrate that postsynaptic excitability differentially affects the integration of pyramidal neurons in CA1 and CA3 into the developing hippocampal circuit, being crucial in CA1 but not in CA3.
Inhibition of excitability suppresses spine density only at later stages of development in CA1 and never in CA3
Given that excitability was significantly suppressed in CA1 pyramidal neurons already at around P7 (Fig. 2A), we asked when the changes in spine density begin to emerge and whether they persist throughout development. Spine density was therefore assessed from P6 to P45 along the main apical dendrite of control or Kir2.1-expressing neurons in triple-transgenic mice (Line-1::GFP-M; Fig. 5). At P6, CA1 pyramidal neurons had very few spines along the main dendrite in the stratum radiatum, and the spine density was similar between control and neighboring Kir2.1-expressing neurons (Fig. 5A,B). From P6 to P11, a marked increase in the spine density took place. This initial wave of spine generation was unaltered by suppression of excitability, as spine density at P11 in control and Kir2.1-expressing neurons were very similar. From P11 to P15, there was another large increase in spine density, and this increase was significantly reduced in Kir2.1-expressing neurons relative to neighboring controls (Fig. 5A,B). The decreased spine density in silenced neurons then persisted throughout the remainder of development and into adulthood. Thus, intrinsic excitability does not seem to be crucial for initial spine formation but plays an important role in expanding synaptic connectivity at later developmental stages.
Fig. 5.

Time-dependent effects of intrinsic excitability in CA1 but not CA3 pyramidal neurons. (A,B) Spine density in the CA1 stratum radiatum of the primary dendrite from control or Kir2.1-expressing neurons from P6 to P45 (Line-1). (A) The spine density is significantly decreased in Kir2.1-expressing neurons at every age, except for P6 and P11 (P6: n=5,5, P=0.563; P11: n=10,10, P=0.740; P15: n=15,15, *P<0.001; P21: n=15,15, *P<0.001; P28: n=10,10, *P=0.016; P45: n=10,10, *P=0.004 by two-way ANOVA). (B) Typical images of spines from the primary dendrite of CA1 pyramidal neurons in the triple-transgenic mice, imaged with GFP. (C-F) Silenced CA3 neurons do not show a significant difference from control neurons in spine density in stratum lucidum (C,D) or stratum radiatum (E,F) at any developmental age (Line-1). (C) Stratum lucidum: P6: n=5,5; P11: n=5,5; P15: n=13,12; P21: n=12,12; P28: n=8,8; P45: n=7,6; P=0.190 by two-way ANOVA. (E) Stratum radiatum: P6: n=5,5; P11: n=5,5; P15: n=17,18; P21: n=18,12; P28: n=12,12; P45: n=13,14; P=0.680 by two-way ANOVA. (D,F) Typical images of spines from the primary dendrite of CA3 pyramidal neurons in stratum lucidum (D) and stratum radiatum (F) in the triple-transgenic mice. Each image is 15 µm in length.
We next examined spines on CA3 pyramidal neurons at various developmental time points (in Line-1::GFP-M). As with the CA1 pyramidal neurons, the dendrites of CA3 pyramidal neurons had very few spines at P6 (Fig. 5C-F). Spine density then increased markedly between P6 and P11. From P11 until adulthood, only slight increases in spine density were seen in control neurons (Fig. 5C-F). Importantly, this pattern of synaptic development was almost identical in control and silenced neurons. In both stratum lucidum and stratum radiatum, spine density was similar between Kir2.1-expressing and control CA3 pyramidal neurons throughout development (Fig. 5C-F). Thus, at no point in development were changes evident in CA3. These results extend our previous analysis and suggest that the intrinsic excitability of CA3 pyramidal neurons has little impact on the functional integration of these neurons into the developing hippocampal network.
Silenced DGCs have input-specific decreases in spine density but unaltered synaptic transmission
Given the marked differences in the impact of suppressing intrinsic excitability in CA1 and CA3 pyramidal neurons, we asked how intrinsic excitability contributes to the development of synaptic connectivity in DGCs. To assess the morphology of Kir2.1-expressing DGCs, Line-2 animals (Fig. 1) were crossed with the thy1-GFP-M line, and spine density was analyzed along the main apical dendrite in these triple-transgenic mice at P21 (Fig. 6). We examined spine density in the dentate molecular layer: the inner (IML), medial (MML) and outer (OML) layers. Commissural fibers innervate the portion of the dendrite in the IML; entorhinal fibers from layer 2 neurons (the perforant path) innervate the MML and OML (Förster et al., 2006). In the IML of the triple-transgenic mice, there was no effect of inhibition of excitability on spine density between control and Kir2.1-expressing DGCs. However, spine density was significantly decreased in the dendritic region in the MML and OML of Kir2.1-expressing DGCs. Thus, silencing DGCs has effects on connectivity that arise in a layer-specific manner.
Fig. 6.
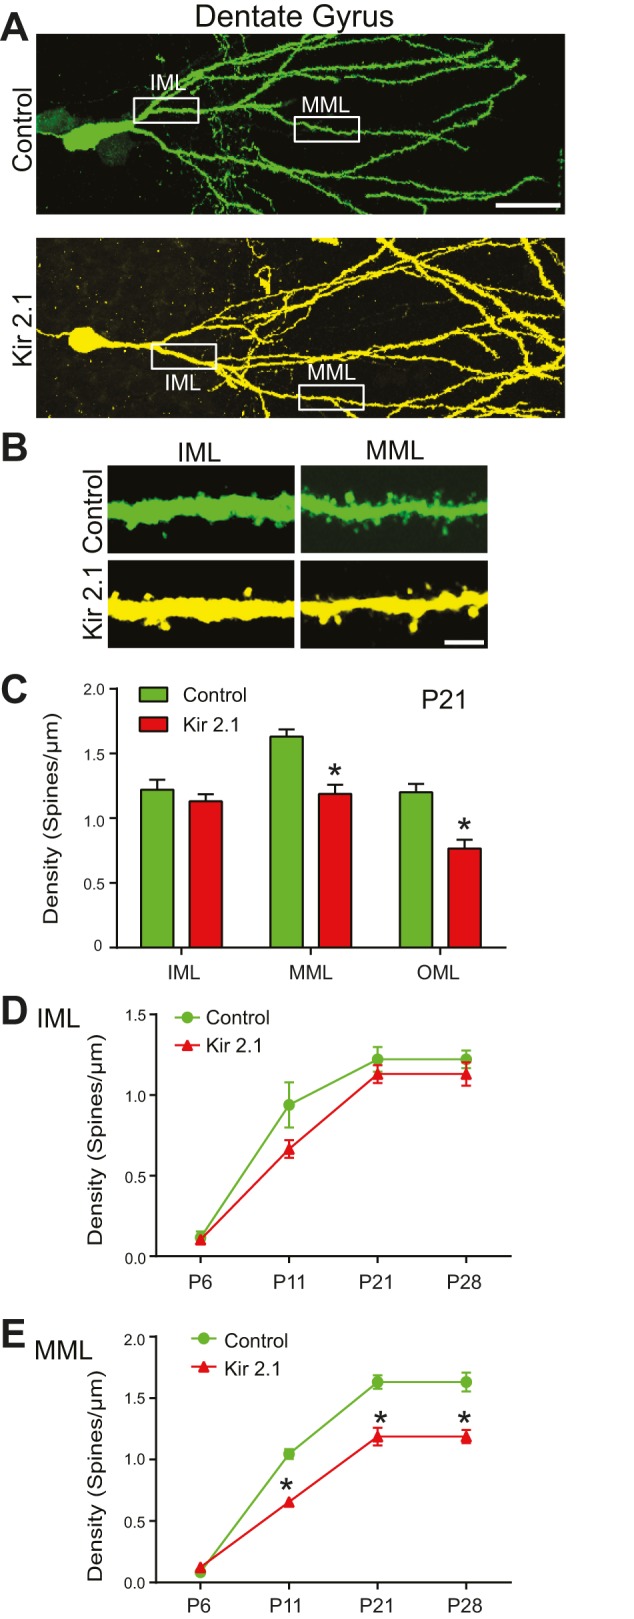
Input-specific decrease in spine density in dentate granule cells overexpressing Kir2.1. (A) Example images of a GFP-expressing (control) and an mCherry- and GFP-expressing DGC (Kir2.1) at P21 (Line-2). Scale bar: 40 µm. (B) Example images of spines from the inner molecular layer (IML) and medial molecular layer (MML) of a primary dendrite. Images were collected from the regions shown in the white boxes in A. Scale bar: 3 µm. (C) The spine density (P21) in the IML is similar between control and Kir2.1-expressing neurons (n=10,10, P=0.982 by Student's t-test). In the MML and outer molecular layer (OML), dendritic spines of Kir2.1-expressing neurons are significantly less dense than control neurons (MML: n=10,10, *P=0.012; OML: n=6,5, *P=0.49 by Student's t-test). (D,E) Spine density in the IML and MML during development. Density is never decreased in Kir2.1-expressing neurons in the IML but is decreased from P11 to P28 in the MML. (D) IML: P6: n=6,5; P11: n=5,5; P21: n=10,10; P28: n=5,5; P=0.831 by two-way ANOVA. (E) MML: P6: n=6,5; P11: n=5,5; P21: n=10,10; P28: n=5,5; P<0.001 by two-way ANOVA.
We then analyzed spine density in the IML and MML during development. As in the other hippocampal regions, there were almost no spines at P6, and there was no effect of activity suppression at this age. In both control and Kir2.1-expressing neurons, there was an increase in spine density between P6 and P11; however, this increase was less pronounced in silenced neurons when measured in the MML. The decreased spine density in the MML continued through P28 (Fig. 6D,E). By contrast, we did not observe spine changes in the IML at any of the ages examined.
The change in spine density in the MML suggests that as with CA1 pyramidal neurons, synaptic transmission onto silenced DGCs might be perturbed. Surprisingly, despite the decrease in structural synapses, mEPSC amplitude and frequency were not significantly different in Kir2.1-expressing DGCs relative to neighboring control DGCs (Fig. 7A-C). Spontaneous EPSC amplitude and frequency (recorded in the absence of tetrodotoxin) were also indistinguishable between Kir2.1-expressing neurons and neighboring control neurons (Fig. 7D-F). One possible explanation for the lack of correspondence between structural and functional measures of synaptic connectivity is that the more proximal inputs account for a larger portion of recorded EPSCs, and given that no spine defect was observed in the IML, the functional consequences of MML changes were obscured. An alternative possibility is that suppression of postsynaptic activity could invoke a compensatory increase in neurotransmitter release onto the silenced neurons, effectively compensating for the decrease in the number of structural connections. We tested this idea by comparing paired-pulse facilitation in control and Kir2.1-expressing DGCs, because it is well established that paired-pulse facilitation varies inversely with neurotransmitter release probability at excitatory synapses. Whole-cell patch-clamp recordings of either control or Kir2.1-expressing DGCs were conducted while EPSCs were evoked using a stimulating electrode placed in the MML, targeting the entorhinal projections where spine density is depressed by activity inhibition (Fig. 7G), and the ratio of the second EPSC to the first was calculated. Kir2.1-expressing DGCs had a significant decrease in recorded paired-pulse ratio compared with neighboring control DGCs, suggesting that entorhinal inputs onto Kir2.1-expressing neurons have a higher release probability than those inputs onto unsuppressed neurons (Fig. 7H,I). The shift in paired-pulse ratio is specific to the DG, because no changes in paired-pulse ratio were evident in CA1 pyramidal neurons (Fig. 7J). The presynaptic changes were not mirrored by changes in postsynaptic responsiveness, because the AMPA/NMDA ratio was unaltered in silenced DGCs (Fig. 7K). These results suggest that a compensatory increase in neurotransmitter release probability, expressed by axon terminals synapsing onto inactive DGCs, acts to renormalize ongoing synaptic activity in the face of diminished structural connectivity.
Fig. 7.

Despite having spine defects, synaptic transmission is unaltered onto DGCs overexpressing Kir2.1 as a result of increased neurotransmitter release probability. (A-C) Miniature excitatory postsynaptic currents (mEPSCs) recorded from DGCs at P16-P23 (Line-2). (A) Example traces of mEPSCs from control and Kir2.1-expressing neurons. Scale bars: 5 pA (vertical); 250 ms (horizontal). (B) Amplitude is similar between Kir2.1-expressing (n=8) and control neurons (n=13; P=0.791 by Student's t-test). (C) Frequency is also similar (P=0.907 by Student's t-test). (D-F) Spontaneous EPSCs recorded from DGCs at P16-P23. (D) Example traces of spontaneous EPSCs from control and Kir2.1-expressing neurons. Scale bars: 5 pA (vertical); 250 ms (horizontal). (E) Amplitude is similar between Kir2.1-expressing (n=10) and control neurons (n=8; P=0.614 by Student's t-test). (F) Frequency is also similar (P=0.806 by Student's t-test). (G) Cartoon depicting how evoked EPSC recordings were conducted. Neighboring DGCs were patched successively, and a response was evoked with a stimulating electrode placed in the MML. (H) Example traces of paired-pulse stimulation from control and Kir2.1-expressing neurons. Scale bars: 20 pA (vertical); 25 ms (horizontal). (I) Paired-pulse ratio is significantly decreased in Kir2.1-expressing neurons compared with control neurons [n=10,10; *P=0.035 (50 ms), *P=0.045 (175 ms) by two-way ANOVA]. (J) Paired-pulse ratio is unaltered in Kir2.1-expressing neurons in CA1 (Line-2) compared with control neurons [n=7,6; P=0.761 (50 ms), P=0.581 (175 ms) by two-way ANOVA]. (K) The AMPA/NMDA ratio is unchanged in Kir2.1-expressing neurons compared with control neurons in DGCs (n=5,5, P=0.900 by Student's t-test).
Preventing synaptic transmission from a neuron does not affect its spine development
Kir2.1-expressing neurons have reduced intrinsic excitability, which would result in decreased neurotransmitter release from the neuron. Accordingly, they would be less effective in synaptic transmission than active neighboring neurons, which might lead to the elimination of synaptic boutons from silenced neurons through activity-dependent synapse refinement. It is possible that changes in the synaptic boutons of a Kir2.1-expressing neuron, and not changes in the membrane excitability, are affecting spine development of the neuron. To exclude this possibility, we examined spine development in mice expressing tetanus toxin light chain (TTLC), which prevents neurotransmitter release but leaves intrinsic excitability intact (Yasuda et al., 2011). We crossed the mice expressing TTLC and tau-lacZ (Yasuda et al., 2011) with the tTA line (Fig. 1B) and thy1-GFP-M line and compared their spine density with that in Kir2.1-expressing mice (Line-2::GFP-M line) at P15. In both CA1 (Fig. 8A) and the MML of DGCs (Fig. 8B), there was no difference in spine density between control cells and TTLC-expressing cells. However, Kir2.1-expressing cells had a significantly lower spine density than neighboring control neurons (Fig. 8B). These results indicate that suppression of synaptic transmission from a neuron does not affect its spine development, at least at P15, suggesting that it is cell-intrinsic excitability and not synaptic transmission that regulates spine development. Taken together, our data reveal a crucial role for intrinsic excitability of a neuron in spine development and demonstrate that distinct intrinsic excitability-dependent mechanisms govern the integration of different excitatory neuronal populations into the developing hippocampal circuitry.
Fig. 8.

Inhibition of neurotransmitter release from a neuron does not impair its spine development. TTLC/tau-lacZ-expressing mice and Kir2.1-expressing mice (Line-2) were mated with the GFP-M line. TTLC-expressing neurons were identified by staining for β-galactosidase. Spine development was assessed by GFP imaging at P15. (A) Sample images of dendrites in the stratum radiatum of CA1 from TTLC- or Kir2.1-expressing mice (left). Scale bar: 3 µm. Quantification of the spine density is shown on the right. There is no difference in spine density between control and TTLC-expressing CA1 pyramidal neurons, but Kir2.1-expressing neurons have a significant decrease in spine density (n=10,11, P=0.157; n=10,11, *P=0.001 by Student's t-test). (B) Sample images of dendrites in the MML of DGCs from TTLC- or Kir2.1-expressing mice (left). Quantification of dendritic spine density is shown on the right. There is no difference in spine density between control and TTLC-expressing DGCs (n=11,12, P=0.627 by Student's t-test) at P15. However, spines of Kir2.1-expressing neurons are significantly less dense than control neurons (n=10,10, *P=0.039 by Student's t-test).
DISCUSSION
To approach the question of how integration of a neuron into a network is regulated by its intrinsic excitability, we established transgenic mouse lines in which neuronal excitability is suppressed in a discrete subset of neurons by expression of Kir2.1. This suppression leads to an almost complete cessation of firing in Kir2.1-expressing neurons, as revealed by patch-clamp recordings (Fig. S2), which effectively silences the neurons, as confirmed by Fos immunoreactivity (Fig. 2). Our results reveal that intrinsic excitability plays distinct roles for honing synaptic connectivity in each of the three principal excitatory neurons in the hippocampus. Whereas activity suppression in CA1 pyramidal neurons resulted in both structural and functional synaptic deficits (Fig. 3), CA3 pyramidal neurons were surprisingly resistant to attenuated intrinsic excitability (Fig. 4). We also found that intrinsic excitability was only crucial for later stages of synaptic development (after P15) in CA1 pyramidal neurons (Fig. 5). Similar to CA1 pyramidal neurons, DGCs exhibit decreased synaptic connectivity when excitability is inhibited. However, the synaptic alterations in DGCs differed in three notable respects from the changes observed in CA1. First, although deficits in CA1 neurons were evident in all layers examined, the changes in DGCs were selective to perforant path synapses, suggesting that inputs to DGCs also play specific roles in spine development. Second, DGC spines were affected earlier than CA1 spines (Figs 5, 6). Third, a pronounced compensatory response in axons synapsing onto DGCs maintained normal levels of background synaptic drive (Fig. 7). Finally, we showed that inhibiting neurotransmitter release from a neuron instead of its intrinsic excitability did not alter spine density in either CA1 or the DG at P15 (Fig. 8), corroborating that it is the intrinsic excitability of a neuron and not synaptic transmission from a neuron that plays an important role in spine development. Overall, our work demonstrates that intrinsic excitability has a unique and varied role in determining how different populations of excitatory hippocampal neurons integrate into the developing circuitry.
Previous work on the role of activity within the hippocampus has been primarily focused on circuit-wide forms of global activity manipulation. For example, AMPA-mediated synaptic transmission is weakened at the CA3-to-CA1 synapse if global activity is suppressed by blocking synchronous activity waves (Huupponen et al., 2013). When GABA-induced depolarization was reduced by inactivating NKCC1, both excitatory and inhibitory synaptic maturation were delayed (Pfeffer et al., 2009). When synaptic transmission was silenced in the hippocampus by injecting tetanus toxin into CA1, dendritic development of CA1 pyramidal neurons was stunted (Groc et al., 2002). In this study, we focused on cell-autonomous rather than global manipulations and demonstrated how intrinsic excitability can shape the maturation and density of synapses on the postsynaptic neuron in a cell-autonomous manner. In contrast to global suppression, we did not find changes in dendritic complexity (Fig. 3B; Fig. 4B) but found that spine development was impaired in a region-specific manner.
Recent data suggest that synaptic transmission and neuronal excitability might play differential roles in neuronal development. Axonal development in the olfactory system, the thalamocortical path and the retina are all sensitive to synaptic transmission, because overexpression of Kir2.1 or TTLC alters axonal branching and connectivity (Yu et al., 2004; Yamada et al., 2010; Morgan et al., 2011). However, axonal branching seems to be more sensitive to intrinsic excitability rather than neurotransmitter release; the development of the olfactory sensory map is more severely disrupted by expression of Kir2.1 than by the expression of TTLC (Yu et al., 2004). In addition, suppression of postsynaptic intrinsic excitability also affects axonal branching of presynaptic neurons (Yamada et al., 2010). We found that inhibition of intrinsic excitability, and not neurotransmitter release, affects spine development. Our data add to the evolving picture of how different facets of neural activity contribute to shaping development.
Accumulating evidence suggests that neural activity regulates neuronal development in a cell-type-specific manner. Global activity suppression regulates inhibitory synaptic transmission, whereas cell-autonomous suppression does not (Hartman et al., 2006). By contrast, development of the excitatory synaptic transmission in hippocampal neurons is regulated by cell-autonomous rather than global activity manipulations (Burrone et al., 2002). Furthermore, suppression of intrinsic excitability in developing inhibitory neurons in the caudal ganglionic eminence affects the migration and morphological development of a subset of interneurons in a cell-type-specific manner (De Marco García et al., 2011). These effects are seen in the reelin- and calretinin-positive subset of interneurons but not in the vasoactive intestinal polypeptide-positive subset of interneurons. Likewise, synaptic differentiation of the B6, but not B7 or RB, type of bipolar cell requires neurotransmitter release (Morgan et al., 2011). Together with our results in excitatory neurons of the hippocampus, we propose that different types of neurons respond differently to activity suppression, which is likely to reflect a complex role for neural activity depending on developmental stage, brain region and cell ontogeny.
The compensatory response of DGCs in presynaptic function to lowered postsynaptic excitability bears a strong resemblance to trans-synaptic homeostatic processes observed in hippocampal cell cultures, where postsynaptic activity acts to regulate the probability of neurotransmitter release in terminals synapsing on the affected neuron (Wierenga et al., 2006; Branco et al., 2008; Jakawich et al., 2010; Lindskog et al., 2010). However, in our current experiments CA1 pyramidal neurons do not seem to exhibit this homeostatic response, at least at P21. Given the robust nature of these changes in cell culture, it is possible that CA1 pyramidal neurons in vivo are endowed with similar homeostatic mechanisms later during development. Indeed, study of hippocampal cultures shows that the timing of Kir2.1 expression is crucial for whether or not pyramidal neurons respond in a compensatory manner, with homeostatic processes being evident only if Kir2.1 expression is induced at later stages in culture (Burrone et al., 2002). Testing this possibility in vivo will require future studies.
A major remaining question is: how does similar inhibition of excitability have such drastically different outcomes depending on cell type? One possibility is that the differential effect might be influenced by the time of analysis with respect to the time of neuronal birth. To compare and highlight the relationship between neuronal development and when spine effects are observed in CA1, CA3 and DG cells, we prepared Table S2, tabulating the neurogenic period, the peak of neurogenesis, the peak of synaptogenesis, and the time between the neurogenesis peak and measured effect of Kir2.1. Table S2 shows that even though DGCs are born later, the effect of Kir2.1 is apparent earlier than in either CA1 or CA3. Our results suggest that there might not be a correlation between birthdate and synaptic defects, because: (1) CA1 neurons are born earlier than DGCs, but the effect of suppressed excitability on spine development is earlier in DGCs; (2) we found input-specific effects in DGCs, where spines in the MML are affected and spines in the IML are not, even though this analysis was performed in the same neurons; therefore, these neurons would have exactly the same birthdate and yet the spine effect is different; and (3) CA1 and CA3 pyramidal neurons have similar birthdates and yet no effect on spine density is ever seen in CA3 pyramidal neurons. Another possibility is that these distinct outcomes reflect unique activity-dependent coupling to transcription networks in these principal excitatory neuronal populations. Consistent with this idea, each of these neuronal populations expresses a significantly different basal transcriptome (Newrzella et al., 2007; Greene et al., 2009). Furthermore, CA3 pyramidal neurons have many recurrent collaterals, suggesting that these neurons might have adapted a different transcriptional or translational pathway to shape spine development. An interesting avenue of future research will be to test whether these distinct developmental transcriptomes confer the differential sensitivity to intrinsic excitability between cell types and the time-limited role it seems to play within a cell population during synapse development.
MATERIALS AND METHODS
Animal care
All animal care and use was in accordance with institutional guidelines and was approved by the Institutional Animal Care and Use Committees. Both male and female mice (Mus musculus) were used.
Generation of transgenic mice
The construct to generate Kir2.1-mCherry-expressing mice was created by subcloning Kir2.1 (from V. Murthy, Harvard University, MA, USA), mCherry and IRES-tTA cDNA into the pBI vector (Clontech). To drive expression of Kir2.1/mCherry, the mice generated were crossed with tTA transgenic mice. The tTA mouse line used in this study was generated using a BAC clone, 394B7, as described previously (Yasuda and Mayford, 2006; Yasuda et al., 2011). This particular tTA line, when crossed with the tetO-nls-lacZ line (Yasuda and Mayford, 2006), demonstrated tTA expression pan-neuronally (Fig. 1B). Two double-transgenic lines were used for this study. For morphological analysis, these double-transgenic mice were crossed with thy1-GFP-M mice (Feng et al., 2000). TTLC/tau-lacZ-expressing mice were described previously (Yasuda et al., 2011) and were crossed with the same tTA-expressing and GFP-M lines.
Immunohistochemistry and imaging
Mice were perfused with 4% paraformaldehyde. Brains were removed and post-fixed in 4% paraformaldehyde overnight, then stored in 30% sucrose. Horizontal sections 50 µm thick were cut on a cryostat and collected in PBS. Floating sections were incubated with primary antibodies for 48 h at 4°C, followed by secondary antibodies for 16 h at 4°C. Sections were mounted using p-phenylenediamine. To examine activity-dependent c-Fos expression, mice were injected with 20 mg/kg body weight of kainate to induce generalized seizures, and 1 h after seizure induction the mice were perfused as described above. For c-Fos immunohistochemistry, sections were incubated for 30 min in a sodium citrate buffer at 80°C followed by another hour at room temperature before staining. Primary antibodies were as follows: chicken-anti-GFP (Millipore AB16901, 1:1000), rabbit-anti-DsRed (Clontech 632496, 1:500), mouse anti-β-galactosidase (Sigma G 8021, 1:500) and mouse anti-cFos (Millipore OP17, 1:100).
Confocal images were acquired on an Olympus FV1000 microscope using 10×, 20× and 60× objectives. Twelve-bit images at a resolution of 512×512 or 1024×1024 pixels were acquired. Image analysis was conducted on maximum intensity projections consisting of 10-30 images taken with intervals of 0.3-1.0 µm depth that encompassed the entirety of the dendrite or cell.
Cell counts, dendritic analysis and spine analysis
For cell counts, 20× images were taken on a BX-51 epi-fluorescence microscope (Olympus). mCherry-positive neurons and DAPI-positive cells were both counted from the same field of view using ImageJ. Cell counts are expressed as the percentage of DAPI-positive cells for each region.
For c-Fos analysis, 40× images were taken using identical exposure settings. Images were then analyzed using MetaMorph. The intensity threshold was set by subtracting out intensity measurements in the hilar region of the hippocampus. mCherry immunostaining was overlayed with the c-Fos image, and the percentage of c-Fos-positive cells in control or mCherry-positive cells was calculated.
Dendritic branching was counted manually using the green channel for both control and Kir2.1-expressing pyramidal neurons. For the basal dendrites, the number of branches off of the soma was counted. For the apical dendrites, the number of branches off of the primary dendrite was counted.
Dendritic spine density was evaluated manually using ImageJ. For all analytical purposes, the GFP channel was used so that GFP-only neurons were compared with GFP- and mCherry-positive neurons. Spines were classified as mushroom, stubby, thin or other by a blinded experimenter. Spines were defined as follows: mushroom, where the head width was >0.5 μm and at least twice the neck width; stubby, where there was no neck and the spine length and head width were approximately the same; thin, where the head width was <0.5 μm, with the spine length greater than the width; and other was any spine that did not clearly fit any of these categories owing to its odd shape (Sorra and Harris, 2000; Vanderklish and Edelman, 2002; Auffret et al., 2009; Dumitriu et al., 2010).
Slice preparation and electrophysiology
Acute hippocampal slices were prepared from either P5-P10 or P16-P23 mice. Mice were decapitated and the brains removed, and sections 300 µm thick were cut using a Leica VT1000S vibratome. Slices were then incubated for at least 1 h in artificial cerebral spinal fluid containing (mM): 124 NaCl, 2.8 KCl, 2 MgSO4, 1.25 NaH2PO4, 2 CaCl2, 10 glucose, 26 NaHCO3 and 0.4 ascorbic acid. For recordings in CA3, sections were incubated in an N-methyl-d-glucamine-HEPES recovery solution, containing (mM): 92 N-methyl-d-glucamine, 92 HCl, 2.5 KCl, 10 MgSO4, 0.5 CaCl2, 1.2 NaH2PO4, 20 HEPES, 30 NaHCO3, 25 glucose, 5 sodium ascorbate, 2 thiourea and 3 sodium pyruvate, for 15 min at 34°C before putting the slices into artificial cerebral spinal fluid for 1 h. All solutions were continuously bubbled with 95% O2–5% CO2. Neurons were visualized using a customized Scientifica/Olympus microscope. Data were obtained with a PC-ONE amplifier (Dagan), digitized with Digidata 1440A (Axon Instruments) and collected with Clampex 10.0 (Axon Instruments).
For excitability and spontaneous EPSC recordings, whole-cell patch-clamp recordings were conducted with 4-6 MΩ pipette solution containing (mM): 120 K-MeSO4, 20 KCl, 0.2 EGTA, 10 HEPES, 2 MgCl2, 4 Na2-ATP, 0.3 Tris-GTP and 7 mM phosphocreatine. For mEPSC and eEPSC recordings, internal solution included (mM): 100 gluconic acid, 0.2 EGTA, 5 MgCl2, 2 Mg-ATP, 0.3 Li-GTP and 40 HEPES (pH adjusted to 7.2 with CsOH). Artificial cerebral spinal fluid was supplemented during recording with 500 nM tetrodotoxin (mEPSCs only) and 50 µM picrotoxin.
For stimulation experiments, a cluster electrode (FHC) was placed in the MML of the DG. A 0.1 ms stimulus was delivered every 30 s at a level of 0.05-0.5 mA. Stimulus levels were set to two times the minimal level. Cells were held at −70 mV for miniature, spontaneous and evoked recordings.
For all experiments, control cells were neighboring neurons within the same slices as experimental Kir2.1-expressing neurons.
Excitability and evoked EPSC data were analyzed using Clampfit 10.2 (Axon Instruments). For excitability analysis, neurons were excluded if the input resistance was unstable or if action potentials did not reach 50 mV. Miniature and spontaneous EPSCs were analyzed using Minianalysis (Synaptosoft).
Statistical analysis
All statistical analysis was performed using Sigma Stat 3.5 (Scientific Solutions). The tests performed were Student's two-tailed t-test, one-way ANOVA, two-way ANOVA or χ2 test, as indicated in the figure legend. In the case of ANOVA, post hoc analysis was performed with Tukey's test. All data are expressed as mean±s.e.m.
Acknowledgements
We thank Masahiro Yasuda for the tTA mice; Jerry Chen, Jacqueline Liu and Scott Schwartz for their technical assistance; Mei Zhang and Patricia Lee for animal care; Venkatesh Murthy for the Kir2.1 cDNA; and Wanda Filipiak and the Transgenic Animal Model Core of the University of Michigan for generation of transgenic mice.
Footnotes
Competing interests
The authors declare no competing or financial interests.
Author contributions
E.M.J.-V., M.A.S. and H.U. designed the experiments and wrote the manuscript. E.M.J.-V. and M.N.K. performed the experiments. G.G.M. helped design and analyze the electrophysiological experiments. M.A.S. and H.U. supervised the project. All authors analyzed data and commented on the manuscript.
Funding
This work was supported by the National Institutes of Health [MH085798 to M.A.S.] and Whitehall Foundation and National Institutes of Health [MH091429 to H.U.]. Deposited in PMC for release after 12 months.
Supplementary information
Supplementary information available online at http://dev.biologists.org/lookup/suppl/doi:10.1242/dev.121202/-/DC1
References
- Ackman J. B. and Crair M. C. (2014). Role of emergent neural activity in visual map development. Curr. Opin. Neurobiol. 24, 166-175. 10.1016/j.conb.2013.11.011 [DOI] [PMC free article] [PubMed] [Google Scholar]
- Auffret A., Gautheron V., Repici M., Kraftsik R., Mount H. T. J., Mariani J. and Rovira C. (2009). Age-dependent impairment of spine morphology and synaptic plasticity in hippocampal CA1 neurons of a presenilin 1 transgenic mouse model of Alzheimer's disease. J. Neurosci. 29, 10144-10152. 10.1523/JNEUROSCI.1856-09.2009 [DOI] [PMC free article] [PubMed] [Google Scholar]
- Bayer S. A. (1980a). Development of the hippocampal region in the rat I. Neurogenesis examined with 3H-thymidine autoradiography. J. Comp. Neurol. 190, 87-114. 10.1002/cne.901900107 [DOI] [PubMed] [Google Scholar]
- Bayer S. A. (1980b). Development of the hippocampal region in the rat II. Morphogenesis during embryonic and early postnatal life. J. Comp. Neurol. 190, 115-134. 10.1002/cne.901900108 [DOI] [PubMed] [Google Scholar]
- Beck H. and Yaari Y. (2008). Plasticity of intrinsic neuronal properties in CNS disorders. Nat. Rev. Neurosci. 9, 357-369. 10.1038/nrn2371 [DOI] [PubMed] [Google Scholar]
- Borges K., Gearing M., McDermott D. L., Smith A. B., Almonte A. G., Wainer B. H. and Dingledine R. (2003). Neuronal and glial pathological changes during epileptogenesis in the mouse pilocarpine model. Exp. Neurol. 182, 21-34. 10.1016/S0014-4886(03)00086-4 [DOI] [PubMed] [Google Scholar]
- Branco T., Staras K., Darcy K. J. and Goda Y. (2008). Local dendritic activity sets release probability at hippocampal synapses. Neuron 59, 475-485. 10.1016/j.neuron.2008.07.006 [DOI] [PMC free article] [PubMed] [Google Scholar]
- Burrone J., O'Byrne M. and Murthy V. N. (2002). Multiple forms of synaptic plasticity triggered by selective suppression of activity in individual neurons. Nature 420, 414-418. 10.1038/nature01242 [DOI] [PubMed] [Google Scholar]
- De Marco García N. V., Karayannis T. and Fishell G. (2011). Neuronal activity is required for the development of specific cortical interneuron subtypes. Nature 472, 351-355. 10.1038/nature09865 [DOI] [PMC free article] [PubMed] [Google Scholar]
- Dumitriu D., Hao J., Hara Y., Kaufmann J., Janssen W. G. M., Lou W., Rapp P. R. and Morrison J. H. (2010). Selective changes in thin spine density and morphology in monkey prefrontal cortex correlate with aging-related cognitive impairment. J. Neurosci. 30, 7507-7515. 10.1523/JNEUROSCI.6410-09.2010 [DOI] [PMC free article] [PubMed] [Google Scholar]
- Feng G., Mellor R. H., Bernstein M., Keller-Peck C., Nguyen Q. T., Wallace M., Nerbonne J. M., Lichtman J. W. and Sanes J. R. (2000). Imaging neuronal subsets in transgenic mice expressing multiple spectral variants of GFP. Neuron 28, 41-51. 10.1016/S0896-6273(00)00084-2 [DOI] [PubMed] [Google Scholar]
- Förster E., Zhao S. and Frotscher M. (2006). Laminating the hippocampus. Nat. Rev. Neurosci. 7, 259-268. 10.1038/nrn1882 [DOI] [PubMed] [Google Scholar]
- Fox M. A. and Umemori H. (2006). Seeking long-term relationship: axon and target communicate to organize synaptic differentiation. J. Neurochem. 97, 1215-1231. 10.1111/j.1471-4159.2006.03834.x [DOI] [PubMed] [Google Scholar]
- Fujita S., Toyoda I., Thamattoor A. K. and Buckmaster P. S. (2014). Preictal activity of subicular, CA1, and Dentate Gyrus principal neurons in the dorsal hippocampus before spontaneous seizures in a rat model of temporal lobe epilepsy. J. Neurosci. 34, 16671-16687. 10.1523/JNEUROSCI.0584-14.2014 [DOI] [PMC free article] [PubMed] [Google Scholar]
- Goda Y. and Davis G. W. (2003). Mechanisms of synapse assembly and disassembly. Neuron 40, 243-264. 10.1016/S0896-6273(03)00608-1 [DOI] [PubMed] [Google Scholar]
- Greene J. G., Borges K. and Dingledine R. (2009). Quantitative transcriptional neuroanatomy of the rat hippocampus: evidence for wide-ranging, pathway-specific heterogeneity among three principal cell layers. Hippocampus 19, 253-264. 10.1002/hipo.20502 [DOI] [PMC free article] [PubMed] [Google Scholar]
- Groc L., Petanjek Z., Gustafsson B., Ben-Ari Y., Hanse E. and Khazipov R. (2002). In vivo blockade of neural activity alters dendritic development of neonatal CA1 pyramidal cells. Eur. J. Neurosci. 16, 1931-1938. 10.1046/j.1460-9568.2002.02264.x [DOI] [PubMed] [Google Scholar]
- Guerrini R., Striano P., Catarino C. and Sisodiya S. M. (2011). Neuroimaging and neuropathology of Dravet syndrome. Epilepsia 52, 30-34. 10.1111/j.1528-1167.2011.02998.x [DOI] [PubMed] [Google Scholar]
- Hartman K. N., Pal S. K., Burrone J. and Murthy V. N. (2006). Activity-dependent regulation of inhibitory synaptic transmission in hippocampal neurons. Nat. Neurosci. 9, 642-649. 10.1038/nn1677 [DOI] [PubMed] [Google Scholar]
- Hemond P., Migliore M., Ascoli G. A. and Jaffe D. B. (2009). The membrane response of hippocampal CA3b pyramidal neurons near rest: Heterogeneity of passive properties and the contribution of hyperpolarization-activated currents. Neuroscience 160, 359-370. 10.1016/j.neuroscience.2009.01.082 [DOI] [PMC free article] [PubMed] [Google Scholar]
- Huupponen J., Molchanova S. M., Lauri S. E. and Taira T. (2013). Ongoing intrinsic synchronous activity is required for the functional maturation of CA3-CA1 glutamatergic synapses. Cereb. Cortex 23, 2754-2764. 10.1093/cercor/bhs262 [DOI] [PubMed] [Google Scholar]
- Jakawich S. K., Nasser H. B., Strong M. J., McCartney A. J., Perez A. S., Rakesh N., Carruthers C. J. and Sutton M. A. (2010). Local presynaptic activity gates homeostatic changes in presynaptic function driven by dendritic BDNF synthesis. Neuron 68, 1143-1158. 10.1016/j.neuron.2010.11.034 [DOI] [PMC free article] [PubMed] [Google Scholar]
- Kaphzan H., Buffington S. A., Jung J. I., Rasband M. N. and Klann E. (2011). Alterations in intrinsic membrane properties and the axon initial segment in a mouse model of Angelman syndrome. J. Neurosci. 31, 17637-17648. 10.1523/JNEUROSCI.4162-11.2011 [DOI] [PMC free article] [PubMed] [Google Scholar]
- Kirkby L. A., Sack G. S., Firl A. and Feller M. B. (2013). A role for correlated spontaneous activity in the assembly of neural circuits. Neuron 80, 1129-1144. 10.1016/j.neuron.2013.10.030 [DOI] [PMC free article] [PubMed] [Google Scholar]
- Koyama R. and Matsuki N. (2010). Novel etiological and therapeutic strategies for neurodiseases: mechanisms and consequences of febrile seizures: lessons from animal models. J. Pharmacol. Sci. 113, 14-22. 10.1254/jphs.09R19FM [DOI] [PubMed] [Google Scholar]
- Lindskog M., Li L., Groth R. D., Poburko D., Thiagarajan T. C., Han X. and Tsien R. W. (2010). Postsynaptic GluA1 enables acute retrograde enhancement of presynaptic function to coordinate adaptation to synaptic inactivity. Proc. Natl. Acad. Sci. USA 107, 21806-21811. 10.1073/pnas.1016399107 [DOI] [PMC free article] [PubMed] [Google Scholar]
- Lynch M. A. (2004). Long-term potentiation and memory. Physiol. Rev. 84, 87-136. 10.1152/physrev.00014.2003 [DOI] [PubMed] [Google Scholar]
- Mathern G. W., Babb T. L., Vickrey B. G., Melendez M. and Pretorius J. K. (1995). The clinical-pathogenic mechanisms of hippocampal neuron loss and surgical outcomes in temporal lobe epilepsy. Brain 118, 105-118. 10.1093/brain/118.1.105 [DOI] [PubMed] [Google Scholar]
- Morgan J. L., Soto F., Wong R. O. L. and Kerschensteiner D. (2011). Development of cell type-specific connectivity patterns of converging excitatory axons in the retina. Neuron 71, 1014-1021. 10.1016/j.neuron.2011.08.025 [DOI] [PMC free article] [PubMed] [Google Scholar]
- Newrzella D., Pahlavan P., Krüger C., Boehm C., Sorgenfrei O., Schröck H., Eisenhardt G., Bischoff N., Vogt G., Wafzig O. et al. (2007). The functional genome of CA1 and CA3 neurons under native conditions and in response to ischemia. BMC Genomics 8, 370 10.1186/1471-2164-8-370 [DOI] [PMC free article] [PubMed] [Google Scholar]
- Nowacki J., Osinga H. M., Brown J. T., Randall A. D. and Tsaneva-Atanasova K. (2011). A unified model of CA1/3 pyramidal cells: an investigation into excitability. Prog. Biophys. Mol. Biol. 105, 34-48. 10.1016/j.pbiomolbio.2010.09.020 [DOI] [PubMed] [Google Scholar]
- Petrak L. J., Harris K. M. and Kirov S. A. (2005). Synaptogenesis on mature hippocampal dendrites occurs via filopodia and immature spines during blocked synaptic transmission. J. Comp. Neurol. 484, 183-190. 10.1002/cne.20468 [DOI] [PubMed] [Google Scholar]
- Pfeffer C. K., Stein V., Keating D. J., Maier H., Rinke I., Rudhard Y., Hentschke M., Rune G. M., Jentsch T. J. and Hubner C. A. (2009). NKCC1-dependent GABAergic excitation drives synaptic network maturation during early hippocampal development. J. Neurosci. 29, 3419-3430. 10.1523/JNEUROSCI.1377-08.2009 [DOI] [PMC free article] [PubMed] [Google Scholar]
- Santoro B., Chen S., Lüthi A., Pavlidis P., Shumyatsky G. P., Tibbs G. R. and Siegelbaum S. A. (2000). Molecular and functional heterogeneity of hyperpolarization-activated Pacemaker channels in the mouse CNS. J. Neurosci. 20, 5264-5275. [DOI] [PMC free article] [PubMed] [Google Scholar]
- Sorra K. E. and Harris K. M. (2000). Overview on the structure, composition, function, development, and plasticity of hippocampal dendritic spines. Hippocampus 10, 501-511. 10.1002/1098-1063(2000)10:5<501::AID-HIPO1>3.0.CO;2-T [DOI] [PubMed] [Google Scholar]
- Spigelman I., Zhang L. and Carlen P. L. (1992). Patch-clamp study of postnatal development of CA1 neurons in rat hippocampal slices: membrane excitability and K+ currents. J. Neurophysiol. 68, 55-69. [DOI] [PubMed] [Google Scholar]
- Spruston N. and McBain C. (2006). Structural and Functional Properties of Hippocampal Neurons. Oxford, UK: Oxford University Press. [Google Scholar]
- Tyzio R., Ivanov A., Bernard C., Holmes G. L., Ben-Ari Y. and Khazipov R. (2003). Membrane potential of CA3 hippocampal pyramidal cells during postnatal development. J. Neurophysiol. 90, 2964-2972. 10.1152/jn.00172.2003 [DOI] [PubMed] [Google Scholar]
- Vanderklish P. W. and Edelman G. M. (2002). Dendritic spines elongate after stimulation of group 1 metabotropic glutamate receptors in cultured hippocampal neurons. Proc. Natl. Acad. Sci. USA 99, 1639-1644. 10.1073/pnas.032681099 [DOI] [PMC free article] [PubMed] [Google Scholar]
- Waites C. L., Craig A. M. and Garner C. C. (2005). Mechanisms of vertebrate synaptogenesis. Annu. Rev. Neurosci. 28, 251-274. 10.1146/annurev.neuro.27.070203.144336 [DOI] [PubMed] [Google Scholar]
- Wierenga C. J., Walsh M. F. and Turrigiano G. G. (2006). Temporal regulation of the expression locus of homeostatic plasticity. J. Neurophysiol. 96, 2127-2133. 10.1152/jn.00107.2006 [DOI] [PubMed] [Google Scholar]
- Yamada A., Uesaka N., Hayano Y., Tabata T., Kano M. and Yamamoto N. (2010). Role of pre- and postsynaptic activity in thalamocortical axon branching. Proc. Natl. Acad. Sci. USA 107, 7562-7567. 10.1073/pnas.0900613107 [DOI] [PMC free article] [PubMed] [Google Scholar]
- Yasuda M. and Mayford M. R. (2006). CaMKII activation in the entorhinal cortex disrupts Previously encoded spatial memory. Neuron 50, 309-318. 10.1016/j.neuron.2006.03.035 [DOI] [PubMed] [Google Scholar]
- Yasuda M., Johnson-Venkatesh E. M., Zhang H., Parent J. M., Sutton M. A. and Umemori H. (2011). Multiple forms of activity-dependent competition refine hippocampal circuits in vivo. Neuron 70, 1128-1142. 10.1016/j.neuron.2011.04.027 [DOI] [PMC free article] [PubMed] [Google Scholar]
- Yu C. R., Power J., Barnea G., O'Donnell S., Brown H. E., Osborne J., Axel R. and Gogos J. A. (2004). Spontaneous neural activity is required for the establishment and maintenance of the olfactory sensory map. Neuron 42, 553-566. 10.1016/S0896-6273(04)00224-7 [DOI] [PubMed] [Google Scholar]
- Zhang L. I. and Poo M.-M. (2001). Electrical activity and development of neural circuits. Nat. Neurosci. 4 Suppl., 1207-1214. 10.1038/nn753 [DOI] [PubMed] [Google Scholar]