Abstract
PURPOSE
We aimed to investigate the effect of key imaging parameters on the accuracy of apparent diffusion coefficient (ADC) maps using a phantom model combined with ADC calculation simulation and propose strategies to improve the accuracy of ADC quantification.
METHODS
Diffusion-weighted imaging (DWI) sequences were acquired on a phantom model using single-shot echo-planar imaging DWI at 1.5 T scanner by varying key imaging parameters including number of averages (NEX), repetition time (TR), echo time (TE), and diffusion preparation pulses. DWI signal simulations were performed for varying TR and TE.
RESULTS
Magnetic resonance diffusion signal and ADC maps were dependent on TR and TE imaging parameters as well as number of diffusion preparation pulses, but not on the NEX. However, the choice of a long TR and short TE could be used to minimize their effects on the resulting DWI sequences and ADC maps.
CONCLUSION
This study shows that TR and TE imaging parameters affect the diffusion images and ADC maps, but their effect can be minimized by utilizing diffusion preparation pulses. Another key imaging parameter, NEX, is less relevant to DWI and ADC quantification as long as DWI signal-to-noise ratio is above a certain level. Based on the phantom results and data simulations, DWI acquisition protocol can be optimized to obtain accurate ADC maps in routine clinical application for whole body imaging.
Diffusion-weighted imaging (DWI) measures the degree of water mobility, i.e., random Brownian motion, in vivo and is a noninvasive tool (1–3). DWI has been used mainly in cranial magnetic resonance imaging (MRI) applications to visualize stroke, neoplasms, intracranial infections, traumatic brain injury, and demyelinating processes since early 1990s (4–8). However, in recent years, DWI applications has been extended to breast, musculoskeletal, liver, prostate, pelvis, and general whole body imaging with the development of multichannel coils, parallel imaging, faster gradients, and MRI hardware (9–14). DWI can provide a quantitative map of water diffusion coefficient. Water diffusion coefficient can be calculated from diffusion-weighted images using at least two different DWI values. DWI is achieved by applying diffusion gradients and is called the b-value. Water diffusion coefficient in the tissue is called apparent diffusion coefficient (ADC) and can be calculated from diffusion-weighted images using a linear regression analysis. The term “apparent” is used for diffusion coefficient to differentiate from true diffusion coefficient since the measured water diffusion coefficient in the tissue is influenced by a number of other factors such as capillary network orientation and gross motion in addition to random Brownian motion. ADC measurements are considered to be of greater importance in differential diagnosis of various pathological conditions and its accurate measurement is of great importance (12, 13, 15–18).
In the past, the magnetic resonance gradients were much slower and repetition time (TR) and echo-time (TE) were quite long. Thanks to the fast pace of advancement in MRI, the imaging parameters were shortened significantly. Therefore, TR and TE could be reduced in such a way that they could be comparable to tissue relaxation times (T1 and T2) in order to reduce susceptibility artifacts and the total scan time for various DWI applications. As a result of this development, the selection of user controlled imaging parameters, such as TE, number of averages (NEX), number of diffusion preparation pulse, b-value and TR, became much more relevant to DWI and ADC mapping (19–22). However, dependency of ADC maps on some of the user controlled imaging parameters were investigated by few studies in a limited manner (19–25). It is important to mention that even though multi-shot and three-dimensional (3D) DWI sequences are recently proposed to improve diffusion image quality (26–28), single-shot echo-planar imaging (ssEPI) pulse sequence has been the primary sequence in use for DWI in clinical practice for the last two decades.
The purpose of this study is to systematically investigate the effects of user controlled diffusion-weighted MRI parameters on ADC values by uniquely combining phantom studies with diffusion signal simulations and to give an insight into optimizing those parameters to obtain more precise ADC maps using the most commonly used ssEPI-based DWI sequence.
Methods
Phantom studies
Phantom studies were performed on a 1.5 T MRI system (GE Healthcare). The gradient strength and slew rate of the system were 33 mT/m and 120 T/m/s, respectively. A liquid gel phantom was used in this study. Images were acquired using an ssEPI DWI sequence. The imaging parameters were b=600 s/mm2; FOV, 20 cm; imaging matrix, 64×64; and a single average (NEX=1). First set of DWI sequences were acquired using a TR of 1, 1.5, 2, 3, 4, 5, 6, 7, 8, 10, 12, 14, 16, and 17 s to investigate the TR effect, while TE was set to 68 ms (minimum TE time achievable for the selected protocol). Second set of DWI sequences were acquired using a TE of 68 ms, 80 ms, 100 ms, 120 ms, 140 ms, 160 ms, and 200 ms to investigate the TE effect, while TR was set to 8 s. Third set of DWI sequences were acquired using a NEX of 1, 2, 4, 8, 12, and 16 to investigate the NEX effect, while TR and TE were set to 8 s and 68 ms, respectively. Fourth set of DWI sequences were acquired using a diffusion preparation pulse of 0 (no preparation pulse), 1, 2, 3, 4, 6, 8, and 12 to investigate the preparation pulse effect, while TR and TE were set to 1 s and 68 ms, respectively. The last set of DWI sequences were acquired using TR of 1, 1.5, 2, 3, 4, 5, 6, 7, 8, 10, 12, 14, 16, and 17 s, while the number of diffusion preparation pulses were set to 0, 1, and 4 in each acquisition set.
The phantom was placed in the MRI scanner room for two hours prior to scanning to stabilize its temperature at scanner room temperature (22°C). Parallel imaging was not used in this study to measure the signal-to-noise ratio (SNR) more accurately as it has been known to affect the noise structure in MRI (23, 24). The T1 and T2 relaxation times of the phantom are measured as 1273 ms and 315 ms, respectively. An 8-channel phased-array brain coil was used for this study.
Data processing and measurements
Acquired DWI sequences were processed using commercially available software (Functool, GE Healthcare) to produce ADC maps of acquired axial slices. ADC values were measured over two central axial slices of the phantom from four different regions of interest. For each measurement, two regions of interest were manually drawn on each slice at the upper and lower half of the phantom excluding the edge of the phantom.
Data simulations
DWI signal simulation and ADC calculations were performed by varying the TR and TE and using the phantom relaxation parameters (T2=315 ms and T1=1273 ms). MRI signal model for b=0 and 600 s/mm2 are given in Equations 1 and 2, respectively. In general, TR is defined as the time between two consecutive radio frequency (RF) excitation pulses in MRI pulse sequences. For any single-shot MRI sequence, such as ssEPI, TR is considered to be infinitely long and is not part of MRI signal equation. However, ssEPI-based diffusion acquisition repeats the RF pulses multiple times depending on the number of b-values chosen by the user and TR has to be included in the MRI signal model (33) as shown in Equation 1:
| Equation 1 |
Where, T1 is tissue longitudinal relaxation time; T2, tissue transverse relaxation time; PD, tissue proton density; TE, echo time; TR, repetition time; b, diffusion weighting value; D, diffusion coefficient.
ADC values are calculated from Equations 1 and 2 as shown below:
| Equation 2 |
| Equation 3 |
The diffusion signal simulation in this study is based on the repeated ssEPI MRI signal (33). Due to repeated ssEPI acquisition, the T1 saturation effect becomes an important parameter and the T1 component of MRI signal needs to be introduced into the MRI signal model as given in Equation 1. The diffusion-weighted MRI signal with a b value is given in Equation 2, representing the diffusion-weighted MRI signal. Equations 1 and 2 are then combined to calculate the ADC values using linear regression method. The simulations in this study were performed for varying TR while fixing TE at minimum value and varying TE while fixing the TR at a specific value (8 s). All simulations were performed using commercially available software (Excel Sheet, Microsoft Corp). In the simulation, the TR or TE values were incremented in small steps (approximately 1 ms increments). However, identical TR and TE parameters used in phantom experiments were chosen in the simulation plots.
It is important to note that in the simulation some of the constant terms related to MRI hardware (e.g., eddy current, gradient non-linearity, receiver gains) and phantom density are not known. Therefore, the simulated ADC values are in arbitrary units and should be treated as such. However, simulated ADC values would be directly proportional to MRI ADC measurements.
Statistical analysis
Data were analyzed using commercially available software (Excel Sheet, Microsoft Corp and XLSTAT by Addinsoft) and Mann Whitney U test was used for statistical analysis. There were four measurements for each group of data. P < 0.05 was considered as statistically significant. The measured values are presented as median (min–max).
Results
The acquired phantom images with two b values (0 s/mm2 and 600 s/mm2) and the corresponding ADC map are shown in Fig. 1. The central slices of the phantom were used for all measurements.
Figure 1 a–c.
Diffusion-weighted images for b=0 s/mm2 (a), b=600 s/mm2 (b) and the corresponding ADC map (c) of the phantom.
The phantom ADC measurements are summarized in Table for varying TR, TE, NEX, and number of diffusion preparation pulses along with statistical analysis results.
Table.
Measured phantom ADC values as a function of imaging parameters
| TR (s) | ADC value (mm2/s ×10−6) median (min–max) | Pa | TE (ms) | ADC value (mm2/s ×10−6) median (min–max) | Pb | NEX | ADC value (mm2/s ×10−6) median (min–max) | Pa | No. of RF prep pulses | ADC value (mm2/s ×10−6) median (min–max) | Pa |
|---|---|---|---|---|---|---|---|---|---|---|---|
| 1.0 | 1794 (1751–1836) | 68 | 1424 (1391–1458) | 1 | 1428 (1413–1444) | 0 | 2521 (2381–2660) | ||||
| 1.5 | 1617 (1566–1688) | 0.029 | 80 | 1458 (1423–1493) | 0.343 | 2 | 1431 (1416–1447) | 0.686 | 1 | 1645 (1515–1775) | 0.029 |
| 2.0 | 1481 (1459–1503) | 0.029 | 100 | 1474 (1441–1508) | 0.114 | 4 | 1431 (1414–1448) | 0.886 | 2 | 1499 (1411–1587) | 0.20 |
| 3.0 | 1423 (1403–1442) | 0.029 | 120 | 1512 (1467–1557) | 0.029 | 8 | 1433 (1416–1449) | 0.686 | 3 | 1445 (1384–1507) | 0.49 |
| 4.0 | 1422 (1402–1442) | 0.686 | 140 | 1545 (1491–1599) | 0.029 | 12 | 1428 (1410–1446) | 0.686 | 4 | 1436 (1384–1489) | 0.686 |
| 5.0 | 1426 (1406–1445) | 0.686 | 160 | 1569 (1512–1667) | 0.029 | 16 | 1430 (1415–1445) | 0.886 | 5 | 1433 (1386–1480) | 0.886 |
| 6.0 | 1427 (1406–1448) | 0.886 | 200 | 1601 (1568–1664) | 0.029 | 6 | 1436 (1384–1490) | 0.886 | |||
| 7.0 | 1425 (1403–1447) | 0.686 | 8 | 1442 (1381–1504) | 0.686 | ||||||
| 8.0 | 1427 (1409–1445) | 0.886 | 12 | 1430 (1381–1479) | 0.886 | ||||||
| 10.0 | 1424 (1408–1440) | 0.686 | |||||||||
| 12.0 | 1427 (1410–1443) | 0.686 | |||||||||
| 14.0 | 1423 (1407–1439) | 0.686 | |||||||||
| 16.0 | 1424 (1410–1437) | 0.886 | |||||||||
| 17.0 | 1428 (1410–1446) | 0.686 |
TR, repetition time; ADC, apparent diffusion coefficient; TE, echo time; NEX, number of averages; RF, radio frequency.
Pa values are shown for the consecutive measurements for each parameter; Pb values are shown with respect to minimum TE value, as it is the most commonly used parameter.
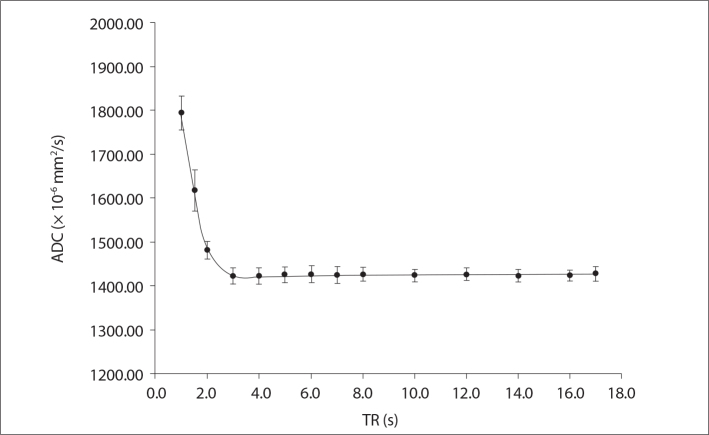
Fig. 2 shows the measured ADC maps for 14 different TR values ranging from 1 to 17 s. Fig. 2 indicates that the ADC maps have TR dependence. ADC value was significantly higher for TR values shorter than 3 s (P = 0.029 for TR of 1 s, 1.5 s, 2 s, and 3 s, respectively). On the other hand, there was no statistically significant difference in the measured ADC values for TR values longer than 3 s (P = 0.686).
Figure 2.
Measured phantom ADC values as a function of repetition time (TR) values ranging from 1 s to 17 s.
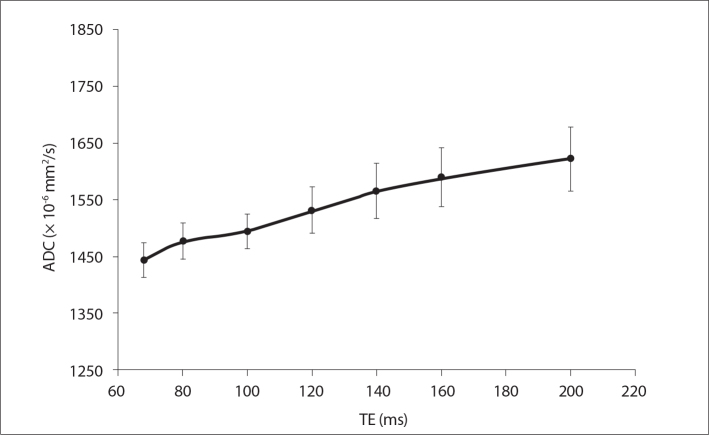
Fig. 3 shows the measured ADC maps for seven different TE values ranging from 68 ms to 200 ms indicating that ADC values have TE dependence. The increase in ADC values was significantly higher (P = 0.029) for TE = 120 ms compared with minimum possible TE (68 ms).
Figure 3.
Measured phantom ADC values as a function of echo time (TE) values ranging from 68 to 200 ms, for a TR value of 8 s.
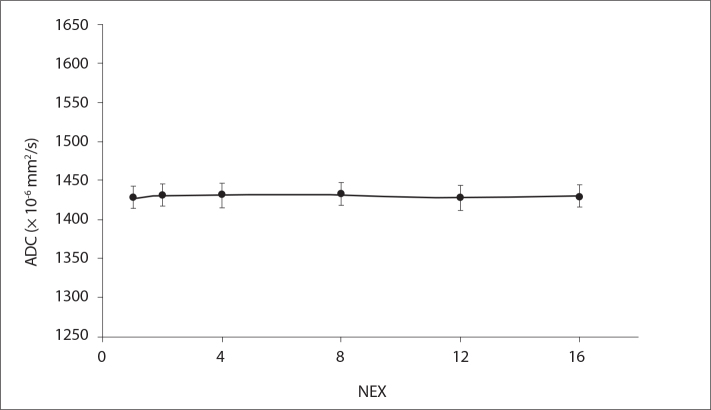
Fig. 4 shows the measured ADC maps for six different NEX values ranging from 1 to 16. There was no statistically significant difference (P = 0.686 for NEX=2, 8, and 12; P = 0.886 for NEX=4 and 16) in the measured ADC values as a function of selected NEX value. There was no significant difference in the measured ADC values based on NEX selection.
Figure 4.
Measured phantom ADC values as a function of the number of averages (NEX) ranging from 1 to 16.
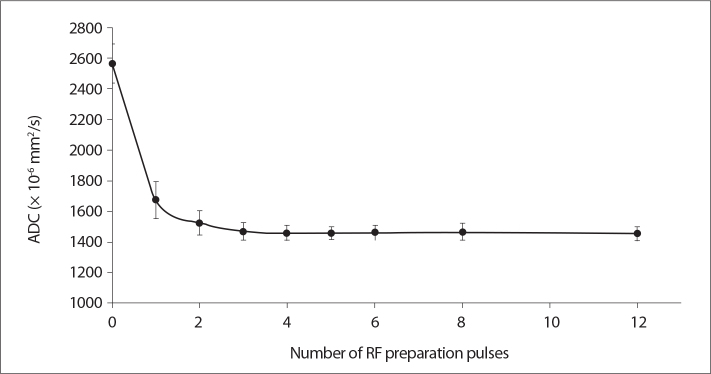
Fig. 5 shows the measured ADC maps for nine different RF preparation pulses for a very short TR (1 s) and minimum TE (68 ms). The results clearly showed that RF preparation is a significant factor on ADC values even though it may not be a parameter directly accessible by the user depending on the vendor (P = 0.029) for single RF preparation pulse vs. no preparation pulse). However, there was no statistically significant difference among the measured ADC values using at least one RF preparation pulse (P = 0.20, for 2 RF; P = 0.49, for 3 RF; P = 0.686, for 4 and 8 RF; P = 0.886, for 5, 6, and 12 RF). DWI without any preparation pulse resulted in a significant overestimation of ADC values for the very short TR value of 1 s. Using at least one or preferably two preparation pulses greatly reduced the ADC overestimation in this case.
Figure 5.
Measured phantom ADC values as a function of number of radio frequency (RF) preparation pulses ranging from 0 to 12, for a TR value of 1 s and TE value of 68 ms.
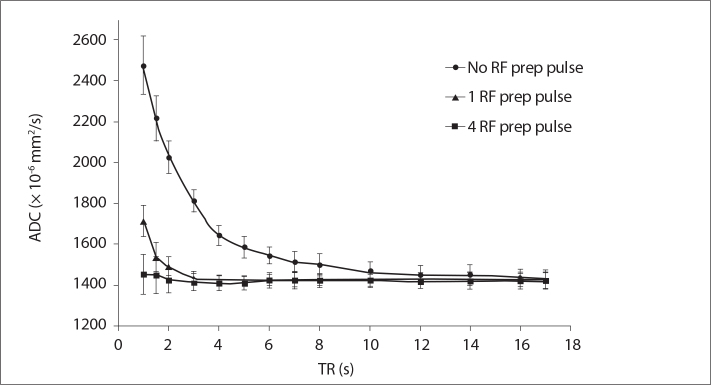
Fig. 6 is closely related to Fig. 5 and shows the RF preparation pulse effect from a different perspective. Fig. 6 shows the measured ADC maps for 14 different TR values either with no RF preparation pulse, or with one and four RF preparation pulses applied. Figs. 5 and 6 show quite an interesting fact that the TR dependence of ADC measurements can simply be significantly reduced by utilizing RF preparation pulse in the DWI scans even if a very short TR is used in the acquisition.
Figure 6.
Measured phantom ADC values as a function of TR values, with no preparation pulse, one preparation pulse, and four preparation pulses.
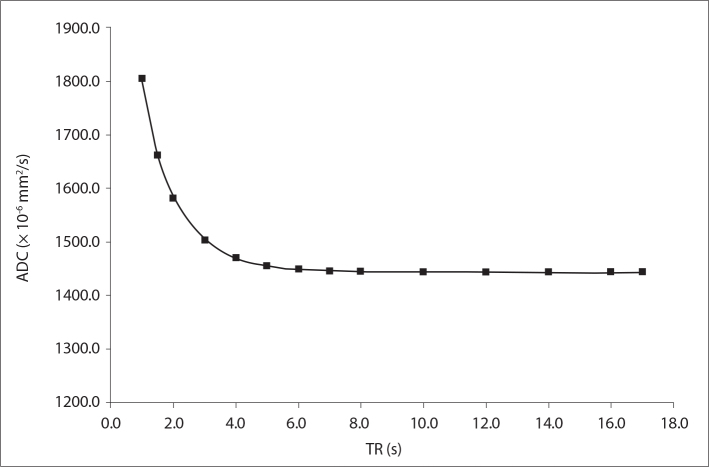
Fig. 7 shows the computer simulations of DWI signal and calculated ADC maps using the MRI signal model described above as a function of TR. To better understand the simulation results, the exact same TR values used in the phantom studies were used in the simulation. The DWI signal simulations are in excellent agreement with the phantom measurements shown in Fig. 2 and confirm the TR dependence of ADC values.
Figure 7.
Simulated phantom ADC values as a function of TR values ranging from 1 s to 17 s.
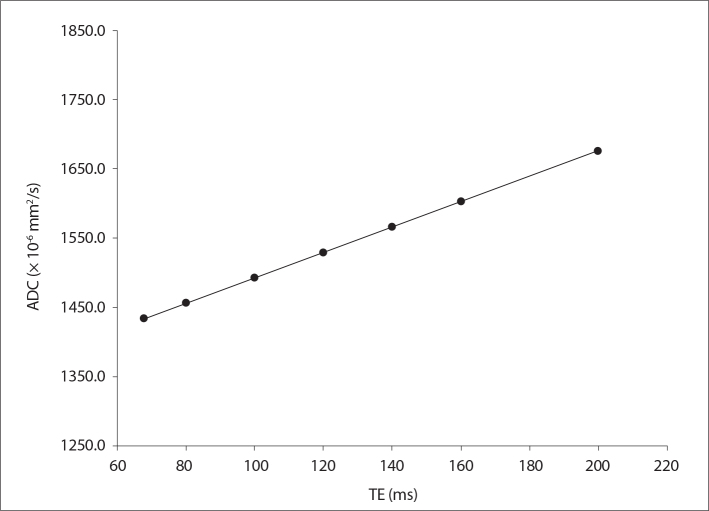
Fig. 8 shows the computer simulations of DWI signal and calculated ADC maps using the MRI signal model as a function of TE. To simplify the simulation results, the exact same seven different TE values used in the phantom studies were used in the simulation. The simulations showed a slight upward trend in the calculated ADC values as a function of TE and were in good agreement with the phantom measurements shown in Fig. 3. However, it is important to point out that the TE effect on ADC values in the clinically relevant protocol with TE values smaller than 100 ms were rather small.
Figure 8.
Simulated phantom ADC values as a function of TE values ranging from 68 to 200 ms.
Discussion
In this study, the effects of user controlled MRI diffusion parameters on ADC values were investigated by uniquely combining phantom studies with MRI diffusion signal simulations. Results in this study clearly showed that the TR value does have an effect on ADC values. Based on the phantom measurements and computer simulations, ADC measurements are affected by the user selected TR values, especially if it is comparable to the phantom relaxation time. The degree of TR dependence is also codependent on another parameter called number of diffusion preparation pulses. We believe that ADC values are affected by TR values because the phantom (tissue) MRI signal is not fully recovered after the first acquisition in DWI and the resulting signal in the second acquisition is less than what it should be (21, 22). This saturation effect due to very short TR selection caused an overestimation of measured ADC values as shown in Figs. 2 and 6. This problem can be solved in clinical practice simply by choosing a TR approximately five-times longer than the tissue (or phantom) T1 relaxation time as reported in the literature (32, 33). However, Fig. 6 also shows very clearly that very short TR can be used if the diffusion pulse sequence uses diffusion preparation pulses. As shown in Fig. 6, approximately five-times and two-times of the phantom relaxation time are required to get an accurate ADC measurement if no RF preparation pulse and a single RF preparation pulses are used, respectively. However, it is quite striking that TR can be on the order of phantom relaxation time (about 1 s) when four RF preparation pulses are used in the DWI scan. The RF preparation pulses are quite practical in DWI scanning as they increase the scan time minimally. For example, if four preparation pulses are used for a TR value of 1 s, total scan time would increase by 4 s only.
Similar to TR dependence of ADC values, it is expected that there could be a TE dependence on ADC values. In fact, Wang et al. (19) found a modest correlation between TE and ADC values in the prostate. However, surprisingly, the correlation was present on the normal prostate tissue but not on cancer tissue in the prostate. In another study, at 1.5 T and 3.0 T, Qin et al. (20) did not find any effect of TE on the measured brain white matter ADC values. In our study, there was a clear but somewhat small TE effect on the phantom ADC values, especially with the choice of longer TE (>100 ms) as shown in Fig. 3. In good agreement with phantom results, the simulations also showed a modest increase in ADC values with longer TE, as shown in Fig. 8. The phantom and simulation results were also in agreement with reported results in normal prostate tissues (19). We believe that the different results reported in the literature are related to tissue specific relaxation time parameters at different anatomies and other imaging parameters. However, based on the reported results in this study, as well as the literature (19, 20), it is still recommended to use the minimum possible TE to reduce diffusion susceptibility artifacts, to optimize the number of slices acquired in the DWI scan and to minimize the TE effect on the measured ADC values.
NEX is another common parameter used in DWI to improve the SNR with small anatomical structures. The results in this study show that the measured ADC values are not dependent on the NEX value as shown in Fig. 4. This was somewhat expected, as NEX should not interfere with ADC measurements. In fact, it was reported in pediatric patients that ADC and fractional anisotropy measurements were not different on 1, 2, and 3 NEX acquisition but the clinical confidence and overall image quality perception was better at higher NEX selection (25). The SNR increase with higher NEX selection may associate with better clinical outcome but does not have a direct effect on ADC values as long as SNR is sufficient (>20) to accurately measure ADC values from DWI sequences (23, 25). SNR values are dependent on several factors and NEX can be a practical imaging parameter to use to improve SNR at the expense of longer scan times.
To our knowledge, the number of diffusion preparation pulses has not been investigated in detail in routine DWI before. In this study, we show that it can be used to improve ADC measurement precision when very short TR values are selected. The diffusion preparation pulses are the pulses applied repeatedly before the actual acquisition takes place and causes the MRI signal to reach equilibrium. Therefore, the DWI signal will be independent of the selected TR value and it would be preferable to utilize preparation pulses in DWI applications.
The b-value selection is another very relevant and important imaging parameter for clinical applications as well. Therefore, there are a number of studies investigating the optimum b-value for different DWI applications (29–31). However, the reported optimum b-values in the literature are quite diverse even for the same anatomical regions and the differences in the range of reported optimum b-values are expected due to the dependencies shown in this study. We believe that tissue specific relaxation time parameters such as T1 and T2 and imaging parameters such as TR and TE affects the optimum b-value for different anatomies, tissues, and even lesion types within the same organ. The RF preparation pulse dependence shown in this study also brings up the topic of diffusion pulse sequence design differences at different MRI system vendors and may help to explain some of the recently reported MRI system vendor dependent ADC value measurements (34).
This study has some limitations. First, we used a phantom model, which is not a representation of living tissue and does not contain complicated compartments and structures. However, the phantom model also makes it possible to create a controlled environment, where the imaging parameter effects can be evaluated more accurately by minimizing external factors such as patient motion and intrasubject variability. The second limitation is the lack of perfusion effects on DWI due to the single and homogeneous phantom fluid used in the study. Based on earlier studies, we expect that the b values used in this study are high enough to minimize the perfusion effects (35). The third limitation of the study is the increased truncation artifacts seen at the perimeter of the phantom due to significant susceptibility difference between the air and phantom medium. This truncation or ring artifact could contribute to increased variation of the measured ADC values on the phantom. To minimize ring artifact, ADC values were measured from multiple regions of interest to average out the truncation artifacts.
In conclusion, the phantom results combined with DWI signal simulations clearly showed that ADC values can be influenced by key imaging parameters such as TR, TE, and diffusion preparation pulses, but not by the NEX selection. At 1.5 T, an optimized DWI protocol should be using a relatively long TR, minimum available TE, at least one diffusion preparation pulse, and a user-decided NEX value, providing sufficient SNR. For high-field applications, the TR should be longer to take the prolonged T1 relaxation times with higher field strengths into account. Diffusion preparation pulses can also be used to practically eliminate the need for longer TR in DWI applications.
Main points.
DWI quality and ADC map accuracy can be affected by imaging parameters selection.
Very short TR (comparable to longest T1 relaxation time of a tissue of interest) selection may result in overestimation of ADC values. However, TR effect can be minimized with the utilization of preparation pulses.
Selection of TE has a rather small effect on ADC maps and minimum TE selection is recommended for DWI protocol.
NEX parameter can be selected to provide sufficient SNR as it has no direct effect on ADC quantification.
Optimization of imaging parameters can improve the quality and accuracy of diffusion-weighted images and ADC maps.
Footnotes
Conflict of interest disclosure
The author is an employee of GE Healthcare, Turkey.
References
- 1.Le Bihan D, Breton E, Lallemand D, et al. MR imaging of intravoxel incoherent motions: application to diffusion and perfusion in neurologic disorders. Radiology. 1986;161:401–407. doi: 10.1148/radiology.161.2.3763909. http://dx.doi.org/10.1148/radiology.161.2.3763909. [DOI] [PubMed] [Google Scholar]
- 2.Mascalchi M, Filippi M, Floris R, et al. Diffusion-weighted MR of the brain: methodology and clinical application. Radiol Med. 2005;109:155–197. [PubMed] [Google Scholar]
- 3.Le Bihan D, Johansen-Berg H. Diffusion MRI at 25: Exploring brain tissue structure and function. Neuroimage. 2012;61:324–341. doi: 10.1016/j.neuroimage.2011.11.006. http://dx.doi.org/10.1016/j.neuroimage.2011.11.006. [DOI] [PMC free article] [PubMed] [Google Scholar]
- 4.Ulug AM, Beauchamp N, Bryan RN, et al. Absolute quantitation of diffusion constants in human stroke. Stroke. 1997;284:83–90. doi: 10.1161/01.str.28.3.483. http://dx.doi.org/10.1161/01.str.28.3.483. [DOI] [PubMed] [Google Scholar]
- 5.Warach S, Chien D, Li W, et al. Fast magnetic resonance diffusion-weighted imaging of acute human stroke. Neurology. 1992;42:1717–1723. doi: 10.1212/wnl.42.9.1717. http://dx.doi.org/10.1212/WNL.42.9.1717. [DOI] [PubMed] [Google Scholar]
- 6.Schaefer PW, Grant PE, Gonzalez RG. Diffusion-weighted MR imaging of the brain. Radiology. 2000;217:331–345. doi: 10.1148/radiology.217.2.r00nv24331. http://dx.doi.org/10.1148/radiology.217.2.r00nv24331. [DOI] [PubMed] [Google Scholar]
- 7.Seo HS, Chang KH, Na DG, et al. High b-value diffusion (b=3000 s/mm2) MR imaging in cerebral gliomas at 3T: visual and quantitative comparisons with b=1000 s/mm2. AJNR Am J Neuroradiol. 2008;29:458–463. doi: 10.3174/ajnr.A0842. http://dx.doi.org/10.3174/ajnr.A0842. [DOI] [PMC free article] [PubMed] [Google Scholar]
- 8.Tsuchiya K, Honya K, Yoshida M, et al. Demonstration of spinal cord and nerve root abnormalities by diffusion neurography. J Comput Assist Tomogr. 2008;32:286–290. doi: 10.1097/RCT.0b013e31814625e3. http://dx.doi.org/10.1097/RCT.0b013e31814625e3. [DOI] [PubMed] [Google Scholar]
- 9.Yoshikawa T, Kawamitsu H, Mitchell DG, et al. ADC measurement of abdominal organs and lesions using parallel imaging technique. AJR Am J Roentgenol. 2006;187:1522–1530. doi: 10.2214/AJR.05.0778. http://dx.doi.org/10.2214/AJR.05.0778. [DOI] [PubMed] [Google Scholar]
- 10.Lauenstein TC, Semelka RC. Emerging techniques: whole-body screening and staging with MRI. J Magn Reson Imaging. 2006;24:489–498. doi: 10.1002/jmri.20666. http://dx.doi.org/10.1002/jmri.20666. [DOI] [PubMed] [Google Scholar]
- 11.Türkbey B, Aras Ö, Karabulut N, et al. Diffusion-weighted MRI for detecting and monitoring cancer: a review of current applications in body imaging. Diagn Interv Radiol. 2012;18:46–59. doi: 10.4261/1305-3825.DIR.4708-11.2. http://dx.doi.org/10.3174/ajnr.A2297. [DOI] [PubMed] [Google Scholar]
- 12.Taouli B, Koh DM. Diffusion-weighted MR imaging of the liver. Radiology. 2010;254:47–66. doi: 10.1148/radiol.09090021. http://dx.doi.org/10.1148/radiol.09090021. [DOI] [PubMed] [Google Scholar]
- 13.Guo Y, Cai YQ, Cai ZL, et al. Differentiation of clinically benign and malignant breast lesions using diffusion-weighted imaging. J Magn Reson Imaging. 2002;16:172–178. doi: 10.1002/jmri.10140. http://dx.doi.org/10.1002/jmri.10140. [DOI] [PubMed] [Google Scholar]
- 14.Oner AY, Celik H, Oktar SO, et al. Single breath-hold diffusion-weighted MRI of the liver with parallel imaging: initial experience. Clin Radiol. 2006;61:959–965. doi: 10.1016/j.crad.2006.06.014. http://dx.doi.org/10.1016/j.crad.2006.06.014. [DOI] [PubMed] [Google Scholar]
- 15.Parikh T1, Drew SJ, Lee VS, et al. Focal liver lesion detection and characterization with diffusion-weighted MR imaging: comparison with standard breath-hold T2-weighted imaging. Radiology. 2008;246:812–822. doi: 10.1148/radiol.2463070432. http://dx.doi.org/10.1148/radiol.2463070432. [DOI] [PubMed] [Google Scholar]
- 16.Koh DM, Collins DJ. Diffusion-weighted MRI in the body: applications and challenges in oncology. AJR Am J Roentgenol. 2007;188:1622–1635. doi: 10.2214/AJR.06.1403. http://dx.doi.org/10.2214/AJR.06.1403. [DOI] [PubMed] [Google Scholar]
- 17.Gourtsoyianni S, Papanikolaou N, Yarmenitis S, et al. Respiratory gated diffusion-weighted imaging of the liver: value of apparent diffusion coefficient measurements in the differentiation between most commonly encountered benign and malignant focal liver lesions. Eur Radiol. 2008;18:486–492. doi: 10.1007/s00330-007-0798-4. http://dx.doi.org/10.1007/s00330-007-0798-4. [DOI] [PubMed] [Google Scholar]
- 18.Koike N, Cho A, Nasu K, et al. Role of diffusion-weighted magnetic resonance imaging in the differential diagnosis of focal hepatic lesions. World J Gastroenterol. 2009;15:5805–5812. doi: 10.3748/wjg.15.5805. http://dx.doi.org/10.3748/wjg.15.5805. [DOI] [PMC free article] [PubMed] [Google Scholar]
- 19.Wang S, Peng Y, Medved M, et al. Hybrid multidimensional T2 and diffusion-weighted MRI for prostate cancer detection. J Magn Reson Imaging. 2014;39:781–788. doi: 10.1002/jmri.24212. http://dx.doi.org/10.1002/jmri.24212. [DOI] [PMC free article] [PubMed] [Google Scholar]
- 20.Qin W, Yu CS, Zhang F, et al. Effects of echo time on diffusion quantification of brain white matter at 1.5T and 3.0T. Magn Reson Med. 2009;61:755–760. doi: 10.1002/mrm.21920. http://dx.doi.org/10.1002/mrm.21920. [DOI] [PubMed] [Google Scholar]
- 21.Celik A, Albayram S, Uysal E, et al. Accuracy of MR apparent diffusion coefficient with varying NEX and TR. Paper presented at: 2008 Annual Meeting of the Radiological Society of North America; November 29, 2008; Chicago, USA. [Google Scholar]
- 22.Ogura A, Hayakawa K, Miyati T, et al. Imaging parameter effects in apparent diffusion coefficient determination of magnetic resonance imaging. Eur J Radiol. 2011;77:185–188. doi: 10.1016/j.ejrad.2009.06.031. http://dx.doi.org/10.1016/j.ejrad.2009.06.031. [DOI] [PubMed] [Google Scholar]
- 23.Saritas EU, Lee JH, Nishimura DG. SNR dependence of optimal parameters for apparent diffusion coefficient measurements. IEEE Trans Med Imaging. 2011;30:424–437. doi: 10.1109/TMI.2010.2084583. http://dx.doi.org/10.1109/TMI.2010.2084583. [DOI] [PubMed] [Google Scholar]
- 24.Dietrich O, Raya JG, Reeder SB, et al. Measurement of signal-to-noise ratios in MR images: influence of multichannel coils, parallel imaging, and reconstruction filters. J Magn Reson Imaging. 2007;26:375–385. doi: 10.1002/jmri.20969. http://dx.doi.org/10.1002/jmri.20969. [DOI] [PubMed] [Google Scholar]
- 25.Soman S, Holdsworth SJ, Skare S, et al. Effect of number of acquisitions in diffusion tensor ımaging of the pediatric brain: optimizing scan time and diagnostic experience. J Neuroimaging. 2015;25:296–302. doi: 10.1111/jon.12093. http://dx.doi.org/10.1111/jon.12093. [DOI] [PubMed] [Google Scholar]
- 26.Engström M, Mårtensson M, Avventi E, Skare S. On the signal-to-noise ratio efficiency and slab-banding artifacts in three-dimensional multislab diffusion-weighted echo-planar imaging. Magn Reson Med. 2015;73:718–725. doi: 10.1002/mrm.25182. http://dx.doi.org/10.1002/mrm.25182. [DOI] [PubMed] [Google Scholar]
- 27.Chen NK, Guidon A, Chang HC, et al. A robust multi-shot scan strategy for high-resolution diffusion weighted MRI enabled by multiplexed sensitivity-encoding (MUSE) Neuroimage. 2013;72:41–47. doi: 10.1016/j.neuroimage.2013.01.038. http://dx.doi.org/10.1016/j.neuroimage.2013.01.03. [DOI] [PMC free article] [PubMed] [Google Scholar]
- 28.Porter DA, Heidemann RM. High resolution diffusion-weighted imaging using readout-segmented echo-planar imaging, parallel imaging and a two-dimensional navigator-based reacquisition. Magn Reson Med. 2009;62:468–475. doi: 10.1002/mrm.22024. http://dx.doi.org/10.1002/mrm.22024. [DOI] [PubMed] [Google Scholar]
- 29.Jambor I, Merisaari H, Aronen HJ, et al. Optimization of b-value distribution for biexponential diffusion-weighted MR imaging of normal prostate. J Magn Reson Imaging. 2014;39:1213–1222. doi: 10.1002/jmri.24271. http://dx.doi.org/10.1002/jmri.24271. [DOI] [PubMed] [Google Scholar]
- 30.Metens T, Miranda D, Absil J, et al. What is the optimal b value in diffusion-weighted MR imaging to depict prostate cancer at 3T? Eur Radiol. 2012;22:703–709. doi: 10.1007/s00330-011-2298-9. http://dx.doi.org/10.1007/s00330-011-2298-9. [DOI] [PubMed] [Google Scholar]
- 31.Kaya B, Koc Z. Diffusion-weighted MRI and optimal b-value for characterization of liver lesions. Acta Radiol. 2013;55:532–542. doi: 10.1177/0284185113502017. http://dx.doi.org/10.1177/0284185113502017. [DOI] [PubMed] [Google Scholar]
- 32.Stanisz GJ, Odrobina EE, Pun J, et al. T1, T2 relaxation and magnetization transfer in tissue at 3T. Magn Reson Med. 2005;54:507–512. doi: 10.1002/mrm.20605. http://dx.doi.org/10.1002/mrm.20605. [DOI] [PubMed] [Google Scholar]
- 33.Haacke EM, Brown RW, Thompson MR, Venkatesan R. Magnetic resonance ımaging: physical principles and sequence design. 1st ed. Wiley-Liss; New York: 1999. pp. 513–546. [Google Scholar]
- 34.Kıvrak AS, Paksoy Y, Erol C, et al. Comparison of apparent diffusion coefficient values among different MRI platforms: a multicenter phantom study. Diagn Interv Radiol. 2013;19:433–437. doi: 10.5152/dir.2013.13034. http://dx.doi.org/10.5152/dir.2013.13034. [DOI] [PubMed] [Google Scholar]
- 35.Sehy JV, Ackerman IJ, Neil JJ. Evidence that both fast and slow water ADC components arise from intracellular space. Magn Reson Med. 2002;48:765–770. doi: 10.1002/mrm.10301. http://dx.doi.org/10.1002/mrm.10301. [DOI] [PubMed] [Google Scholar]


