

Abstract
Abnormal metabolism is a key tumor hallmark. Proton magnetic resonance spectroscopy (1H-MRS) allows measurement of metabolite concentration that can be utilized to characterize tumor metabolic changes. 1H-MRS measurements of specific metabolites have been implemented in the clinic. This article performs a systematic review of image acquisition and interpretation of 1H-MRS for cancer evaluation, evaluates its strengths and limitations, and correlates metabolite peaks at 1H-MRS with diagnostic and prognostic parameters of cancer in different tumor types.
Magnetic resonance spectroscopy (MRS) is an imaging technique based on the detection of radiofrequency signals generated by spins of magnetic resonance active nuclei (such as 1H, 31P, 13C, and 19F) precessing in an external magnetic field (B0). In clinical practice, MRS produces spectra from the patient with an anatomical/spatial reference. MRS is mainly based on 1H, because hydrogen is one of the main elements in human body. In vivo MRS allows the analysis and quantification of metabolites present in a tissue in a noninvasive way (1). MRS is based on the fact that protons in different molecules resonate at slightly different frequencies. This feature is secondary to the differences in the local electron cloud, which may shield the nucleus from the main magnetic field. Different metabolites containing the same nucleus exhibit characteristic chemical shifts in resonance frequency. In the oncologic field, abnormal metabolites may represent emerging tumor biomarkers. MRS allows the characterization of the metabolic changes associated with cancer (2). Up to date, the main diagnostic value of 1H-MRS in tumors has been the detection of elevated levels of choline-containing compounds or total choline at 3.2 ppm, which includes contributions from choline, phosphocholine, and glycerophosphocholine. The most consistent difference between the majority of normal tissues and tumors is usually found in choline levels. As a general rule, normal tissues display low choline levels, whereas tumors show high choline levels (Fig. 1), although several exceptions must be considered in clinical practice (Fig. 2) (3). Beside this, other metabolic pathways and their metabolites can be assessed using MRS; the significance/importance of a concrete metabolite is going to depend on different features such as the clinical scenario and the organ to be studied (Table 1). Although 1H-MRS has been fundamentally applied clinically to assist in diagnosing and monitoring brain, prostate, and breast cancer (4), it has also been used to investigate other processes in the oncologic field, including other types of primary tumors and lymph node tumor involvement (2–6). This article reviews the image acquisition and interpretation of 1H-MRS for cancer evaluation, evaluates its strengths and limitations, and correlates metabolite peaks at 1H-MRS with diagnostic and prognostic parameters of cancer in different anatomic areas.
Figure 1.

A 42-year-old woman with anterior mass (invasive ductal carcinoma) and posterior focal mastopathy area in left breast. Axial 3D contrast-enhanced fat-suppressed image at 2 minutes (top row) shows an anterior mass (arrow, invasive ductal carcinoma already biopsied and classified as a BIRADS 6 lesion), and a new posterior enhancing mass (arrowhead) with spiculated margins and curve type 3 (BIRADS 5) corresponding to a focal mastopathy area. Single-voxel MRS showed positive choline peak (long white arrow) in anterior invasive ductal carcinoma (bottom left), while it was negative in the posterior focal mastopathy area.
Figure 2.

MRS as a tumor biomarker. Although, as a general rule, tumors usually show high choline levels, low-grade malignant tumors may show a negative choline resonance peak at 3.22 ppm. Sagittal 3D contrast-enhanced fat-suppressed image of a 57-year-old woman with pure mucinous carcinoma at 2 minutes (left) shows an enhancing mass with irregular contour and kinetic curve type 3 (not shown). Single-voxel spectrum (right) shows no choline resonance peak in the mass.
Table 1.
The principal metabolites studied in 1H-MRS and their biological significances
| Fingerprints | Description | ppm | Decreased | Increased | TE |
|---|---|---|---|---|---|
| NAA | A neuronal marker of density and viability An axonal marker |
2.02 | Decreased in absence of neurons and axons in most tumors or white matter disease such as multiple sclerosis | Canavan’s leukodystrophy | Short/long |
| Choline | A metabolic marker of cell density and membrane integrity | 3.22 | It is increased due to cell proliferation and breakdown of cell membranes Higher choline levels are shown in higher grade tumors compared with lower grade tumors |
Short/long | |
| Creatine | A marker of energy metabolism | 3.02 | Decreased phosphocreatine is an inconstant finding in tumors | Short/long | |
| Lactate | Under normal circumstances, lactate is present only in minimum amounts in the brain and is not resolved using the normal spectroscopic techniques Glycolysis |
Doublet (twin peak) at 1.33 ppm | Increased lactate is the effect of the high rate of glycolysis It accumulates in cystic or necrotic areas Variable projection of the peak at different TEs |
Short/long Using intermediate TEs (135/144 ms), the doublet peak is inverted below the baseline Using very short or very long TE (30 or 288 ms), the doublet peak projects above the baseline |
|
| Myoinositol | Most important osmolyte Glial marker: located exclusively in astrocytes |
3.56 | It is a marker for low-grade gliomas; it is only seen at short acquisition times | Short | |
| Glutamine and glutamate | Glutamate is an excitatory neurotransmitter | 2.05–2.5 Complex peak |
Glutamate is viewed as an important neurotoxin when its concentration exceeds that needed for neurotransmission It is also a participant in the redox cycle |
Short | |
| Lipids | May indicate tumor necrosis or voxel contamination by diploic space fat, scalp, and subcutaneous tissue | 0.9 and 1.3 ppm usually large broad peaks | Tumor necrosis | Short Membrane lipids have very short relaxation times and are not usually visualized on intermediate or long TE |
ppm, parts per million; TE, echo time; NAA, N-acetylaspartate.
Spectroscopic imaging: technical requisites
Technically, MRS acquisition is basically very similar to that of magnetic resonance imaging (MRI). However, an optimized preacquisition preparation, adequate spectral acquisition techniques, and advanced methods of analysis are needed for obtaining a clinically useful spectrum with an optimal signal-to-noise ratio (SNR) that allows the separation of the most significant metabolites. Different technical questions need to be considered for generating adequate MRS data.
Preacquisition preparation
MRS preparation demands that the magnetic field (B0) is made as homogeneous as possible. This process is named shimming (7–10). Different circumstances, including motion artifacts and large air-tissue interfaces, lead to magnetic susceptibility artifacts. Therefore, thorax and abdomen are locations difficult to exam by MRS. Another important part of MRS exams is the suppression of water and fat signals. The water and fat signals are much stronger than the metabolite signals that we are interested in. This feature creates problems with the dynamic range of the magnetic resonance receiver systems, which distorts the baseline of the spectrum, making the other metabolite peaks invisible. Initially, saturation bands must be placed closely around the volume/organ of interest in order to suppress the strong water and fat signals from the surrounding tissue. Frequency selective radiofrequency pulses saturate the water signal (90° pulses or chemical shift selective—CHESS—pulses). On the other hand, lipid signal suppression can be obtained in several ways. Long echo time (TE) sequences attenuate lipid signals. In addition, regions that produce large lipid signals or have unacceptable field homogeneity can be presaturated. Finally, the use of lipid nulling sequences (such as short tau inversion recovery—STIR) can be considered. However, it must be also considered that frequency selective fat saturation pulses may interfere with the observation of metabolite peaks such as lactate or alanine.
Acquisition parameters
The most adequate MRS technique must be chosen depending on what metabolites and which organ are going to be studied. MRS signal is inherently low and consequently imaging requires many averages and extremely limited field of view. SNR and chemical shift separation of metabolite peaks increase approximately linearly with the increase of the magnetic field. However, considering the relatively weak magnetic fields used in clinical practice, a limited chemical shift dispersion and J-coupling can cause spectral overlap and complicate the separation of metabolites (7–10). Two main sequences are used in clinical practice for MRS acquisition: PRESS (point-resolved spectroscopy) and STEAM (stimulated echo acquisition mode). The PRESS sequence can be used in either single voxel spectroscopy (SVS) (where a single region is evaluated) or multi-voxel spectroscopy (MVS) (simultaneous spectrum acquisitions in multiple regions). PRESS sequence is most commonly used in clinical practice because it presents a better SNR and less sensitivity to motion. STEAM is used only in SVS, since it results in better water suppression and shorter TE than PRESS (10). It must be considered that the observed metabolite peaks change depending on TE. Some metabolites like glutamine-glutamate (Glx), and myoinositol have a short relaxation time and as a result they are not visible on a long TE sequence. A short TE acquisition is considered when TE is <40 ms; while a long echo time is considered when TE is >135–288 ms. Some authors also consider including the description of intermediate TE for 135 ms. TE selection may be a key point when planning a spectroscopic exam. For example, if lactate evaluation is required, long TE should be considered because lactate is detected with less lipid contamination at long TE. Moreover, TE changes metabolite presentation in spectrum. Lactate should be inverted at TE 140 ms and in phase at TE 280 ms. MVS is generally obtained with long TE due to the difficulties of quantifying overlapping multiplet resonances at short TE. In SVS, the selection of the volume of interest (VOI) is performed by combining three orthogonal slice-selective excitations. The approach of volume preselection eliminates spurious signals (7–10). SVS is also faster than MVS and can be acquired using both long and short TEs. Finally, an adequate shimming and better water suppression have been shown to be more feasible with this approach. For its part, MVS is useful for the depiction of tumor heterogeneity and its margins. A variety of synonymous terms for MVS have been used in the literature and by scanner vendors, including MRS imaging, chemical shift imaging, and spectroscopic imaging. However, MVS shows some important limitations. It is time consuming and limited in achieving good shimming due to the large volume of tissue examined. Besides, spatial localization is generally not as precise as in SVS, a circumstance that increases partial volume artifacts from adjacent tissues/structures.
Preprocessing of MRS
Preprocessing of MRS signal and data evaluation are the final steps required for the clinical use of MRS. MRS data become useful in practice when a postprocessing protocol decodes these signals, which can be transformed in a list of spectral components from which metabolite relative concentrations can be determined (Fig. 3). Therefore, acquired MRS signals require a preprocessing protocol for improving the quantitation of metabolites (10). Preprocessing protocols can be divided into two main classes depending on whether it is performed in the time domain or in the frequency domain. The traditional way to determine the different resonances present in this complex signal (free induction decay—FID) is by means of a mathematical procedure known as Fourier transform, which converts the FID into a frequency domain function (the spectrum) (8, 9). Although a detailed discussion is out of the scope of this manuscript, processing of 1H-MRS data based on the Fourier transform comprises several fundamental operations (7–12). First, zero filling of the FID is used to increase resolution by inserting additional data points of zero amplitude. Second, a window function is applied to either increase resolution or to improve SNR. When it is used to remove truncation artifacts, this operation is known as apodization. Third, phase correction is applied in order to have all the resonances of the spectrum in the same phase (i.e., all peaks are pointing upwards). Finally, other typically applied processing operations are baseline correction (spectra are distorted secondary to the presence of intense residual water and/or lipid peaks), eddy current, and field inhomogeneity corrections, and postacquisition removal of water.
Figure 3 a, b.

Analysis of the MRS data. Schematic representation of MRS data generation and processing (a) and change in the spectrum shape (b) when different values of exponential or Gaussian functions are used in single-voxel MRS of a brain exam. Magnetic resonance spectra usually comprise more than a single frequency (a, top-left). What we actually observe in a magnetic resonance free induction decay (FID) (bottom-left) is their sum, which results in a complex signal that cannot be analyzed in a simple way. The traditional way to determine the different resonances present in this complex signal is by means of a mathematical procedure known as Fourier transform. In addition, acquired MRS signals require a preprocessing process to minimize error in the quantitation of metabolites (e.g., eddy current compensation, zero filling). Finally, the result of this processing should be a series of metabolite peaks (right) characterized by their principal descriptors: frequency (chemical shift) and amplitude. Change in the spectrum shape when different values of exponential or Gaussian functions are used (b). Manipulating the same FID with different window functions (b) (e.g., exponential/Gaussian) will help to increase the resolution, but at the cost of worsening the SNR or introducing artifacts in the spectrum.
MRS data evaluation
The obtained spectrum represents specific metabolites appearing in certain frequencies due to their specific chemical shifts. The resonance spectrum identifies metabolites by locating their peaks. Several peaks can characterize the same compound (i.e., doublet or triplet). Graphic representation of acquired data includes these metabolite peaks (represented on the horizontal axis of the graph) expressed as parts per million (ppm) and their relative signal amplitude in the vertical axis. The area or integral under each peak represents the relative concentration of the detected metabolite (7–12). Magnetic resonance spectra are evaluated in clinical practice in three ways: qualitative evaluation, semiquantitative evaluation, and absolute quantification. Qualitative evaluation is performed by observing absence, presence, or change of a specific metabolite. Semiquantitative evaluation is performed by the calculation of amplitude or integral of the metabolite peaks. When using frequency domain methods, the area under the peaks of interest can be obtained using either the traditional running integral or by deconvolution (Fig. 3b). Metabolite ratios, which are much more reproducible, are commonly used for evaluation (e.g., in prostate, choline+creatine/citrate ratio correlates significantly with the probability of malignancy) (Fig. 4). Absolute quantification of the concentration of a metabolite can be obtained using a reference standard for calibration.
Figure 4.

Multiparametric imaging in prostate cancer imaging. A 65-year-old man with rising PSA values and two previous negative biopsies. T2-weighted and apparent diffusion coefficient (ADC) parametric map (top row) and MR spectrum and dynamic contrast-enhanced (DCE) time-signal curve (bottom row) show an anterior prostate mass (arrow). T2 image shows an infiltrating mass with extension into the anterior capsule. The mass presents a reduced ADC value (mean ADC=0.666×10⁻³ mm2/s). On multiple-voxel MRS, choline is significantly elevated compared to citrate and DCE demonstrates a type 2 curve. All these findings suggest a high probability of malignancy. Biopsy confirmed a Gleason 8 prostate cancer.
Clinical value of MRS in oncology
Although MRS was initially developed for the assessment of brain tumors, metabolic information obtained by MRS can be helpful in diagnosis and monitoring of different tumors. Actually, this is an established imaging technique in brain, prostate, and breast cancers (1–4). MRS interpretation is mainly based on checking the elevation of certain metabolites (such as choline) or the absence or decrease of normal metabolites (e.g., N-acetylaspartate—NAA—in the brain). A multiparametric imaging assessment of tumors, which may include MRS, represents an attractive approach for mapping the heterogeneity of tumor phenotype. This complex evaluation supposes an important challenge in order to integrate the great volume of information that imaging can offer. Apart from these tumors, there is a growing use of MRS in the evaluation of different tumor types, but its value depends on the clinical scenario (e.g., organ, tumor type).
Brain tumors
Diagnosis of intracranial masses based on imaging findings alone is a challenge for imaging. 1H-MRS offers additional information related to tumor proliferation and metabolism or neuronal damage. In the oncologic field, there are several well-established indications for 1H-MRS in the brain such as identifying types and grades of central nervous system neoplasms (13), differentiation between tumors from other lesions, establishment of prognosis, treatment planning with delineation of tumor invasion and definition of the target volume for radiation therapy, monitoring of tumor response, and detection of relapsing tumor (Fig. 5) (2–4, 14, 15). There is a wide list of metabolites that may be useful in the MRS evaluation of brain tumors, including NAA, choline, lipids, creatine, lactate, alanine, myoinositol, and Glx. Nearly all brain tumors have decreased NAA peaks. This critical finding is generally associated to increased levels of choline. NAA decreasing is secondary to the loss of normal neuronal tissue. However, one must proceed with caution when attempting to use the NAA level to define the spatial extent of the tumor or to distinguish tumor from other neurologic abnormalities, because NAA is reduced in other neuropathologic entities like multiple sclerosis and Alzheimer disease (15, 16). The increased choline peak in brain tumors indicates an elevated rate of membrane turnover. Elevated choline along with decreased NAA is a diagnostic feature of brain tumors. The choline/NAA ratio increases as the grade increases. In addition, a peak of lipids associated with necrosis or hypoxia is found in high-grade tumors. Although an increased choline peak has been found to correlate well with cellular density, cell proliferation indices (such as Ki-67), and the degree of tumor infiltration (14, 15), this is not a specific marker for neoplastic lesions of the central nervous system. Spectra from active plaques in multiple sclerosis show an elevated choline/creatine ratio and normal or reduced NAA/creatine ratio. Chronic multiple sclerosis plaques in white matter show a reduced NAA/creatine ratio and, sometimes, an elevated choline/creatine ratio, but the ratio is not as high as in tumors. The creatine peak may vary with the tumor type and the grade of glioma. It is thought that the observed decrease in the creatine peak is related to an increased metabolic rate of the tumor, but the specific biochemical mechanisms leading to these changes are not well understood (15). There is often a mild increase of creatine signals in low-grade astrocytomas, followed by progressive depletion with increasing anaplasia. In gliomatosis cerebri, creatine peak may be also elevated. On the contrary, creatine is virtually absent in lymphomas and metastases and low in meningiomas and oligodendrogliomas. Lipids are also important metabolites. The presence of lipid peaks at 1.3 and 0.9 ppm is a usual finding of glioblastoma, metastases, lymphoma, and abscesses. The biological basis of the increased lipids is presumed to be secondary to necrosis and membrane breakdown. Recent studies have shown that the lipid resonance observed in MRS may be produced during changes in cellular proliferation that occur prior to the onset of necrosis or products of apoptotic processes (17). On the other hand, large amounts of lipids can also be found in areas treated with radiotherapy (18). Another important metabolite peak, lactate, is secondary to anaerobic glycolysis, tumor ischemia, or necrosis. Lactate peak is found mainly in high-grade gliomas, but recent studies evidenced that their presence is not a reliable indicator of tumor grade, as they are found in all pediatric brain tumors regardless of histologic grade (14–16, 18). Lactate may also be detected in the necrotic areas of glioblastoma and metastases. A myoinositol peak is typically present in glial tumors even in the absence of increased choline. It is generally higher in low-grade astrocytomas and gliomatosis cerebri (14–16). The rapid T2 relaxation of myoinositol requires a short TE MRS sequence for detection. Glx resonances are also most easily detected with short TE sequences, but are difficult to quantify due to the characteristic-rolling baseline of short TE spectra. Despite this difficulty, several studies have reported elevated Glx in meningiomas relative to normal brain and astrocytomas. Finally, alanine is occasionally found in the spectrum of meningiomas and abscesses. Alanine resonates at 1.47 ppm and is a J-coupled, doublet peak that is inverted at TE values between 135 and 144 ms. It may also overlap with lactate to form an apparent “triplet peak”. As shown, the combination of changes in different metabolites is useful in the differential diagnosis of brain lesions (Table 2). However, lesion variability, heterogeneity, and overlap between different tumor types can make characterization difficult. Other important oncologic features can be evaluated using MRS imaging. Survival time appears to be negatively associated in patients with glioma grade IV containing large areas of abnormal metabolism (high lactate and lipid levels) (19). Besides, tumors are commonly quite heterogeneous. The use of magnetic resonance perfusion imaging may help to localize the best area for spectral evaluation (20). This feature may be useful in order to use MRS imaging for selecting representative areas of the tumor for biopsy. In this setting, low-grade areas of a glioma are generally characterized by relatively high NAA/choline ratios; while high-grade areas are usually marked by lactate and lipid peaks (13). Ideally, regions of high metabolic activity should be sampled. Finally, elevation of choline has been recognized as an important surrogate marker of tumor progression and response to therapy (14, 15). 1H-MRS has also been applied to differentiate radiation-induced tissue injury from relapsing tumor. Increased choline signal is suggestive of tumor recurrence (21).
Figure 5.

Multiparametric MRI of therapy response evaluation. Grade III glioma of the left frontal lobe. Rows: serial images obtained before and after administration of bevacizumab plus temozolamide including postcontrast T1-weighted and T2-weighted images and single-voxel 1H-MRS spectra. Reduced enhancement and decreased tumor size is seen after treatment. However, an increased choline/N-acetylaspartate (NAA) ratio suggests no tumor response. These apparent contradictory findings may be secondary to the restoration of the blood-brain barrier as a result of antiangiogenic therapy. This feature explains a lower enhancement on T1-weighted contrast-enhanced image following therapy and a reduction in edema, which may be responsible for the changes in T2 image. Although these imaging findings may suggest tumor response, MRS findings do not support it, reinforcing the role of a multiparametric evaluation of the tumor phenotype.
Table 2.
Main metabolites used in brain MRS
| Tumor | Metabolites |
|---|---|
| Astrocytoma | Elevated choline, reduced creatine, and significantly reduced NAA Elevated choline/creatine ratio in the peritumoral region may suggest high-grade glioma rather than a solitary metastasis Low-grade glioma typically produces myoinositol |
| Metastasis | Similar features to astrocytomas. High lactate and lipids |
| Glioblastoma multiforme | Same spectral pattern as metastasis. High lipid peak at 1.3 ppm |
| Meningioma | Low creatine and myoinositol, increased choline, and low levels of lipids at 1.3 ppm There is a characteristic presence of alanine |
| Radiation necrosis | Low choline and NAA In some cases produces a peak at 2.4 ppm Choline/creatine and/or choline/NAA ratios are significantly higher in recurrent tumor (or predominantly tumor) than in radiation injury |
NAA, N-acetylaspartate; ppm, parts per million.
Breast cancer
Breast MRI shows high sensitivity but limited specificity for cancer detection. Several studies have reported the role of total choline as a marker of breast cancer (Fig. 1) (22–27). Adding 1H-MRS to breast MRI may improve the specificity of breast cancer detection from 70% up to 92% (23–25). Dynamic contrast-enhanced acquisition may help identify enhancing areas in the tumor (usually associated to an increased metabolism) suitable for spectroscopic examination (26). However, several technical constraints must be considered in breast MRS. In lesions less than 2 cm in diameter, MRS may show a reduced SNR of choline resonance. Although any value of TE can be used in breast 1H-MRS, the scientific published literature recommends the use of long TEs (>135 ms). Despite these challenges, several studies have demonstrated that MRS may differentiate benign and malignant lesions in the breast (22–28). Lesions with detectable choline peaks are suspicious for malignancy, with sensitivity and specificity rates reported as 83% and 85%, respectively (29). Choline quantification in a lesion is considered positive when the peak of total choline at 3.2 ppm is two-times above the baseline (30). Another potential use of in vivo spectroscopy is to monitor tumor response to chemotherapy with a diminution of total choline detected in responder breast cancers to neoadjuvant chemotherapy. However, there is still no consensus on the role of MRS for assessing the tumor response (31).
Prostate cancer
MRS may be used for detection, localization, staging, tumor aggressiveness evaluation, and tumor response assessment of prostate cancer (32–42); however, its value in some of these indications has been subject to discussion (39, 41, 43). The use of endorectal coil in prostate MRI may be particularly valuable for inherently lower SNR sequences, such as MRS (39). The use of a higher magnetic field strength (3.0 T) along with endorectal coil results in higher SNR and improved spectral resolution. Main peaks observed in MRS spectra of the prostate are citrate, creatine, and choline compounds. However, different anatomic zones of the healthy prostate show different amplitudes for these metabolites as well as different (choline+creatine)/citrate integral ratios (33). Citrate is produced in the epithelial cells as an intermediate product in the Krebs cycle. It accumulates in the luminal space of the prostate. The lower citrate peak in prostate cancer is secondary to altered metabolism and reduction of luminal space. Apart from its diagnostic value, MRS offers possibilities for a noninvasive assessment of prostate cancer aggressiveness in vivo. Compared with normal peripheral or benign prostate hyperplasia (BPH) tissues, citrate signals are reduced and those of choline compounds are often increased in prostate cancer (Fig. 4). Combinations of different metabolite ratios have been evaluated for detecting aggressive tumors (32, 34, 35). The maximum choline+creatine/citrate ratio and the maximum choline/creatine ratio correlated significantly with aggressiveness. However, owing to the presence of BPH, cancer in central gland is more difficult to discern (36). A commonly used system for the evaluation of MRS in prostate was developed by Jung et al. (37), which reported a standardized scoring system for the evaluation of the spectral data of the peripheral and central gland zones. This scoring system uses a visual classification system and a threshold metabolite approach corresponding to the (choline+creatine)/citrate integral ratio. The accuracy of the scoring system improved when at least three adjacent voxels showed abnormal findings (metabolite peaks are greater than five times the standard deviation of noise level). This classification showed good accuracy in differentiating benign from malignant lesions and excellent interobserver agreement. A multiparametric imaging assessment of prostate lesions based on the Prostate Imaging-Reporting and Data System (PI-RADS) also included a classification of MRS findings for lesion evaluation (Fig. 4) (38). However, it must be remarked that the new version of this scoring system (PI-RADS v2) does not include the use of MRS, perhaps due to its technical complexity (39). MRS may also be useful in image-guided focal therapy (40) and to evaluate prostate cancer response to different therapies (41). In case of androgen deprivation therapy, metabolic evaluation might be challenged. The secondary glandular atrophy causes a reduction of citrate peaks in both tumor and in normal glandular areas and only a slow reduction of choline and creatine peaks in tumor. On the other hand, persistent elevation of choline levels can also indicate ongoing active disease in the prostate gland. Finally, in the evaluation of prostate MRS findings, sources of false positive/negative findings must be considered. False positive may be secondary to areas/lesions that show either reduced citrate levels (i.e., the anterior fibromuscular stroma or stromal BPH nodules) or elevated choline levels, such as in the vicinity of seminal vesicles or in the periurethral zone (due to elevated levels of glycerophosphocholine in the seminal fluid) or in areas of prostatitis. On the other hand, false negative findings can occur with small or infiltrating lesions.
Head and neck cancer
Main clinical applications of MRS in the head and neck area include characterization of the head and neck masses, prediction of treatment response to therapy, and monitoring patients with head and neck cancer undergoing therapy (44). In this setting, previous articles evidenced higher choline/creatine ratios in squamous cell carcinoma compared with normal tissues (i.e., muscle). On its part, lymphomas showed higher ratios than that of the carcinomas, which was attributed to high cell density of the lymphomas (44, 45). Concerning tumor response evaluation, King et al. (46) reported that the presence of a choline peak in a post-treatment mass might be a marker of residual cancer. Future applications may include characterization of the lymph nodes. The metastatic lymph nodes showed a significantly higher choline/creatine ratio compared with benign lymphoid hyperplasia (5).
Hepatobiliary system
There is limited use of MRS in the hepatobiliary system (Table 3). Main limitation of MRS in the hepatobiliary system and gastrointestinal tract is motion. The MRS acquisition and processing protocol can be improved by introducing a control of respiratory motion using breath-hold acquisitions and an abdominal compression belt. Pre- and postprocessing including automatic phase and frequency correction may remove potential distortions introduced mainly by motion. To our knowledge, up to date there is no added value in using MRS in these fields. Application of 1H-MRS studies in the liver aim to characterize the hepatic mass or monitor hepatocellular carcinoma (HCC) treated with chemoembolization. In this setting using a short TE, various groups found that malignant liver tumors present higher levels of choline compared with uninvolved liver or benign tumors (47–49) (Fig. 6). Kuo et al. (47) reported significant decrease of the total choline in the HCC after transcatheter arterial chemoembolization, while lipid and water signals were increased. On the contrary, Fischbach et al. (50) did not observe any significant difference between malignant liver tumors and normal liver parenchyma for the total choline. Due to these divergences, recent studies evaluated the possibility of quantification of choline in the liver. Xu et al. (51) concluded that lipids could mask the resonance signal of choline. However, the ability to reliably distinguish benign and malignant tumors from normal liver parenchyma has yet to be established.
Table 3.
Published literature about hepatobiliary tumors
| Organ | Technical parameter | Purpose | Choline | Lipids | Unsaturated fatty acids | |
|---|---|---|---|---|---|---|
| Xu et al. (51) | Liver | 3.0 T PRESS TE: 30 |
To investigate the normal hepatic MRS findings of choline/lipids | Lipid accumulation can result from the increased fat in the body depending on age and BMI Lipids can mask the resonance signal of choline |
||
| Fishbach et al. (50) | Liver | 3.0 T PRESS TE: 35 VOI: 2×2×2 cm |
To differentiate liver parenchyma from neoplastic lesions using localized MRS | No significant differences were observed between the contents of choline in malignant liver tumors and normal liver parenchyma | ||
| Li et al. (48) | Liver | 3.0 T | The quantification of choline containing compounds in hepatic tumors | The choline concentrations in HCCs are substantially higher than those obtained from healthy volunteers | ||
| Kuo et al. (47) | Liver | 3.0 T PRESS TE: 30 ms VOI: 3×2×2 cm |
The value of in vivo MRS in the assessment of large focal hepatic lesion | Malignant tumors have elevated total choline resonances compared with uninvolved liver or benign tumors | ||
| Yao et al. (54) | Pancreas | 3.0 T Respiration-triggered No supressed water |
To identify metabolic features of pancreatic carcinoma | Choline/unsuppressed water ratio in normal pancreas was statistically greater than that in pancreatic cancer | 1.3 Fatty acids/lipids ratio in normal pancreas was statistically lower than that in pancreatic cancer (P = 0.006) |
Pancreatic carcinoma has a higher fatty acids/lipids ratio |
| Su et al. (52) | Pancreas | 3.0 T Compare breath-holding and free-breathing |
To characterize normal pancreas metabolism | |||
| Ma et al. (53) | Pancreas | No supressed water | To analyze the metabolic features and distribution of normal pancreas and pancreatic adenocarcinoma | Lipids may potentially be sensitive biomarkers for pancreatic cancer |
PRESS, point-resolved spectroscopy; TE, echo time; MRS, magnetic resonance spectroscopy; BMI, body mass index; VOI, volume of interest; HCC, hepatocellular carcinoma.
Figure 6.
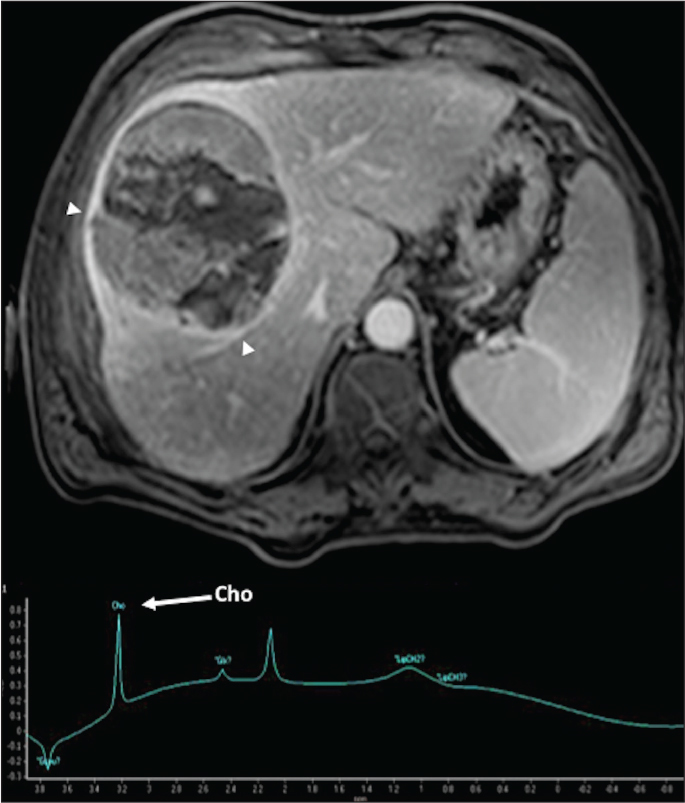
A 68-year-old man with hepatocellular carcinoma. Axial contrast-enhanced T1-weighted gradient-echo image in the delayed phase demonstrates a big encapsulated mass (arrows). Single-voxel MR spectrum depicts a choline peak within this mass.
In the pancreas, the main challenge for the radiologist is diagnosing pancreatic cancer. Unfortunately, choline, a classic marker of cancer, is also present in normal parenchyma (52). Several authors indicate lipids as potential markers of pancreatic cancer (53, 54).
Gastrointestinal tumors
A few studies evaluated the value of 1H-MRS in gastrointestinal tumors. Kim et al. (55) proposed using 1H-MRS to diagnose rectal cancer and monitor treatment response after chemoradiotherapy. They found that after treatment, choline peak disappeared, resulting in only the lipid peak at 1.3 ppm in 97% of patients (Fig. 7). Previously, Dzik-Jurazs et al. (56) had detected the same metabolites (choline and lipids) in rectal cancers. Mun et al. (57) used 1H-MRS to determine the characteristics of gastric cancers and found that cancer lesions showed increased choline peaks, decreased lipid levels, and significant lactate doublet peaks in short TE compared with noncancerous gastric tissue.
Figure 7.

A 74-year-old man with an advanced rectosigmoid malignant tumor. Axial T2-weighted image, constant transfer (Ktrans) parametric map, and time-signal intensity curve (top row) and ADC color-scaled parametric map and single-voxel MR spectrum (bottom row) demonstrate a bulky rectosigmoid tumor (arrows) with areas of increased Ktrans, a type 2 curve (arrowhead), and low ADC values. MRS evidences a lipid peak in the tumor.
Genitourinary tumors (excluding prostate)
There is limited experience with the use of MRS in the evaluation of female pelvic lesions due to the wide range of pathological types of neoplasms with different behaviors (Table 4). In general, there was no statistically significant difference between choline levels in various types of gynecologic tumors or between benign and malignant lesions (Fig. 8) (58). However, there are some contradictory data. In studies regarding the uterine tumors, Okada et al. (59) and Celik et al. (60) found that choline was present in benign and malignant lesions, while Takeuchi et al. (61) reported that malignant lesions have higher levels of choline, and a cutoff of 7 mmol might distinguish between them with 83% sensitivity and 93% specificity. Lipid peaks also showed promising results for distinguishing uterine sarcomas from benign leiomyomas (62). In the case of tumors of the cervix, unfortunately choline is present in normal and tumor tissue without any detectable differences between them (58, 63–67). Concerning ovarian tumors, different authors found higher levels of choline in malignant lesions, in tumors as well as metastatic lesions (68). Stanwell et al. (69) determined that the choline/creatine ratio could distinguish between benign and malignant ovary lesions, thus a choline/creatine integral ratio >3 indicated a malignant tumor, whereas a choline/creatine integral ratio less than 1.5 indicated a benign nature. Takeuchi el al. (70) studied the significance of lipid peak in patients with solid gynecologic tumors with areas of low signal intensity on T2-weighted images. They demonstrated that the presence of high lipid peak might distinguish thecomas/fibrothecomas from other ovarian fibrotic neoplastic lesions. Okada et al. (59) investigated the metabolic profile of various gynecologic tumors. They found high levels of choline in the solid part on ovarian tumors, elevated lipid peaks in dermoid cyst and high levels of lactate in the cystadenocarcinomas.
Table 4.
Published literature about genitourinary tumors (except prostate)
| Organ | Technical parameter | Purpose | Choline | Lipids | Lactate | Specificity | Sensitivity | |
|---|---|---|---|---|---|---|---|---|
| Takeuchi et al. (62) | Uterus | 3.0 T Single 144 Voxel 8 mL |
The clinical significance of the lipid peak in distinguishing uterine sarcomas from benign leiomyomas | High lipid peak is suggestive of uterine sarcomas Lipid peak is observed in both viable and necrotic areas in sarcomas |
94% | 100% | ||
| Takeuchi et al. (61) | Uterus | 3.0 T Single 144 Voxel 8 mL |
Distinguishing malignant from benign lesions | Malignant (9.21±2.21 mM) Benign (4.59±2.22 mM) |
Cutoff: 7 mM 83% |
Cutoff: 7 mM 93% |
||
| Okada et al. (59) | Uterus | 1.5 T Single 135 Voxel 8–27 mL |
Evaluation of female intrapelvic tumors by clinical proton MRS | Peak in solid tumors in benign and malignant tumors | High peak in dermoid cyst | Present in anaerobic glycolysis | ||
| Celik et al. (60) | Uterus | 1.5 T Single 136 Voxel 1–8 mL |
Clinical utility in endometrial lesions | Endometrial carcinoma Endometrial hyperplasia |
Endometrial carcinoma | Proliferative endometrium Secretory endometrium |
||
| Payne et al. (63) | Cervix | 1.5 T Single 135 Voxel 25×18× 15 mm |
To establish differences between cervical tumors and total choline | Present in normal and tumoral tissue No difference between any tumoral types |
||||
| Mahon et al. (64) | Cervix | 1.5 T Single 135 3.4 mL |
To compare in vivo 1H-MRS spectra of preinvasive and invasive cervical lesions with ex vivo MAS spectra of intact biopsy | In vivo studies detected choline in normal, cervical intraepithelial neoplasia, and cancer patients with no significant differences in levels | The measured lipid levels were more than double in malignant cervical tissue compared with benign cervical tissue | |||
| Booth et al. (58) | Cervix | 3.0 T Single 72 Voxel 5.3–81.3 mm3 |
To characterize the spectra of a variety of benign and malignant gynecologic lesions | No statistically significant difference between choline levels in various lesion types (P = 0.735) or between benign and malignant disease | ||||
| Lee et al. (65) | Cervix | 1.5 T Endovaginal surface coil Single 135 Voxel 1–3 mL |
To diagnose cervical carcinoma and categorize the spectrum according to histologic type | Present in adenocarcinoma and squamous cell carcinoma | Peak at 1.3 ppm is present in squamous cell carcinoma Peak at 2 ppm (tryglicerides) is present in all adenocarcinomas |
|||
| Takeuchi et al. (70) | Adnexa | 3.0 T Single 144 TE 2×2×2 cm (8 mL) |
To retrospectively evaluate the significance of lipid peak in in vivo MRS for the diagnosis of ovarian thecomas/fibrothecomas | High lipid peak in thecomas/fibrothecomas with 100% sensitivity, 92% specificity, 88% PPV, and 100% NPV | 92% | 100% | ||
| McLean et al. (68) | Adnexa | 3.0 T Single 144 |
To characterize primary and metastatic ovarian cancer by 1H-MRS in vivo | Choline was detected in 10/12 primary tumors and 5/11 metastatic lesions | ||||
| Stanwell et al. (69) | Adnexa | 3.0 T Single voxel/135 |
To provide potentially diagnostic biochemical information that may aid in the characterization of ovarian neoplasms detected during clinical MRI | Choline/creatine integral ratio >3 was found to indicate malignancy Choline/creatine integral ratio <1.5 in benign masses |
||||
| Okada et al. (59) | Adnexa | 1.5 T/Single 135/Voxel 8–27 mL | Evaluation of female intrapelvic tumors by clinical proton MRS | The choline peak was detected in the solid part on ovary tumors | High peak in dermoid cyst | High lactate signals were detected in cystadenocarcinoma but not in cystadenoma | ||
| Firat el al. (72) | Testicle | Univoxel PRESS TE 31 ms TE 136 ms 10×10×10 or 15×15×15 mm3 |
To determine the pre- and postpubertal 1H MRS characteristics of the normal testis | Choline/lipids ratio was higher in the postpubertal period Increase choline represents the presence of spermatogenesis |
Choline/lipids ratio was higher in the postpubertal period The decrease in the lipid peak may represent the effect of testosterone on testicular tissue or may be due to histochemical changes initiated by puberty |
|||
| Aaranson et al. (73) | Testicle | 1H high-resolution MAS spectroscopy | To identify metabolic signatures associated with various histological states of spermatogenesis in infertile men | Choline concentrations are significantly higher in testes with spermatogenesis |
MRS, magnetic resonance spectroscopy; MAS, magic angle spinning; ppm, parts per million; TE, echo time; PPV, positive predictive value; NPV, negative predictive value; PRESS, point-resolved spectroscopy.
Figure 8.

A 47-year-old woman with a malignant tumor of the cervix. Sagittal diffusion-weighted image (b value=800) (right) demonstrates a big tumor in the uterine cervix with restricted diffusion (arrowheads). T2-weighted images in different planes (top left) show the position of the MRS voxel. Single-voxel MRS depicts the presence of a choline peak in the tumor.
The literature related to the value of 1H-MRS in the testes is rather scarce. Spermatogenesis is a complex process, in which the formation of spermatozoa constantly requires large amounts of choline for membrane synthesis (71). Firat et al. (72) revealed two significant differences between pre- and postpubertal 1H-MRS pattern: first, an increase in the choline peak after puberty due to initiation of spermatogenesis and second, a decrease of the lipid peak secondary to increased testosterone synthesis in the testicular tissue, initiated by puberty. They found statistically significant differences between choline/lipid ratios of pre- and postpubertal males. In this setting, Aaronson et al. (73) studied three histologic patterns in 27 snap-frozen testicular tissues using 1H-MRS: normal spermatogenesis, maturation arrest, and Sertoli-cell-isolated histology. They found that choline concentrations were higher in patients with normal spermatogenesis compared with those having Sertoli-cell-isolated histology. Preliminary results also reported that normal testis presents naturally high levels of choline; however, several causes of infertility (such as varicoceles or testicular tumors) decreases these levels due to a failure of spermatogenesis (Fig. 9) (74).
Figure 9 a, b.
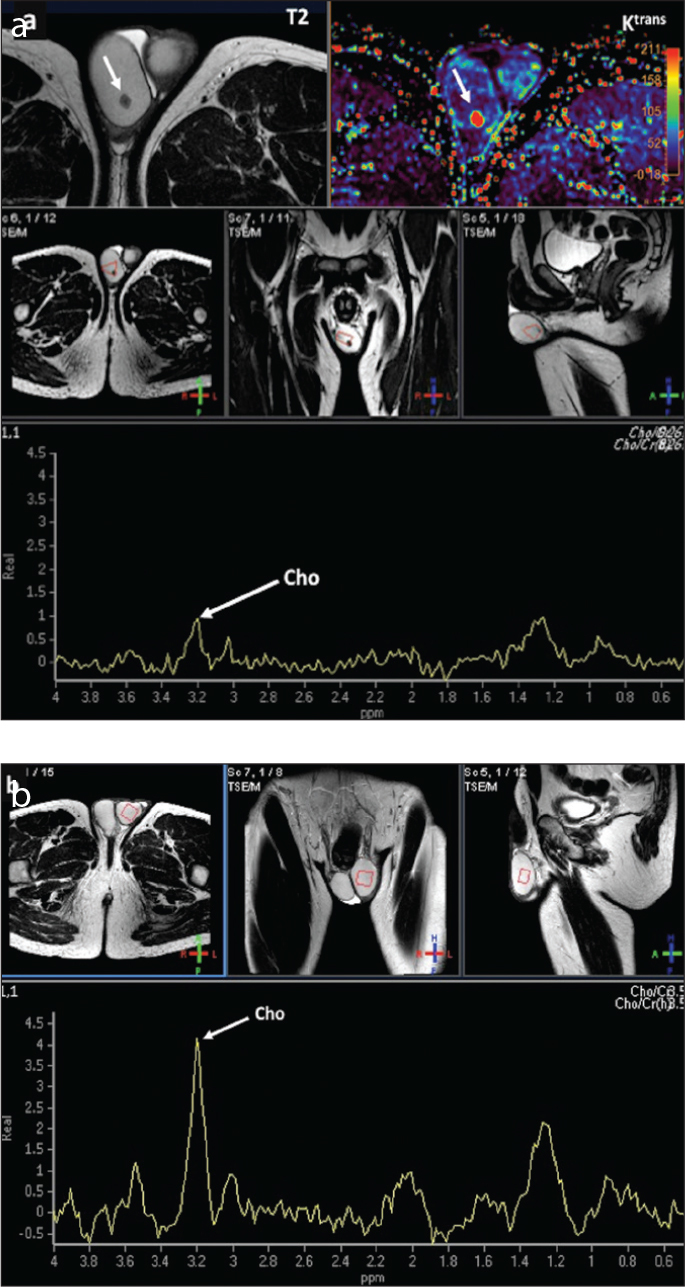
A 39-year-old man with a seminoma. Multiparametric MRI evaluations of the tumor (a) and the contralateral healthy testicle (b). Tumor evaluation (a) shows a small lesion on axial plane (white arrows) in the right testicle. T2-weighted image and constant transfer (Ktrans) parametric map (top row) demonstrate a small lesion with low signal on T2 and increased Ktrans values which correspond to a seminoma. T2-weighted images in different planes (second row) show the position of the MRS voxel. Single-voxel MRS shows a low choline peak (white arrow) in the tumor. MRS of the contralateral healthy testicle (b) in the same patient shows a higher choline peak (white arrow) in the normal parenchyma of this testicle compared with the tumor. (Note: same scale has been used for visual comparison).
Soft-tissue tumors
1H-MRS may help differentiate benign and malignant soft tissue lesions. Absence of choline peak is highly predictive of benign soft tissue lesions as shown by Russo et al. (75) using SVS and long TE. Previously, Subhawong et al. (76) revealed that a discrete choline peak had 88% sensitivity and 68% specificity in detection of malignant musculoskeletal lesions (Fig. 10). Similarly, Doganay et al. (77) reported that choline had 72.2% sensitivity and 83.3% specificity in detecting malignant bone and soft tissue tumors.
Figure 10.

A 39-year-old woman with a malignant soft tissue mass corresponding to a dermatofibrosarcoma protuberans (bottom left image – clinical picture). Coronal and axial T2-weighted images and wash-in parametric map derived from a dynamic contrast-enhanced acquisition (top right) demonstrate a well-vascularized exophytic tumor in the left groin (white arrows). Single-voxel MRS shows a choline peak (bottom right).
MRS challenges
Nowadays most clinical MRI scanners have routine sequences for 1H-MRS measurements, providing a wide range of metabolic information integrated with complementary anatomical or functional MRI sequences. However, MRS shows considerable technical complexity, is time consuming, offers lower sensitivities, and requires complex data processing (Table 5). Moreover, this technique needs radiologists’ expertise and clinicians are unfamiliar with it. Finally, in many cases, it is not clear how the inclusion of MRS imaging might affect clinical decision-making and outcomes. All these factors continue to limit the application of MRS in the clinical setting (2, 4, 9, 10).
Table 5.
Technical challenges of MRS and possible solutions
| Technical problems | Possible solutions |
|---|---|
| Low signal strength of the metabolites | Larger voxel sizes MRI instruments at a higher field strength Surface phase-array coils |
| Poor spatial resolution | Increase the signal-to-noise ratio (e.g., MRI systems with a higher field strength and surface phase-array coils) Increase acquisition time Spatial filtering in the reconstruction process |
| Long acquisition time | MRI instruments with a higher field strength Parallel imaging Surface phase-array coils Constrain the acquired matrix size Echo-planar or spiral phase-encoding techniques Spherical or elliptical k-space Weighted averaging strategies (i.e., collection of fewer averages at peripheral k-space points) |
| Motion artifacts | Motion correction techniques based on navigator signals Decrease acquisition time STEAM is more susceptible to the effects of motion than PRESS |
| Magnetic field inhomogeneity, which introduces regionally varying spectral line broadening | Avoid anatomical regions having strong magnetic field inhomogeneity (tissue-bone or tissue-air interfaces) Automated or manual shimming Single-voxel MRS |
| Artifacts related to water and lipid signals | Presaturate water and fat signals Postacquisition water removal Use intermediate-to-long echo time due to short lipid signal T2 values Baseline correction (MR spectra usually exhibit baseline distortions caused by the corruption of the first few data points in free induction decay or due to the superposition of broad lines arising from lipids or macromolecules. Water suppression also leads to baseline imperfections) |
| J-modulation of multiplet resonances (Some metabolite signals exhibit complex multiplet structures due to the effect of J-coupling) | MRI instruments with a higher field strength Improve localization performance and try to shorten the TE (The short TE stimulated echo acquisition mode or STEAM is less sensitive to J-coupling) Homodecoupled or pure-shift experiments (where the indirect scalar couplings are removed) |
| Gibbs ringing at tissue boundaries | Apply k-space filters in image reconstruction that suppress the outer regions of k-space (At the cost of reduced spatial resolution) |
| Metabile peak separation | MRI systems with a higher field strength Two-dimensional MRS at higher magnetic field strengths to separate the overlapping peaks in an orthogonal dimension Homodecoupled or pure-shift experiments (where the indirect scalar couplings are removed) |
| Quantification | (MRI scanners are generally not designed to measure absolute signal levels) Metabolite ratios show good correlation with malignancy and can be used to identify suspicious areas Absolute concentration measurements can be obtained by calibration of measured metabolite signals against a reference signal produced by a material having a known concentration (e.g., an external phantom or an internal tissue) Improve quantification by correcting T1-related signal saturation and T2 relaxation of the metabolite signals and the reference water signal Improved data processing and quantitation algorithms |
MRS, magnetic resonance spectroscopy; MRI, magnetic resonance imaging; STEAM, stimulated echo acquisition mode; PRESS, point-resolved spectroscopy; TE, echo time.
Conclusion
In conclusion, 1H-MRS technique can aid in the management of cancer patients, serving as a noninvasive biomarker of metabolism in tumors. 1H-MRS has achieved great strides as a molecular imaging technique since its introduction, and its scope in many clinical scenarios and research settings is rising. However, MRS needs expertise and is time consuming, which limit its clinical applicability. In this setting, spectra analysis needs to be simplified. Future work should also be concentrated on the evaluation of changes in the spectral pattern as an indicator of response during treatment of malignant disease.
Main points.
Magnetic resonance spectroscopy (MRS) allows the analysis and quantification of metabolites present in a tissue in a noninvasive way by locating their specific peaks.
MRS allows the characterization of the metabolic changes associated with cancer, which are dependent on tumor type.
MRS interpretation is mainly based on checking the elevation of certain characteristic metabolites or the absence or decrease of normal metabolites.
MRS shows important limitations in the clinical field: it is technically complex, time-consuming, and requires complex data processing.
Footnotes
Conflict of interest disclosure
A.R. Padhani serves on the advisory board of Siemens Healthcare, speakers bureau of Siemens Healthcare and Johnson & Johnson. He is a researcher of Siemens Healthcare.
Juan Carlos Cobas Gómez is the chief of research of Mestrelab, a company devoted to the development of software applications for chemistry investigation and industry.
References
- 1.Hajek M, Dezortova M. Introduction to clinical in vivo MR spectroscopy. Eur J Radiol. 2008;67:185–193. doi: 10.1016/j.ejrad.2008.03.002. http://dx.doi.org/10.1016/j.ejrad.2008.03.002. [DOI] [PubMed] [Google Scholar]
- 2.Glunde K, Bhujwalla ZM. Metabolic tumor imaging using magnetic resonance spectroscopy. Semin Oncol. 2011;38:26–41. doi: 10.1053/j.seminoncol.2010.11.001. http://dx.doi.org/10.1053/j.seminoncol.2010.11.001. [DOI] [PMC free article] [PubMed] [Google Scholar]
- 3.Glunde K, Bhujwalla ZM, Ronen SM. Choline metabolism in malignant transformation. Nat Rev Cancer. 2011;11:835–848. doi: 10.1038/nrc3162. http://dx.doi.org/10.1038/nrc3162. [DOI] [PMC free article] [PubMed] [Google Scholar]
- 4.Kwock L, Smith JK, Castillo M, et al. Clinical role of proton magnetic resonance spectroscopy in oncology: brain, breast, and prostate cancer. Lancet Oncol. 2006;7:859–868. doi: 10.1016/S1470-2045(06)70905-6. http://dx.doi.org/10.1016/S1470-2045(06)70905-6. [DOI] [PubMed] [Google Scholar]
- 5.Jansen JF, Carlson DL, Lu Y, et al. Correlation of a prior DCE-MRI and (1)H-MRS data with molecular markers in neck nodal metastases: Initial analysis. Oral Oncol. 2012;48:717–722. doi: 10.1016/j.oraloncology.2012.02.001. http://dx.doi.org/10.1016/j.oraloncology.2012.02.001. [DOI] [PMC free article] [PubMed] [Google Scholar]
- 6.Yeung DK, Yang WT, Tse GM. Breast cancer: in vivo proton MR spectroscopy in the characterization of histopathologic subtypes and preliminary observations in axillary node metastases. Radiology. 2002;225:190–197. doi: 10.1148/radiol.2243011519. http://dx.doi.org/10.1148/radiol.2243011519. [DOI] [PubMed] [Google Scholar]
- 7.Skoch A, Jiru F, Bunke J. Spectroscopic imaging: basic principles. Eur J Radiol. 2008;67:230–239. doi: 10.1016/j.ejrad.2008.03.003. http://dx.doi.org/10.1016/j.ejrad.2008.03.003. [DOI] [PubMed] [Google Scholar]
- 8.Klose U. Measurement sequences for single voxel proton MR spectroscopy. Eur J Radiol. 2008;67:194–201. doi: 10.1016/j.ejrad.2008.03.023. http://dx.doi.org/10.1016/j.ejrad.2008.03.023. [DOI] [PubMed] [Google Scholar]
- 9.Pinker K, Stadlbauer A, Bogner W, Gruber S, Helbich TH. Molecular imaging of cancer: MR spectroscopy and beyond. Eur J Radiol. 2012;81:566–577. doi: 10.1016/j.ejrad.2010.04.028. http://dx.doi.org/10.1016/j.ejrad.2010.04.028. [DOI] [PubMed] [Google Scholar]
- 10.Posse S, Otazo R, Dager SR, Alger J. MR spectroscopic imaging: principles and recent advances. J Magn Reson Imaging. 2013;37:1301–1325. doi: 10.1002/jmri.23945. http://dx.doi.org/10.1002/jmri.23945. [DOI] [PMC free article] [PubMed] [Google Scholar]
- 11.Poullet J-B, Sima DM, Van Huffel S. MRS signal quantitation: A review of time- and frequency-domain methods. J Magn Reson. 2008;195:134–144. doi: 10.1016/j.jmr.2008.09.005. http://dx.doi.org/10.1016/j.jmr.2008.09.005. [DOI] [PubMed] [Google Scholar]
- 12.Mandal PK. In vivo proton magnetic resonance spectroscopic signal processing for the absolute quantitation of brain metabolites. Eur J Radiol. 2012;81:e653–e664. doi: 10.1016/j.ejrad.2011.03.076. http://dx.doi.org/10.1016/j.ejrad.2011.03.076. [DOI] [PubMed] [Google Scholar]
- 13.Bulik M, Jancalek R, Vanicek J, Skoch A, Mechl M. Potential of MR spectroscopy for assessment of glioma grading. Clin Neurol Neurosurg. 2013;115:146–153. doi: 10.1016/j.clineuro.2012.11.002. http://dx.doi.org/10.1016/j.clineuro.2012.11.002. [DOI] [PubMed] [Google Scholar]
- 14.Horská A, Barker PB. Imaging of brain tumors: MR spectroscopy and metabolic imaging. Neuroimaging Clin N Am. 2010;20:293–310. doi: 10.1016/j.nic.2010.04.003. http://dx.doi.org/10.1016/j.nic.2010.04.003. [DOI] [PMC free article] [PubMed] [Google Scholar]
- 15.McKnight TR. Proton magnetic resonance spectroscopic evaluation of brain tumor metabolism. Semin Oncol. 2004;31:605–617. doi: 10.1053/j.seminoncol.2004.07.003. http://dx.doi.org/10.1053/j.seminoncol.2004.07.003. [DOI] [PubMed] [Google Scholar]
- 16.Oz G, Alger JR, Barker PB, et al. Clinical proton MR spectroscopy in central nervous system disorders. Radiology. 2014;270:658–679. doi: 10.1148/radiol.13130531. http://dx.doi.org/10.1148/radiol.13130531. [DOI] [PMC free article] [PubMed] [Google Scholar]
- 17.Griffin JL, Bollard M, Nicholson JK, et al. Spectral profiles of cultured neuronal and glial cells derived from HRMAS (1)H NMR spectroscopy. NMR Biomed. 2002;15:375–384. doi: 10.1002/nbm.792. http://dx.doi.org/10.1002/nbm.792 [DOI] [PubMed] [Google Scholar]
- 18.Brandão L, Castillo M. Adult brain tumors: clinical applications of magnetic resonance spectroscopy. Neuroimaging Clin N Am. 2013;23:527–555. doi: 10.1016/j.nic.2013.03.002. http://dx.doi.org/10.1016/j.nic.2013.03.002. [DOI] [PubMed] [Google Scholar]
- 19.Crawford FW, Khayal IS, McGue C, et al. Relationship of pre-surgery metabolic and physiological MR imaging parameters to survival for patients with untreated GBM. J Neurooncol. 2009;91:337–351. doi: 10.1007/s11060-008-9719-x. http://dx.doi.org/10.1007/s11060-008-9719-x. [DOI] [PMC free article] [PubMed] [Google Scholar]
- 20.Chawla S, Wang S, Wolf RL, et al. Arterial spin-labeling and MR spectroscopy in the differentiation of gliomas. AJNR Am J Neuroradiol. 2007;28:1683–1689. doi: 10.3174/ajnr.A0673. http://dx.doi.org/10.3174/ajnr.A0673. [DOI] [PMC free article] [PubMed] [Google Scholar]
- 21.Chernov MF, Hayashi M, Izawa M, et al. Multivoxel proton MRS for differentiation of radiation-induced necrosis and tumor recurrence after gamma knife radiosurgery for brain metastases. Brain Tumor Pathol. 2006;23:19–27. doi: 10.1007/s10014-006-0194-9. http://dx.doi.org/10.1007/s10014-006-0194-9. [DOI] [PubMed] [Google Scholar]
- 22.Suppiah S, Rahmat K, Mohd-Shah MN, et al. Improved diagnostic accuracy in differentiating malignant and benign lesions using single-voxel proton MRS of the breast at 3T MRI. Clin Radiol. 2013;68:502–510. doi: 10.1016/j.crad.2013.04.002. http://dx.doi.org/10.1016/j.crad.2013.04.002. [DOI] [PubMed] [Google Scholar]
- 23.Begley JKP, Redpath TW, Patrick J, Bolan PJ, Gilbert FJ. In vivo proton magnetic resonance spectroscopy of breast cancer: a review of the literature. Breast Cancer Res. 2012;14:207. doi: 10.1186/bcr3132. http://dx.doi.org/10.1186/bcr3132. [DOI] [PMC free article] [PubMed] [Google Scholar]
- 24.Başara I, Örgüç Ş, Coşkun T. Single voxel in vivo proton magnetic resonance spectroscopy of breast lesions: experience in 77 cases. Diagn Interv Radiol. 2013;19:221–226. doi: 10.5152/dir.2012.005. [DOI] [PubMed] [Google Scholar]
- 25.Tse GM, Cheung HS, Pang LM, et al. Characterization of lesions of the breast with proton MR spectroscopy: comparison of carcinomas, benign lesions, and phyllodes tumors. AJR. 2003;181:1267–1272. doi: 10.2214/ajr.181.5.1811267. http://dx.doi.org/10.2214/ajr.181.5.1811267. [DOI] [PubMed] [Google Scholar]
- 26.Kousi E, Tsougos I, Vasiou E, et al. Magnetic resonance spectroscopy of the breast at 3T: pre- and post-contrast evaluation for breast lesion characterization. Sci World J. 2012;2012:1–9. doi: 10.1100/2012/754380. http://dx.doi.org/10.1100/2012/754380. [DOI] [PMC free article] [PubMed] [Google Scholar]
- 27.Baltzer P, Dietzel M. Breast lesions: diagnosis by using proton MR spectroscopy at 1.5 and 3.0 T- systematic review and meta-analysis. Radiology. 2013;267:735–746. doi: 10.1148/radiol.13121856. http://dx.doi.org/10.1148/radiol.13121856. [DOI] [PubMed] [Google Scholar]
- 28.Dorrius MD, Pijnappel RM, Jansen-van der Weide MC, et al. Determination of choline concentrations in breast lesions: quantitative multivoxel proton MR spectroscopy as a promising noninvasive assessment tool to exclude benign lesions. Radiology. 2011;259:695–703. doi: 10.1148/radiol.11101855. http://dx.doi.org/10.1148/radiol.11101855. [DOI] [PubMed] [Google Scholar]
- 29.Katz-Brull R, Lavin PT, Lenkinski RE. Clinical utility of proton magnetic resonance spectroscopy in characterizing breast lesions. J Natl Cancer Inst. 2002;94:1197–1203. doi: 10.1093/jnci/94.16.1197. http://dx.doi.org/10.1093/jnci/94.16.1197. [DOI] [PubMed] [Google Scholar]
- 30.Jacobs MA, Barker PB, Argani P, et al. Combined dynamic contrast enhanced breast MR and proton spectroscopic imaging: a feasibility study. J Magn Reson Imaging. 2005;21:23–28. doi: 10.1002/jmri.20239. http://dx.doi.org/10.1002/jmri.20239. [DOI] [PubMed] [Google Scholar]
- 31.Le-Petross HC, Hylton N. Role of breast MR imaging in neoadjuvant chemotherapy. Magn Reson Imaging Clin N Am. 2010;18:249–258. doi: 10.1016/j.mric.2010.02.008. http://dx.doi.org/10.1016/j.mric.2010.02.008. [DOI] [PubMed] [Google Scholar]
- 32.Hoeks CM, Barentsz JO, Hambrock T, et al. Prostate cancer: multiparametric MR imaging for detection, localization, and staging. Radiology. 2011;261:46–66. doi: 10.1148/radiol.11091822. http://dx.doi.org/10.1148/radiol.11091822. [DOI] [PubMed] [Google Scholar]
- 33.Verma S, Rajesh A, Fütterer JJ, et al. Prostate MRI and 3D MR spectroscopy: how we do it. AJR Am J Roentgenol. 2010;194:1414–1426. doi: 10.2214/AJR.10.4312. http://dx.doi.org/10.2214/AJR.10.4312. [DOI] [PMC free article] [PubMed] [Google Scholar]
- 34.Zakian KL, Sircar K, Hricak H, et al. Correlation of proton MR spectroscopic imaging with gleason score based on step-section pathologic analysis after radical prostatectomy. Radiology. 2005;234:804–814. doi: 10.1148/radiol.2343040363. http://dx.doi.org/10.1148/radiol.2343040363. [DOI] [PubMed] [Google Scholar]
- 35.Kobus T, Vos PC, Hambrock T, et al. Prostate cancer aggressiveness: in vivo assessment of MR spectroscopy and diffusion-weighted imaging at 3T. Radiology. 2012;265:457–467. doi: 10.1148/radiol.12111744. http://dx.doi.org/10.1148/radiol.12111744. [DOI] [PubMed] [Google Scholar]
- 36.Zakian KL, Eberhardt S, Hricak H, et al. Transition zone prostate cancer: metabolic characteristics at 1H MR spectroscopic imaging–initial results. Radiology. 2003;229:241–247. doi: 10.1148/radiol.2291021383. http://dx.doi.org/10.1148/radiol.2291021383. [DOI] [PubMed] [Google Scholar]
- 37.Jung JA, Coakley FV, Vigneron DB, et al. Prostate depiction at endorectal MR spectroscopic imaging: investigation of a standardized evaluation system. Radiology. 2004;233:701–708. doi: 10.1148/radiol.2333030672. http://dx.doi.org/10.1148/radiol.2333030672. [DOI] [PubMed] [Google Scholar]
- 38.Barentsz JO, Richenberg J, Clements R, et al. ESUR prostate MR guidelines 2012. Eur Radiol. 2012;22:746–757. doi: 10.1007/s00330-011-2377-y. http://dx.doi.org/10.1007/s00330-011-2377-y. [DOI] [PMC free article] [PubMed] [Google Scholar]
- 39.PI-RADS v2. Prostate Imaging and Reporting and Data System: Version 2. [Accessed January 9, 2015]. Available at: http://www.acr.org/~/media/ACR/Documents/PDF/QualitySafety/Resources/PIRADS/PIRADS%20V2.
- 40.Sankineni S, Wood BJ, Rais-Bahrami S, et al. Image-guided focal therapy for prostate cancer. Diagn Interv Radiol. 2014;20:492–497. doi: 10.5152/dir.2014.14134. http://dx.doi.org/10.5152/dir.2014.14134. [DOI] [PMC free article] [PubMed] [Google Scholar]
- 41.Vargas HA, Wassberg C, Akin O, Hricak H. MR imaging of treated prostate cancer. Radiology. 2012;262:26–42. doi: 10.1148/radiol.11101996. http://dx.doi.org/10.1148/radiol.11101996. [DOI] [PMC free article] [PubMed] [Google Scholar]
- 42.Yu KK, Scheidler J, Hricak H, et al. Prostate cancer: prediction of extracapsular extension with endorectal MR imaging and three-dimensional proton MR spectroscopic imaging. Radiology. 1999;213:481–488. doi: 10.1148/radiology.213.2.r99nv26481. http://dx.doi.org/10.1148/radiology.213.2.r99nv26481. [DOI] [PubMed] [Google Scholar]
- 43.Platzek I, Borkowetz A, Toma M, et al. Multiparametric prostate magnetic resonance imaging at 3 T: failure of magnetic resonance spectroscopy to provide added value. J Comput Assist Tomogr. 2015. May 1, [Epub ahead of print] http://dx.doi.org/10.1097/RCT.0000000000000261. [DOI] [PubMed]
- 44.Abdel Razek AA, Poptani H. MR spectroscopy of head and neck cancer. Eur J Radiol. 2013;82:982–989. doi: 10.1016/j.ejrad.2013.01.025. http://dx.doi.org/10.1016/j.ejrad.2013.01.025. [DOI] [PubMed] [Google Scholar]
- 45.Bisdas S, Fetscher S, Feller A, et al. Primary B cell lymphoma of the sphenoid sinus: CT and MRI characteristics with correlation to perfusion and spectroscopic imaging features. Eur Arch Otorhinolaryngol. 2007;264:1207–1213. doi: 10.1007/s00405-007-0322-0. http://dx.doi.org/10.1007/s00405-007-0322-0. [DOI] [PubMed] [Google Scholar]
- 46.King A, Yeung D, Yu K, et al. Monitoring of treatment response after chemoradiotherapy for head and neck cancer using in vivo 1H MR spectroscopy. Eur Radiol. 2010;20:165–172. doi: 10.1007/s00330-009-1531-2. http://dx.doi.org/10.1007/s00330-009-1531-2. [DOI] [PubMed] [Google Scholar]
- 47.Kuo YT, Li CW, Chen CY, Jao J, Wu DK, Liu GC. In vivo proton magnetic resonance spectroscopy of large focal hepatic lesions and metabolite change of hepatocellular carcinoma before and after transcatheter arterial chemoembolization using 3.0-T MR scanner. J Magn Reson Imaging. 2004;19:598–604. doi: 10.1002/jmri.20046. http://dx.doi.org/10.1002/jmri.20046. [DOI] [PubMed] [Google Scholar]
- 48.Li CW, Kuo YC, Chen CY, et al. Quantification of choline compounds in human hepatic tumors by proton MR spectroscopy at 3 T. Magn Reson Med. 2005;53:770–776. doi: 10.1002/mrm.20412. http://dx.doi.org/10.1002/mrm.20412. [DOI] [PubMed] [Google Scholar]
- 49.Ter Voert E, Heijmen L, van Laarhoven H, Heerschap A. In vivo magnetic resonance spectroscopy of liver tumors and metastases. World J Gastroenterol. 2011;17:5133–5149. doi: 10.3748/wjg.v17.i47.5133. http://dx.doi.org/10.3748/wjg.v17.i47.5133. [DOI] [PMC free article] [PubMed] [Google Scholar]
- 50.Fischbach F, Schirmer T, Thormann M, Freund T, Ricke J, Bruhn H. Quantitative proton magnetic resonance spectroscopy of the normal liver and malignant hepatic lesions at 3.0 Tesla. Eur Radiol. 2008;18:2549–2558. doi: 10.1007/s00330-008-1040-8. http://dx.doi.org/10.1007/s00330-008-1040-8. [DOI] [PubMed] [Google Scholar]
- 51.Xu L, Liu B, Huang Y, et al. 3.0 T proton magnetic resonance spectroscopy of the liver: quantification of choline. World J Gastroenterol. 2013;19:1472–1477. doi: 10.3748/wjg.v19.i9.1472. http://dx.doi.org/10.3748/wjg.v19.i9.1472. [DOI] [PMC free article] [PubMed] [Google Scholar]
- 52.Su TH, Jin EH, Shen H, Zhang Y, He W. In vivo proton MRS of normal pancreas metabolites during breath-holding and free-breathing. Clin Radiol. 2012;67:633–637. doi: 10.1016/j.crad.2011.05.018. http://dx.doi.org/10.1016/j.crad.2011.05.018. [DOI] [PubMed] [Google Scholar]
- 53.Ma X, Zhao X, Ouyang H, et al. The metabolic features of normal pancreas and pancreatic adenocarcinoma: preliminary result of in vivo proton magnetic resonance spectroscopy at 3.0 T. J Comput Assist Tomogr. 2011;35:539–543. doi: 10.1097/RCT.0b013e318227a545. http://dx.doi.org/10.1097/RCT.0b013e318227a545. [DOI] [PubMed] [Google Scholar]
- 54.Yao X, Zeng M, Wang H, Fei S, Rao S, Ji Y. Metabolite detection of pancreatic carcinoma by in vivo proton MR spectroscopy at 3T: initial results. Radiol Med. 2012;117:780–788. doi: 10.1007/s11547-011-0757-7. http://dx.doi.org/10.1007/s11547-011-0757-7. [DOI] [PubMed] [Google Scholar]
- 55.Kim MJ, Lee SJ, Lee JH, et al. Detection of rectal cancer and response to concurrent chemoradiotherapy by proton magnetic resonance spectroscopy. Magn Reson Imaging. 2012;30:848–853. doi: 10.1016/j.mri.2012.02.013. http://dx.doi.org/10.1016/j.mri.2012.02.013. [DOI] [PubMed] [Google Scholar]
- 56.Dzik-Jurasz AS, Murphy PS, George M, et al. Human rectal adenocarcinoma: demonstration of 1H-MR spectra in vivo at 1.5 T. Magn Reson Med. 2002;47:809–811. doi: 10.1002/mrm.10108. http://dx.doi.org/10.1002/mrm.10108. [DOI] [PubMed] [Google Scholar]
- 57.Mun CW, Cho JY, Shin WJ, et al. Ex vivo proton MR spectroscopy (1H-MRS) for evaluation of human gastric carcinoma. Magn Reson Imaging. 2004;22:861–870. doi: 10.1016/j.mri.2004.01.045. http://dx.doi.org/10.1016/j.mri.2004.01.045. [DOI] [PubMed] [Google Scholar]
- 58.Booth SJ, Pickles MD, Turnbull LW. In vivo magnetic resonance spectroscopy of gynaecological tumours at 3.0 Tesla. BJOG. 2009;116:300–303. doi: 10.1111/j.1471-0528.2008.02007.x. http://dx.doi.org/10.1111/j.1471-0528.2008.02007.x. [DOI] [PubMed] [Google Scholar]
- 59.Okada T, Harada M, Matsuzaki K, Nishitani H, Aono T. Evaluation of female intrapelvic tumors by clinical proton MR spectroscopy. J Magn Reson Imaging. 2001;13:912–917. doi: 10.1002/jmri.1130. http://dx.doi.org/10.1002/jmri.1130. [DOI] [PubMed] [Google Scholar]
- 60.Celik O, Sarac K, Hascalik S, Alkan A, Mizrak B, Yologlu S. Magnetic resonance spectroscopy features of uterine leiomyomas. Gynecol Obstet Invest. 2004;58:194–201. doi: 10.1159/000080020. http://dx.doi.org/10.1159/000080020. [DOI] [PubMed] [Google Scholar]
- 61.Takeuchi M, Matsuzaki K, Harada M. Differentiation of benign and malignant uterine corpus tumors by using proton MR spectroscopy at 3T: preliminary study. Eur Radiol. 2011;21:850–856. doi: 10.1007/s00330-010-1974-5. http://dx.doi.org/10.1007/s00330-010-1974-5. [DOI] [PubMed] [Google Scholar]
- 62.Takeuchi M, Matsuzaki K, Harada M. Preliminary observations and clinical value of lipid peak in high-grade uterine sarcomas using in vivo proton MR spectroscopy. Eur Radiol. 2013;23:2358–2363. doi: 10.1007/s00330-013-2856-4. http://dx.doi.org/10.1007/s00330-013-2856-4. [DOI] [PubMed] [Google Scholar]
- 63.Payne GS, Schmidt M, Morgan VA, et al. Evaluation of magnetic resonance diffusion and spectroscopy measurements as predictive biomarkers in stage 1 cervical cancer. Gynecol Oncol. 2010;116:246–252. doi: 10.1016/j.ygyno.2009.09.044. http://dx.doi.org/10.1016/j.ygyno.2009.09.044. [DOI] [PubMed] [Google Scholar]
- 64.Mahon MM, Williams AD, Soutter WP, et al. 1H magnetic resonance spectroscopy of invasive cervical cancer: an in vivo study with ex vivo corroboration. NMR Biomed. 2004;17:1–9. doi: 10.1002/nbm.830. http://dx.doi.org/10.1002/nbm.869. [DOI] [PubMed] [Google Scholar]
- 65.Lee JH, Cho KS, Kim YM, et al. Localized in vivo 1H nuclear MR spectroscopy fo evaluation of human uterine cervical carcinoma. AJR Am J Roentgenol. 1998;170:1279–1282. doi: 10.2214/ajr.170.5.9574601. http://dx.doi.org/10.2214/ajr.170.5.9574601. [DOI] [PubMed] [Google Scholar]
- 66.Allen JR, Prost RW, Griffith OW, Erickson SJ, Erickson BA. In vivo proton (H1) magnetic resonance spectroscopy for cervical carcinoma. Am J Clin Oncol. 2001;24:522–529. doi: 10.1097/00000421-200110000-00021. http://dx.doi.org/10.1097/00000421-200110000-00021. [DOI] [PubMed] [Google Scholar]
- 67.Delikatny EJ, Russell P, Hunter JC, et al. Proton MR and human cervical neoplasia: ex vivo spectroscopy allows distinction of invasive carcinoma of the cervix from carcinoma in situ and other preinvasive lesions. Radiology. 1993;188:791–796. doi: 10.1148/radiology.188.3.8351349. http://dx.doi.org/10.1148/radiology.188.3.8351349. [DOI] [PubMed] [Google Scholar]
- 68.McLean MA, Priest AN, Joubert I, et al. Metabolic characterization of primary and metastatic ovarian cancer by 1H-MRS in vivo at 3T. Magn Reson Med. 2009;62:855–861. doi: 10.1002/mrm.22067. http://dx.doi.org/10.1002/mrm.22067. [DOI] [PubMed] [Google Scholar]
- 69.Stanwell P, Russell P, Carter J, Pather S, Heintze S, Mountford C. Evaluation of ovarian tumors by proton magnetic resonance spectroscopy at three Tesla. Invest Radiol. 2008;43:745–751. doi: 10.1097/RLI.0b013e31817e9104. http://dx.doi.org/10.1097/RLI.0b013e31817e9104. [DOI] [PubMed] [Google Scholar]
- 70.Takeuchi M, Matsuzaki K, Harada M. Preliminary observations and diagnostic value of lipid peak in ovarian thecomas/fibrothecomas using in vivo proton MR spectroscopy at 3T. J Magn Reson Imaging. 2012;36:907–911. doi: 10.1002/jmri.23711. http://dx.doi.org/10.1002/jmri.23711. [DOI] [PubMed] [Google Scholar]
- 71.Sharpe RM. Regulation of spermatogenesis. In: Knobil E, Neill JD, editors. The physiology of reproduction. New York: Raven Press; 1994. pp. 1363–1434. [Google Scholar]
- 72.Firat AK, Uğraş M, Karakaş HM, et al. 1H magnetic resonance spectroscopy of the normal testis: preliminary findings. Magn Reson Imaging. 2008;26:215–220. doi: 10.1016/j.mri.2007.06.008. http://dx.doi.org/10.1016/j.mri.2007.06.008. [DOI] [PubMed] [Google Scholar]
- 73.Aaronson DS, Iman R, Walsh TJ, Kurhanewicz J, Turek PJ. A novel application of 1H magnetic resonance spectroscopy: non-invasive identification of spermatogenesis in men with non-obstructive azoospermia. Hum Reprod. 2010;25:847–852. doi: 10.1093/humrep/dep475. http://dx.doi.org/10.1093/humrep/dep475. [DOI] [PubMed] [Google Scholar]
- 74.Baleato-González S, León-Mateos L, Pérez-Santiago MI, C Vilanova JC. Scrotum. In: Luna A, Vilanova JC, Hygino Da Cruz LC Jr, Rossi SE, editors. Functional imaging in oncology, clinical applications - Volume 2. Berlin Heidelberg: Springer-Verlag; 2014. pp. 1209–1232. [Google Scholar]
- 75.Russo F, Mazzetti S, Grignani G, et al. In vivo characterisation of soft tissue tumours by 1.5-T proton MR spectroscopy. Eur Radiol. 2012;22:1131–1139. doi: 10.1007/s00330-011-2350-9. http://dx.doi.org/10.1007/s00330-011-2350-9. [DOI] [PubMed] [Google Scholar]
- 76.Subhawong TK, Wang X, Durand DJ, et al. Proton MR spectroscopy in metabolic assessment of musculoskeletal lesions. AJR Am J Roentgenol. 2012;198:162–172. doi: 10.2214/AJR.11.6505. http://dx.doi.org/10.2214/AJR.11.6505. [DOI] [PMC free article] [PubMed] [Google Scholar]
- 77.Doganay S, Altinok T, Alkan A, Kahraman B, Karakas HM. The role of MRS in the differentiation of benign and malignant soft tissue and bone tumors. Eur J Radiol. 2011;79:33–37. doi: 10.1016/j.ejrad.2010.12.089. http://dx.doi.org/10.1016/j.ejrad.2010.12.089. [DOI] [PubMed] [Google Scholar]