

Abstract
Hundreds of genes reside in structurally complex, poorly understood regions of the human genome1-3. One such region contains the three amylase genes (AMY2B, AMY2A, and AMY1) responsible for digesting starch into sugar. The copy number of AMY1 is reported to be the genome’s largest influence on obesity4, though genome-wide association studies for obesity have found this locus unremarkable. Using whole genome sequence analysis3,5, droplet digital PCR6, and genome mapping7, we identified eight common structural haplotypes of the amylase locus that suggest its mutational history. We found that AMY1 copy number in individuals’ genomes is generally even (rather than odd) and partially correlates to nearby SNPs, which do not associate with BMI. We measured amylase gene copy number in 1,000 obese or lean Estonians and in two other cohorts totaling ~3,500 individuals. We had 99% power to detect the lower bound of the reported effects on BMI4, yet found no association.
Like hundreds of human genes, the amylase genes reside in a structurally complex locus, one with inversions, deletions, and duplications8. Each of the three amylase genes, which encode enzymes that digest starch into sugar, varies widely in copy number, with AMY1 varying from 2–17 copies9,10, AMY2A from 0–810, and AMY2B from 2–6. Given their role in starch metabolism and AMY1’s greater average copy number in three populations with high starch diets9, it has been hypothesized that AMY1 copy number shapes the metabolic response to diet. A recent study reported that each copy of AMY1 decreases the risk of obesity 1.2-fold4, potentially a profound effect since AMY1 copy number varies so widely (2–17 copies; standard deviation, 2.4 copies). The effect of AMY1 copy number, reported to explain 11% of the genetic contribution to obesity (far greater than the effect of SNPs at FTO, the largest effect detected in GWAS4), was not detected in a GWAS of 339,224 people11. The discordance between these results raises questions about the completeness of GWAS and other genome-scale approaches in human genetics4. However, complex CNVs are notoriously difficult to measure12, and CNV association studies often involve rough copy number estimates that can be confounded by technical factors that would be readily detected in molecularly precise data13-15. We sought to understand these issues at the amylase locus.
We first measured the copy number of the three amylase genes in two large, partially overlapping cohorts. We analyzed whole genome sequence data from 569 individuals from Phase 1 of the 1000 Genomes Project16 using our Genome STRiP3,5 algorithm (Supplementary Tables 1 and 2). We also measured copy number in 114 parent-offspring trios from HapMap17 using droplet digital PCR (ddPCR) (Supplementary Fig. 1 and 2). These data, which were concordant across overlapping samples (Supplementary Fig. 3), revealed two relationships:
Individuals are four times more likely to have an even (2, 4, 6, etc.) than an odd (1, 3, 5, etc.) number of AMY1 copies (Fig. 1a).
AMY1 and AMY2A share parity – the copy numbers of AMY1 and AMY2A are almost always both odd, or both even (Fig. 1b).
These features have not been observed in studies that used lower-precision molecular methods, such as real-time PCR and array CGH, or lower-precision analyses of WGS data, to measure copy number2,4,9,18.
Figure 1. The copy number distributions of the amylase genes and the structural haplotypes of the amylase locus.
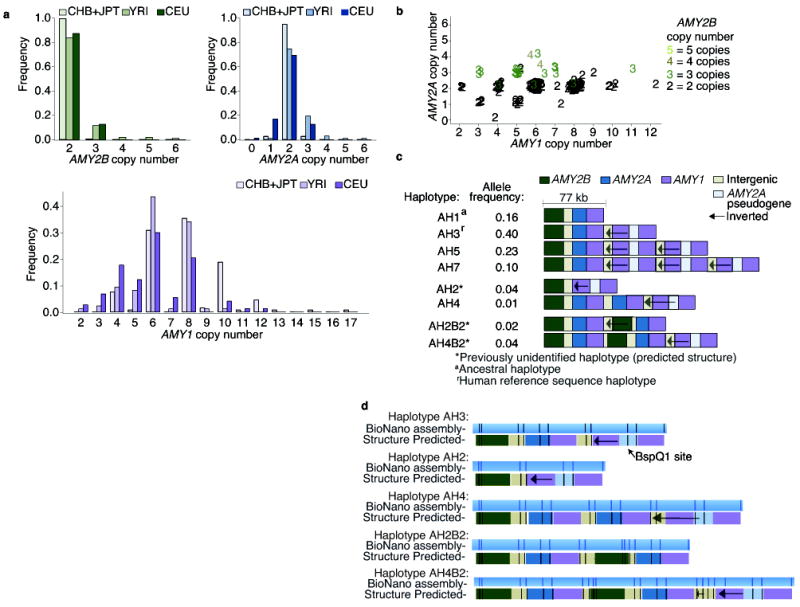
Whole-genome sequence data from European (CEU), Yoruba (YRI), Chinese (CHB), and Japanese (JPT) population samples from the 1000 Genomes Project were analyzed for AMY1, AMY2A, and AMY2B copy number using Genome STRiP. (a) The populations have similar distributions of AMY2A and AMY2B, but a different distribution for AMY1 (KS test, P value = 3 × 10⁻⁶). For AMY1, even copy numbers greatly outnumber odd copy numbers. (b) In the YRI and CEU population samples, AMY2A and AMY1 share parity in 98% of individuals: when AMY2A copy number is odd, so is AMY1 copy number. JPT and CHB samples had very few odd copy numbers and were excluded from the figure. (c) A preliminary map of eight common structural forms of the amylase locus in Europeans, derived from the above analysis and with structural features ordered using earlier data from cosmid mapping and (d) genome mapping experiments to analyze the haplotypes (AH2, AH3, AH4, AH2B2, AH4B2). Additional structural forms found only in African genomes are described in Supplementary Fig. 4.
If these observations are correct, then they would need to arise from an underlying set of structural alleles, only some of which have been previously identified8,9,19. To ascertain the gene content of these amylase structural alleles, we extended an approach we developed for the 17q21.31 locus, one of the first structurally complex loci to be resolved into structural alleles20,21. We precisely measured and followed the segregation of each amylase gene’s copy number in 114 father-mother-offspring trios (from HapMap cohorts of European and West African ancestry), allowing us to assign copy numbers to transmitted and untransmitted chromosomes and thereby to assemble models of the gene contents of each structural allele (Fig. 1c). We further evaluated these inferences by: (i) quantifying how many individuals have genotypes that can be explained by a modest number of common haplotypes; and (ii) comparing our inferred structural haplotypes to the haplotypes previously identified by fiber FISH and restriction mapping of clones8,9,19.
We found that eight common haplotypes could explain 98% of the combinations of AMY1, AMY2A, and AMY2B copy numbers we observed in 480 Europeans from the 1000 Genomes Project16. We identified common haplotypes consistent with five of the six previously identified haplotypes8,9,19, along with three novel haplotypes in the European trios (CEU) and evidence for additional, rarer haplotypes in the West African trios (YRI) (Fig. 1c, Supplementary Table 3, and Supplementary Fig. 4). Because these analyses do not specify the order of these genes on the structural haplotypes, we used earlier data from cosmid mapping8,19 and fiber FISH9, and performed nanochannel-based genome mapping analysis7, to predict the order of structural features on these alleles (Fig. 1d and Supplementary Fig. 5).
This set of common haplotypes and their frequencies (Fig. 1c) explained both the predominance of even AMY1 copy numbers in diploid genomes and the sharing of odd/even parity between AMY1 and AMY2A. Most European chromosomes (89%) contained an odd number of AMY1 copies, which naturally sum to an even number in diploid genomes. In addition, the AMY1-odd haplotypes (those that have an odd number of copies of AMY1) each have one copy of AMY2A, while the AMY1-even haplotypes have either zero or two copies of AMY2A (Fig. 1c), resulting in odd AMY2A and AMY1 copy numbers segregating together and explaining the sharing of odd/even parity between these genes.
The structural haplotypes (Fig. 1c) also suggest the mutational history of the locus. The more common AMY1-odd haplotypes differ in the copy number of a tandemly duplicated cassette that contains two head-to-head AMY1 genes. We found that these AMY1-odd haplotypes (haplotypes AH1, AH3, AH5, AH7 in Fig. 1c) segregate on many of the same SNP haplotypes (Fig. 2a and Supplementary Fig. 6), and we identified different historical recombination sites within their intergenic regions (Supplementary Fig. 7 and 8). Frequent non-allelic homologous recombination22 (NAHR) involving the tandem array could have generated these many structural forms (haplotypes AH1, AH3, AH5, AH7 in Fig. 1c). In contrast, the haplotypes containing even numbers of AMY1 copies appear to segregate on distinct SNP haplotype backgrounds, consistent with having arisen from unique mutational events that involved more-complex rearrangements by a rarer mutation mechanism (Fig. 1c).
Figure 2. The relationship of the amylase structural haplotypes to SNPs and SNP haplotypes.
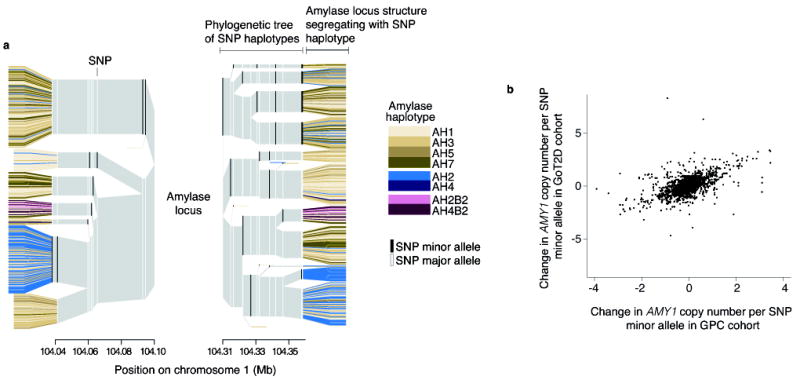
(a) Displayed are the SNP haplotypes flanking the structural alleles of the amylase locus in the Europeans (CEU+GBR+TSI+IBS+FIN) of the 1000 Genomes Project. The amylase alleles are represented by the colored leaves, though the locus actually resides within the center of the plot. The colored columns are the SNP alleles, and the gray is the invariant surrounding region. The branchpoints mark where the SNP haplotypes diverge due to mutation or recombination. Note that the AMY1-odd structures (brown) share multiple SNP haplotype backgrounds, while other amylase structures (blue, green) segregate on distinct branches. Also note that specific SNP haplotypes (branches) appear to associate with greater or lesser average AMY1 copy number than others do. (b) The relationship of nearby SNPs to AMY1 copy number is consistent across two European-ancestry cohorts.
Based on these AMY1 structures and their relationships to surrounding SNP haplotypes (Fig. 2a), we hypothesized that individual SNPs near the amylase genes may at least partially correlate with AMY1 copy number within populations. We compared the AMY1 copy number of European individuals from the 1000 Genomes Project16 to their SNP genotypes and found SNPs that had an average difference of 0.6 to 2.0 AMY1 copies per SNP minor allele (Table 1). Permutation tests established that these correlations were statistically significant. The partial correlations between AMY1 copy number and these SNPs replicated in two independent cohorts of 768 and 2,807 European-ancestry individuals sampled in the U.S. and Europe (Fig. 2b, Supplementary Fig. 9, and Supplementary Table 4 and 5).
Table 1.
Association of SNPs to amylase copy number and BMI in large cohorts.
| Gene | SNP | Minor Allele Freq. |
AMY1 copy number association
|
BMI association P value | |||||
|---|---|---|---|---|---|---|---|---|---|
| Change in copy number /minor allele
|
r2
|
P value
|
|||||||
| GPC | GoT2D | GPC | GoT2D | GPC | GoT2D | ||||
| AMY1 | rs4244372 | 0.33 | −1.23 | −1.25 | 0.111 | 0.118 | <10−6 | <10−6 | 0.09 |
| rs11577390 | 0.07 | 2.08 | 1.88 | 0.104 | 0.089 | <10−6 | <10−6 | 0.13 | |
| rs1566154 | 0.19 | 0.90 | 0.88 | 0.044 | 0.038 | <10−6 | <10−6 | 0.11 | |
| rs1930212 | 0.18 | −0.89 | −1.05 | 0.041 | 0.053 | <10−6 | <10−6 | 0.74 | |
| rs10881197 | 0.35 | −0.66 | −0.73 | 0.037 | 0.042 | <10−6 | <10−6 | 0.75 | |
| rs2132957 | 0.03 | −1.95 | −1.29 | 0.036 | 0.022 | <10−6 | <10−6 | 0.73 | |
| rs11185098 | 0.26 | 0.70 | 0.79 | 0.032 | 0.035 | <10−6 | <10−6 | 0.80 | |
| rs1999478 | 0.18 | −0.76 | −0.92 | 0.030 | 0.042 | <10−5 | <10−6 | 0.53 | |
| rs1330403 | 0.14 | 0.82 | 0.75 | 0.029 | 0.020 | <10−6 | <10−6 | 0.42 | |
| rs6696797 | 0.35 | −0.60 | −0.72 | 0.028 | 0.041 | <10−5 | <10−6 | 0.63 | |
|
| |||||||||
| AMY2B | rs12076610 | 0.11 | 0.80 | 0.61 | 0.582 | 0.479 | <10−6 | <10−6 | ND |
| AMY2B | rs11185098 | 0.26 | 0.35 | 0.24 | 0.207 | 0.166 | <10−6 | <10−6 | 0.80 |
| AMY2A | rs28558115 | 0.11 | 0.90 | 0.72 | 0.398 | 0.270 | <10−6 | <10−6 | ND |
| AMY2A | rs11185098 | 0.26 | 0.42 | 0.32 | 0.154 | 0.112 | <10−6 | <10−6 | 0.80 |
Correlations between amylase copy number and SNP minor alleles are calculated from two cohorts analyzed by whole genome sequencing, the Genomic Psychiatry Cohort (768 European-ancestry individuals, sampled in the U.S.), and GoT2D (2,863 individuals sampled in Europe). BMI association P values are from the GIANT Consortium meta-analysis of 339,224 individuals.
ND = Not determined.
Although each of these SNPs explains only a small fraction of AMY1 copy number variation, power in GWAS arises from the product of linkage disequilibrium (r2) and sample size: in the GIANT Consortium’s meta analysis of SNP data from 339,224 individuals11, a contribution of AMY1 copy number to BMI as strong as that reported4 would be 99.9% likely to bring about a nominal (P < 0.05) association to the more correlated SNPs. However, none of the 17 SNPs in the GIANT meta-analysis reached even nominal (P = 0.05) significance, and the SNPs as a group showed no trend toward low association statistics (Table 1 and Supplementary Fig. 10).
Since this lack of evidence for AMY1’s association with BMI is indirect, we conducted our own association analyses by directly measuring the copy numbers of the amylase genes using our high-resolution methods in three European cohorts.
We began by analyzing DNA from 1,000 Estonians selected from a broader Estonian Biobank23 cohort (51,535 individuals) for being in the tails of the BMI distribution – 500 individuals with BMI<22 and 500 individuals with BMI>33. Among these 1,000 individuals, we observed associations to the SNPs that have associated with BMI in earlier studies24, including SNPs at the FTO (P = 3.5×10⁻⁷), SEC16B (P = 5.3×10⁻⁴), and MTCH2 (P = 9.6×10⁻³) loci, and association to a polygenic score calculated from 11 SNPs (P = 3.7×10⁻¹²) (Table 2, Supplementary Table 6, and Supplementary Fig. 11). With these positive controls validating the study design and demonstrating power to detect the much larger reported effect of AMY14, we used ddPCR to obtain integer genotypes of all three amylase genes, again observing the preponderance of even AMY1 copy numbers (Fig. 3a). We had >99% power to detect (at nominal significance) effects as strong as those reported4. However, we did not observe even a nominal association between obesity and the copy number of any amylase gene (P = 0.70 for AMY1) (Fig. 3b and Supplementary Table 7).
Table 2.
Association analyses of AMY1 copy number and previously BMI-associated SNPs in multiple obesity and BMI cohorts.
| Cohort | Sample size | Gene | Variant genotyped | Power | Odds ratio, obesity | P value |
|---|---|---|---|---|---|---|
| Estonian | 1000 | FTO | rs1558902 | 0.96 | 1.61 (1.34–1.93) | 3.5 × 10⁻⁷ |
| Polygenic | 11 SNPs | >0.99 | 1.61 (1.41–1.84) | 3.7 × 10⁻¹² | ||
| AMY1 | Copy number | >0.99 | 1.01 (0.96–1.06) | 0.7 | ||
| Beta, BMI
|
||||||
| InCHIANTI | 657 | FTO | rs1558902 | 0.32 | 0.41 (−0.04–0.86) | 0.07 |
| Polygenic | 11 SNPs | 0.64 | 0.50 (0.20–0.81) | 0.001 | ||
| AMY1 | Copy number | 0.77 | 0.04 (−0.08–0.15) | 0.53 | ||
| GoT2D controls | 1370 | FTO | rs1558902 | 0.58 | 0.03 (−0.02–0.07) | 0.22 |
| Polygenic | 11 SNPs | 0.91 | 0.08 (0.04–0.12) | 4.2 × 10⁻⁴ | ||
| AMY1 | Copy number | 0.95 | 0.01 (−0.01–0.03) | 0.31 | ||
| GoT2D cases | 1437 | FTO | rs1558902 | 0.60 | 0.03 (−0.01–0.07) | 0.21 |
| Polygenic | 11 SNPs | 0.93 | 0.06 (0.02–0.10) | 6.3 × 10⁻³ | ||
| AMY1 | Copy number | 0.95 | 0.01 (−0.01–0.03) | 0.24 | ||
| GoT2D meta–analysis | 2807 | FTO | rs1558902 | 0.87 | 0.05 (0.02–0.08) | 4.2 × 10⁻³ |
| Polygenic | 11 SNPs | >0.99 | 0.10 (0.06–0.13) | 3.9 × 10⁻⁸ | ||
| AMY1 | Copy number | >0.99 | 0.01 (−0.01–0.02) | 0.44 |
AMY1 copy number was inferred by ddPCR in the Estonian cohort, and by whole-genome sequencing in the other cohorts. 95% confidence intervals in parentheses. For the 11-SNP polygenic score, odds ratio/beta is reported per SD of score. Power is for a significance level of 0.05.
Figure 3. The association analysis of AMY1 copy number to obesity or BMI in three cohorts.
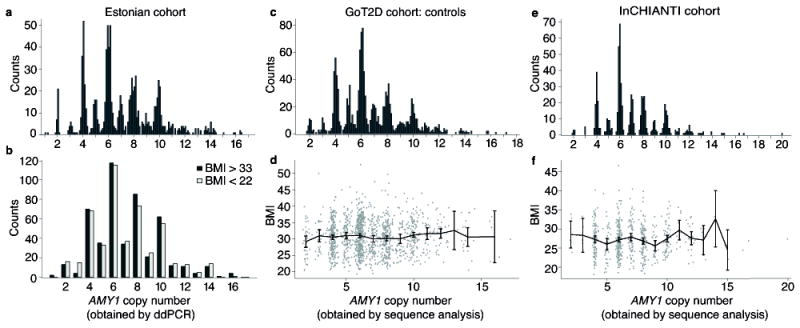
Out of a cohort of 51,535 Estonians, those in the tails of the BMI distribution (500 individuals with BMI < 22 | 500 individuals with BMI > 33) were measured for copy number of all three amylase genes and genotyped for SNPs in obesity-related genes. (a) Measurements of AMY1 copy number in the Estonian cohort. (b) Obese and lean individuals show indistinguishable distributions of AMY1 copy number (P > 0.05). Statistical tests were performed on raw measurements as well as AMY2A-informed AMY1 copy number (Methods). (c) Measurements of AMY1 copy number and (d) association are shown for the GoT2D cohort controls. (e) Measurements of AMY1 copy number and (f) association are shown for the InCHIANTI cohort. Points are the mean BMI for each AMY1 copy number. Error bars are the 95% confidence intervals.
We then analyzed two other cohorts of Europeans - one consisting of 2,807 individuals (1,437 type 2 diabetes cases and 1,370 controls) sequenced to >5x average coverage (GoT2D cohort), and the other of 657 Europeans sequenced to 7x median coverage (InCHIANTI25). Analysis of amylase gene copy number (using Genome STRiP3,5) again showed the enrichment of even, relative to odd, copy numbers (Fig. 3a), validating the precision of the analysis. The GoT2D cases and controls each had 95% power, while InCHIANTI had 77% power, to detect the reported effect4 of AMY1 at nominal significance (Table 2). Yet, AMY1 copy number did not associate with BMI in any group (P = 0.31 for GoT2D controls, P = 0.24 for GoT2D cases, P =0.53 for InCHIANTI) (Fig. 3), or in a meta-analysis of all 3,464 replication samples (P = 0.38). By contrast, SNPs at FTO and other loci implicated in GWAS had the associations expected given sample size and statistical power (Table 2, and Supplementary Table 8).
These results contrast with a recent report finding that AMY1 copy number exerts a stronger effect on BMI and obesity than do SNPs at FTO and other loci4. We believe that the difference from the reported observation likely comes from our use of higher-resolution approaches for both molecular and computational analysis (Supplementary Fig. 12). Many studies have found that low-resolution, poorly clustering molecular data conceal technical effects that can create the false impression of strong associations13-15,26,27. We also considered the possibility that our study could have failed to see a real genetic effect. Our study utilized an Estonian study cohort, in addition to two other European cohorts with elevated body weight. The Estonian diet is slightly different than that of other European countries28, though it appears to be similarly rich in starch29. We also considered the possibility that amylase acts in ways that are specific to lean individuals, but we saw no evidence for this in our BMI cohorts (Supplementary Table 9) and we note that other BMI-associated variants have tended to associate in ways that are consistent across the BMI spectrum30. We note that a subsequent study of a different obesity cohort31 did not observe the previously reported shifting of the distribution of AMY1 copy number between obese and lean individuals, but instead described an outlier set of control samples with unusually high AMY1 copy number measurements31. We believe this constitutes a different hypothesis, rather than a replication, of the earlier finding at AMY1.
Fully understanding human genetic variation and its relationship to phenotypes will require characterizing hundreds of complex loci, like the amylase locus, that mutate at high frequencies in ways that cause large-scale changes in the dosage and expression of genes. Some of these loci could, as has been proposed32-34, represent loci capable of rapid evolutionary adaptation. The amylase locus offers several insights to guide studies of structurally complex loci. First, the high apparent complexity observed in measurements from diploid genomes may arise combinatorially from a modest number of common structural forms that appear in different combinations in different diploid genomes. Second, structurally complex loci reflect both ancient and recent mutations and may be best understood through combinations of analysis methods developed for common and rare variants, including tagging, imputation, and direct molecular analysis. Third, although GWAS may miss or under-estimate the relationships of structurally complex loci to phenotypes, accurately typed SNP markers can help constrain plausible expectations about the strength of a CNV’s potential effect on a phenotype. Whole genome sequencing of large cohorts will ultimately reveal the extent to which this and many other structurally complex loci contribute to human phenotypes.
Methods
Cohort Collection
Estonian Sample Collection
The Estonian Biobank is the population-based biobank of the Estonian Genome Center of the University of Tartu (EGCUT) (www.biobank.ee). The EGCUT is conducted according to the Estonian Gene Research Act, and all participants are volunteers that have signed broad informed consent23. The cohort size is currently 51,535 people from 18 years of age and up. All subjects are recruited randomly by general practitioners and physicians in hospitals. A computer-assisted personal interview is conducted at the doctor’s office to record personal data, genealogical data, lifestyle data, and the subjects’ educational and occupational history.
Medical history and current health status are recorded according to the ICD10 and medication according to the ATC. Anthropometric measurements are taken, along with blood pressure (sitting position at the end of the interview), and resting heart rate. 30-50 mL of venous blood are collected into EDTA Vacutainers. These are transported to the central laboratory of EGCUT at 4-6 degrees Celsius within 6 to 36 hours after collection. Upon arrival, DNA, plasma and WBC are immediately isolated and kept in aliquots in MAPI straws in liquid nitrogen.
A Hamilton Robotics Automated Sample Management system with a 100,000 tube capacity is used for intermediate storage of normalized DNA samples (50–100 ng/μL) in tubes with 2D-barcodes. This enables a quick and highly accurate delivery of the samples by cherry-picking according to the selected barcodes.
The 1,000 Estonian samples used in the current study were selected from the BMI extremes of the EGCUT population cohort of 51,535 samples. The lean (BMI < 22) and the obese (BMI > 33) groups were matched on age-at-recruitment and year-of-birth to account for cohort and life-course effects on overall body composition (demographic details given in Supplementary Table 10), resulting in the obese being in the 98th percentile (females: 99.5th percentile) of the cohort’s BMI and the lean being in the 87th (females: 82nd). The lower threshold for the lean control samples is due to age and gender matching to the obese samples. The extreme sets included 250 samples from both genders and were limited to only individuals with Estonian nationality and whose self-reported mother tongue was Estonian. Further measures to account for potential population structure are described further down.
GoT2D Sample Collection
The Genetics of Type 2 Diabetes (GoT2D) study aims to characterize type 2 diabetes and related quantitative traits’ genetic architecture through low-coverage whole-genome sequencing, deep (~100x) exome sequencing, and 2.5M SNP genotyping of cases and controls from four large European cohorts: Diabetes Genetics Initiative (DGI), Finland-United States Investigation of NIDDM Genetics (FUSION), GoT2D-UK, and Kooperative Gesundheitsforschung in der Region Augsburg (KORA)26,35-38. These larger cohorts are a mixture of smaller ones obtained in Finland, Sweden, the UK, and Germany. Due to the confounding effect of diabetes on BMI, cases and controls were analyzed separately while controlling for the cohort of origin. Only the low-coverage data was used in the current study (Supplementary Table 11).
InCHIANTI Cohort Sample Collection
We selected 680 individuals from the InCHIANTI study25,39 - a study of aging from the Chianti region in Tuscany, Italy - for low pass whole genome sequencing. Individuals were selected for sequencing based on the availability of gene expression and circulating biomarker data (Supplementary Table 12).
Whole-genome sequencing was performed at the Beijing Genomics Institute (BGI), Shenzhen, China using the Illumina HiSeq 2000 to obtain a minimum read depth of 6X. An average of 240 million paired-end 90bp reads per sample were aligned to the 1000 Genomes implementation of the Genome Reference Consortium’s build 37 of the human reference genome40, using the burrows-wheeler aligner (BWA) version 1.5.941.
GPC Cohort Sample Collection
Headed by the Center for Genomic Psychiatry at USC, the GPC cohort is a collection of individuals with schizophrenia and bipolar disorder, along with controls. Participants are recruited from the United States and selected sites abroad. The subset used in this study consisted of 768 self-reported (and genetically confirmed) European-ancestry patients from the United States that were whole genome sequenced from blood to a depth of 30x. Data on BMI were not available.
Droplet Digital PCR
General
Droplet digital PCR6 is similar in concept and preparation to a real-time qPCR reaction but with a few important modifications. Before amplification, the DNA is first digested with a restriction enzyme in order physically separate the copies of the CNV that are on the same DNA strand. The PCR reaction mixture is prepared similar to qPCR, with each primer at 900nM, the fluorescent probes at 250nM, and the input DNA around 1ng/ul. The reaction is then emulsified into approximately 20,000 water droplets surrounded by oil using a droplet generator (BioRad). The droplets are thermocycled using a standard thermocycler with the BioRad-supplied PCR protocol (with an additional 10 cycles), and the droplets containing the probes’ targets then become fluorescent. The fluorescent droplets are then counted by a droplet reader (BioRad). At low DNA input concentrations, each fluorescent droplet contains only one PCR target, thus allowing us to count the near-exact number of targets within the reaction – as opposed to comparing amplification curves, like in qPCR. At higher DNA concentrations, a Poisson correction factor is applied to account for droplets possibly having more than one target.
Control Probes
The standard control probe for ddPCR is targeted to RPP30. However, since amylase is in a late replicating region42, DNA isolated from replicating cells will naturally have less of it than other parts of the genome – the parts that have already replicated (Supplementary Fig. 3c). To counteract this, we used a probe assay targeted to just outside the amylase region, called Near_AMY (Supplementary Table 1).
Genotype Calling
The output of the droplet reader is a scatterplot with FAM fluorescence on the y-axis and HEX/VIC on the x. Each dot represents a droplet (Supplementary Fig. 13). The Quantasoft software draws suggested thresholds for positive FAM and HEX droplets. The experimenter checks those thresholds and redraws if needed (while still blinded to sample identity). A CNV copy number call is found by dividing the number of droplets fluorescing FAM, corresponding to the CNV target, by the number of droplets fluorescing VIC, the control target (both numbers being Poisson corrected). Before the final genotype call, the raw CNV calls of each plate are corrected by a plate-wide correction factor, generally between 0.97-1.05 (Supplementary Fig. 13b,c).
HapMap Samples
Plates containing the HapMap17 DNA samples for CEU and YRI were subjected to ddPCR in three reactions for AMY2B, AMY2A, and AMY1 using the “assay1” assays listed in Supplementary Table 1. All except half the CEU individuals on the AMY2B run were done using the control assay Near_AMY. DNA inputs varied, due to the variation of DNA concentration across the plate, but the ideal DNA concentration strived for was 1ng/ul for AMY1 reactions and 0.5ng/ul for AMY2B and AMY2A reactions. All copy numbers reported are from a single reaction for each gene. We did not average multiple replicates to get copy numbers. However, we do have multiple runs on file for these assays and others (Supplementary Fig. 3b,d,e).
Estonian Samples
The Estonian DNA was aliquoted into 96 well plates, with a random distribution of under- and overweight samples (KS test, P = 0.51). The ddPCR runs were done within a three week period in the same lab, using the same machines, with an experimenter blind to the case-control status of the samples – thus reducing the risk of batch effects and biases. Each sample had one genotyping run of each of these assays: AMY2B_assay1, AMY2A_assay1, AMY1_assay1, and AMY1_assay2 (with the exception of Plate 1, which did not have an AMY1_assay2 run).
AMY2B
Initially, 28 Estonians had copy number calls less than 2 for AMY2B (CN of 0 or 1), a call that should be impossible given AMY2B’s copy number distribution. We hypothesized that an Estonian-specific SNP may be interfering with the assay and ran those samples again using AMY2B_assay2. All the samples, except for 3, then had calls consistent with the known AMY2B distribution (CN of 2 or 3). In the association analysis, the AMY2B_assay2 genotype calls were used for these samples.
AMY1
Two different assays targeting AMY1 were used in order to reduce the noise a single assay may have. Two different DNA input concentrations were used with the AMY1 assays to ensure that each sample had at least one genotype call acquired when it was within the optimal concentration range for ddPCR. In the concentrated reaction, each sample of the plate was pre-calculated to have > 0.2ng/ul DNA input concentration and were genotyped with the AMY1_assay1. However, given the wide distribution of sample concentrations on each plate, the concentrated run resulted in many of the samples oversaturating their reactions. In the diluted run (AMY1_assay2), each sample input was pre-calculated to produce >10% probe-negative droplets, thus diluting the previously over-saturated samples.
AMY2A-adjusted averaging of the AMY1 copy number calls
To avoid biases that may arise from sample DNA concentration differences between cases and controls, we did not filter or clean the data based on concentration and used every genotype call the BioRad QuantaSoft software provided. However, a straight average of these two AMY1 replicate genotype calls was not ideal, since many of the samples had one genotype call obtained when the sample was too dilute or over-concentrated, thus adding noise to their better genotype call (Supplementary Fig. 14).
Given that AMY1 and AMY2A share parity (that is, their copy numbers are either both odd or both even), we can check the correctness of the AMY1 copy number call using the AMY2A call. In practice, this means checking each individual’s two replicate AMY1 calls for concordance with their AMY2A call. If both AMY1 calls were concordant, they were averaged (70% of samples). If only one was concordant, only the concordant AMY1 genotype was used (24% of samples). If both calls were not concordant, they were averaged (6% of samples). This resulted in better clustering at integers (average deviation from integer 0.152, compared to straight averaging 0.179) despite having nothing to do with either DNA concentration, distance from an integer, or confidence intervals. It should be noted that a BMI association was done separately with all three – arrangements AMY2A adjusted average, straight average, and each run separately – all resulting in P > 0.05.
Read-depth genotyping
Algorithm
As a second method for determining the integer copy number of the CNV segments, we used recent versions of the Genome STRiP software5 to determine copy number from whole-genome sequencing data. Briefly, for each CNV, the number of unique sequencing reads falling within the target CNV were counted for each individual and compared to the expected number of reads. We required a minimum mapping quality of 10 and that the reads were aligned to a unique position on the reference genome, except in cases where the target CNV is duplicated in the reference genome (such as AMY1). The expected number of reads per copy was estimated based on the genome-wide sequencing coverage for each individual, correcting for the alignability of the CNV segment and for sequencing bias due to GC content. Alignability was estimated by mapping overlapping k-mers from the reference genome back to the reference. For the HapMap cohort (from 1000 Genomes Phase 1), we used a k-mer length of 36 and for the GoT2D, InCHIANTI, and GPC cohorts (which have longer reads), we used a k-mer length of 101. GC-bias was estimated by counting the number of aligned reads in overlapping 400bp windows binned by GC fraction compared to a set of selected reference windows having no evidence of copy number variability.
The vectors of observed and expected read counts were fitted to a constrained Gaussian mixture model with two parameters (m1 and m2) and a site-specific number of genotype classes corresponding to the potential copy numbers. The number of copy-number classes was based on the individual with the highest observed to expected read count ratio (rounding up to the nearest integer and adding one extra copy number class). The means of each genotype class were constrained to be proportional (m1) to the copy number and the variances were constrained to be proportional (m2) to the copy number (or to a small constant k = 0.2 for the copy number zero class). After using an expectation maximization (EM) algorithm to determine the most likely values for m1, m2 and the proportional weighting of each copy-number class, the relative likelihood of the observed read depth given each potential genotype class was calculated for each individual. Fractional copy-number estimates for each individual used in plotting (Supplementary Fig. 1) are computed as the observed to expected ratios scaled by m1. Concordance with ddPCR in the InCHIANTI and GoT2D cohorts is given in Supplementary Fig. 15.
Determining the locations and boundaries of the copy-number variable genomic segments
We created an initial map of the potentially copy number variable segments at the amylase locus based on the paralogous gene annotations from the reference genome, annotated segmental duplications, and results from previous studies (Groot et al 1989, Perry et al 2007). ddPCR measurements were used to confirm copy number variability at specific primer amplification sites, while measurements from sequencing read depth were used to determined variability (or lack thereof) by interrogating the average copy number per individual across longer genomic segments.
Segmentation was further guided by building an alignability map of the locus by aligning k-mers (k=36, k=70 and k=100) from the reference genome back to the reference genome using BWA41 and using this alignability map to generate hypotheses about the extent of the copy-number variable segments. The segment boundaries were refined based on prospective genotyping of multiple candidate segments using sequencing read depth and Genome STRiP and then optimizing for segments that yielded integer copy numbers in all samples and high posterior genotype likelihoods (similar to the automated method used in recent versions Genome STRiP for optimizing boundaries in non-repetitive sequence). When some individuals were observed to cluster at mid-integer copy number estimates, suggesting the presence of additional copy-number variable sub-segments, we applied this procedure recursively down to the length scale resolvable from the available sequencing data sets. The variability of all segments, except for the intergenic region, was confirmed by designing ddPCR assays to these segments and carrying out ddPCR experiments to confirm the sequencing-based results
The bins used for the read-depth analysis are in Supplementary Table 1. Even though the bins for AMY1 are substantially larger than the AMY1 repeated segment, most of the signal Genome STRiP used to call genotypes arose from the AMY1 repeated segment (Supplementary Fig. 16).
BioNano Genomics, genome mapping
Nanochannel array based genome mapping experiments were performed by BioNano Genomics. In brief, genome mapping can be thought of as next-generation restriction mapping. Long, whole strands of DNA (~300kb) are labeled with a nickase that cuts at specific sequences and the DNA backbone is labeled with YoYo1. The DNA is electrophoresed through a NanoChannel array to straighten it for visual analysis. The nickase creates patterns that can be used to assemble a whole genome, or pieces thereof, in a manner similar to restriction mapping. Each amylase gene has its own restriction pattern, and because genome mapping uses whole strands of DNA, we can determine the order and orientation of the genes from these patterns.
We selected three individuals who together had three unreported haplotypes (AH2, AH4B2, and AH2B2), one partially assembled haplotype (AH4), and two known haplotypes to serve as positive controls (AH3 and AH1) (Supplementary Fig. 5). The haplotypes that had already been assembled (AH3 and AH243) were largely consistent. On the other hand, the AH4 structure contradicts the Perry et al. structure with one fewer inverted AMY1 copies9. In addition, anonymous samples that BioNano had access to, as well as a European American family, contained AH1, AH3, and AH5, which assembled into structures consistent with the known haplotypes. Of note, in several haplotypes the AMY2A pseudogene is inverted. This feature appears to be stably inherited, but has not been confirmed using a second technology.
Genotyping InCHIANTI cohort with alternative read-depth method
We analyzed 657 samples after quality control checks. Average depth was 7x. We aligned the reads to a repeat masked GRC build 37 reference genome using the mrsFAST ultra version 3.3.1 algorithm, which can align single reads to multiple positions in the genome and so is optimal for regions of variable copy number44. Repeats were detected and masked using both RepeatMasker Open-3.045 and Tandem Repeats Finder 4.07b46. Reads were mapped in single-read mapping mode with a hamming distance threshold of < 4 bp. We derived GC corrected absolute copy number in 100bp windows using mrCaNaVaR version 0.5147, a program that predicts from read depth and GC enrichment an absolute copy number. We calculated a mean copy number value for the three combined AMY1 regions, AMY2A and AMY2B. The distribution of AMY1 copy number is given in Supplementary Fig. 12. The read-depth bins are in Supplementary Table 1.
Phasing of HapMap samples
At first, trios were phased manually using only those haplotypes described in previous literature8-10, resulting in successful phasing for only 7% of the trios and 15% of individuals. We noticed patterns in some of the unphased trios that could be explained by new haplotypes (Supplementary Table 3) and found population evidence to support to those haplotypes (Fig. 1c and Supplementary Fig. 4). Adding the 5 new haplotypes resulted in successful phasing for 27% of trios and 39% of individuals. The remaining trios and individuals do not necessarily contain unknown haplotypes; rather most of them just have genotypes that correspond with multiple combinations of known haplotypes. For instance, 6 is the most common copy number for AMY1 and can be accomplished with 3 different combinations of known haplotypes, resulting in a phasing failure for nearly every six-copy number individual.
Calculation of haplotype frequencies
We could not calculate haplotype frequencies based on the individuals we could phase, since this would artificially enrich for haplotypes that can create unique, phase-able genotypes. Instead, we utilized haplotype AH2. Haplotype AH2 can be identified within individuals because it causes a characteristic decrease in AMY2A copy number, and its companion haplotype can be found by simple subtraction of copy numbers. We selected individuals carrying haplotype AH2 from the GPC cohort and the Europeans of 1000 Genomes (142 individuals total) and identified their other haplotype. We calculated the frequency of each haplotype in this pool of other haplotypes and reported it in Fig 1c. The frequency of haplotype AH4 cannot be determined this way, since it causes an increase in AMY2A that balances out haplotype AH2’s decrease, so its frequency was determined by identifying individuals that carry haplotype AH4 (marked by an increase in AMY2A) and dividing it by the total.
Clustering of SNP haplotypes (spiderplot)
All unrelated individuals in the 1000 Genomes European populations (CEU, TSI, GBR, FIN, IBS) that had amylase genotypes where the two structural haplotypes could be unambiguously determined were selected for SNP clustering in the spiderplot of Fig 2a. These individuals’ amylase haplotypes and SNP genotypes (downloaded from the 1000 Genomes website, Omni chip data, (ftp://ftp.1000genomes.ebi.ac.uk/vol1/ftp/technical/working/20120131_omni_genotypes_and_intensities/) were combined in a .bgl file and phased as a group using BEAGLE version 3.3.248 under the default conditions with no reference panel. The spiderplot created was from the 23 closest SNPs with a minor allele frequency greater than 1% and were outside of the variable region (resulting in 9 SNPs upstream, 14 downstream). The spiderplot was created by traversing the set of SNP haplotypes in both directions from the target variant (amylase) and grouping the haplotypes according to their state at each successive SNP to form two tree structures representing the left and right flanks. At each split, the branch corresponding to the minor allele was plotted above the branch corresponding to the major allele. The color of each horizontal segment indicates the allele frequency of the next SNP on the branch and the thickness corresponds to the number of haplotypes sharing that segment.
Association of SNPs to haplotypes and imputation
The individuals of the GPC cohort that had genotypes where the two amylase haplotypes could be unambiguously determined were used to search for tag SNPs for each haplotype. SNPs under 1% minor allele frequency and those within the copy number variable region were not used. Every remaining SNP was correlated with every haplotype, in turn, using a pearson test. During the test, all amylase haplotypes were recoded as 0 or 1, with the target haplotype being 1. P values were permuted by shuffling the amylase haplotypes 1 million times to create a distribution of possible r2 values for each SNP.
The efficiency of imputation was calculated based on leave-one-out trials. Briefly, each individual’s amylase haplotypes were masked, in turn, within the unphased data and phased using BEAGLE48 under default conditions using no reference panel. The amylase haplotypes that BEAGLE assigned were extracted and compared to the true values of the masked individuals. R-squared values were obtained with a pearson correlation and P values were calculated from 1 million permutations, creating an r2 distribution.
Association of SNPs to diploid copy number of the amylase genes
Separately, the GPC cohort, the GoT2D cohort, and the Europeans of 1000 Genomes were genotyped with read-depth analysis, and the diploid copy number calls were combined with the individuals’ SNP genotypes (recoded as 0, 1, or 2 for the number of alternative alleles present). Linear regression using each SNP genotype, in turn, as the predictor for AMY1 diploid copy number gave the effect size (slope of the line/coefficient of the regression) and r2 for the association of each SNP. P values were permuted by shuffling the amylase genotypes at least ten times (and up to a million times for the best SNPs) to create a distribution of effect sizes to which we compared the ‘true’ effect size. The permuted P values, r2 values, and effect sizes replicated across cohorts (Fig. 2c and Supplementary Fig. 9).
Searching GWAS for associated SNPs
Given the GPC cohort’s greater sample size and larger set of SNPs genotyped, we chose this cohort to display in Fig. 2b. We downloaded the publicly available GIANT consortium (http://www.broadinstitute.org/collaboration/giant) SNP P values for BMI association24 and compared each SNP’s BMI P value with its association to AMY1 copy number (Fig. 2b and Supplementary Fig. 10). We calculated the likelihood of an amylase association driving the association of an AMY1-correlated SNP by using the power calculator (Genetic Power Calculator (at http://pngu.mgh.harvard.edu/~purcell/gpc/)49) with the values of the r2 set as 0.111 (and translated to D’ using the equation D’ˆ2 = rˆ2*p1p2q1q2/Dmaxˆ2. The MAF was 0.33.
SNP Genotyping of Estonians, along with the polygenic score and ancestry analysis
The Estonian extremes had been previously genotyped with ExomeChip-v1.1 (Illumina Inc). As several replating events occurred between the array and ddPCR genotyping, the samples from the ddPCR batch were further genotyped by using Sequenom’s MassARRAY system (which allows a single base extension with allele-specific masses). A multiplex pool of 24 SNPs was used for BMI association in the Estonian cohort with 10 SNPs selected from the AMY locus (the best associated SNPs from 1000 Genomes) and 14 previously identified SNPs associated with BMI24 (Supplementary Table 13). The latter set of SNPs was assayed to estimate the statistical power in the Estonian cohort to validate BMI linked genetic associations. Genotypes were called by mass spectrometry. Samples with less than an 85% genotype success rate and SNPs with less than an 85% genotype success rate and/or poor Hardy-Weinberg P value (<0.001) were excluded from the analysis. 10 AMY locus SNPs and 11 BMI SNPs passed the QC and were used in subsequent analysis. We observed 100% genotype concordance between the MassARRAY and ExomeChip-v1.1 SNP calls.
PLINK50 --score functionality was used to build a single quantitative index of genetic susceptibility load for obesity. For that, the 11 BMI SNPs’ allele dosages were weighted against the effect-sizes reported in Speliotes et al. (Supplementary Table 13) and added up to a single polygenic score. Based on the estimated total trait variation explained reported in Speliotes et al., the constructed polygenic score is capturing roughly 0.8% of BMI variation.
ExomeChip data was also used to account for potential population stratification in the extremes sample. ExomeChip genotype data was quality controlled using PLINK50 and standard quality control parameters – 1) sample call-rate >95%; 2) marker call-rate >95%; 3) marker allele frequency > 1% and 4) Hardy-Weinberg P value <1×10⁻⁶. Cleaned data was combined with HapMap2 genotypes (downloaded from the PLINK resources page) and subsequently analyzed for population structure using the multidimensional scaling (MDS) function in PLINK. Resulting MDS plots show that, although Estonian samples cluster tightly with the CEU cluster (Supplementary Fig. 17), slight structuring is present within the cohort. For that reason, three first MDS vectors were used as covariates in the subsequent association analysis.
Phenotype normalization in the Estonian and GoT2D cohort
The standard GIANT Consortium protocol for normalizing the measures-of-obesity phenotype normally consists of adjusting BMI scores in a gender-stratified way for age, age-squared and genetic ancestry vectors (usually three and obtained through PCA or MDS analysis of genome-wide genotype) (Supplementary Table 14) by fitting a linear regression model. Next, the residuals from the model are transformed using an inverse normal transformation and used in subsequent association analyses.
This protocol was slightly modified for normalizing the 1,000 Estonians to account for the extreme-design and to more precisely capture the underlying trait distribution in the whole sampling cohort of ~51,000. First, the previously described trait normalization (except only age and age-square were used as covariates) was separately performed in females (N:32,724) and males (N:17,352), resulting in the normalized BMI statistics for the 1,000 extreme samples given in Supplementary Table 6. In subsequent analyses, both genders were analyzed together and sex and three MDS genetic vectors (estimated using ExomeChip data) were used as covariates to account for both gender differences and population stratification.
Power Analysis Estonian Cohort
In order to make sure that the Estonian Extremes design has sufficient statistical power to find the associations reported in Falchi et al., we used the Genetic Power Calculator (at http://pngu.mgh.harvard.edu/~purcell/gpc/)49, since it has the option to account for threshold-selected quantitative trait design. Falchi et al. reports that AMY1 copy number explains 0.66% to 4.40% (95% CI) of the genetic variance in BMI. By using the same calculations as Falchi et al used to estimate the total variance explained for obesity, we back-calculated the mean total BMI variance explained and estimated it as 1.11% (95% CI = 0.461–1.79). The phenotypic thresholds in standard deviation units for defining the case and control sets were obtained from the normalized BMI scores described in the previous paragraph and were as follows in standard deviation units – 1) Case thresholds +2.0 and +4.0; 2) Control thresholds -1.2 and -4.2.
The genetic effect sizes, trait-increasing allele frequencies, and respective total trait variation explained for the SNPs were obtained from the latest GIANT Consortium full report16 and have been outlined in Supplementary Table 13. For the GIANT Consortium based power analysis, the stage 1 sample size of 124,000 was used. For estimating our power with the polygenic-scores, all individual SNP-based total trait variation explained were summed into one estimate (0.81%) and a conservative trait increasing allele frequency of 10% was used.
Association analysis in the Estonian sample cohorts
Both logistic and linear regression models were used to detect association between BMI and the 21 directly genotyped SNPs using PLINK50. In the linear regression model, the normalized BMI scores were used, and in both models, gender and three genetic vectors were used as covariates. We used the integer genotypes of the copy number of all three amylase genes obtained through ddPCR in the same 1,000 individuals. For the AMY1 gene, four different copy number estimates were used – AMY2A adjusted average, straight average, and both genotyping runs separately (as described in section AMY2A-adjusted averaging). Again both logistic and linear regression models were fitted using the same phenotype and covariates in R51. A similar analytical framework was used to detect the association between BMI and the constructed polygenic score. No association between the AMY genes’ copy number and obesity was observed by either model (Supplementary Table 6).
Association analysis in the InCHIANTI cohort
We regressed the copy number values against body mass index corrected for age and sex. We used all copy number calls regardless of quality. The distribution of total (diploid) absolute copy number plotted against BMI is given in Fig 3e. Our analyses did not provide any evidence of an association between amylase copy number and BMI in AMY1 (P = 0.53), AMY2A (P = 0.37) and AMY2B (P = 0.49). Using the more refined method of classifying AMY1 copy number using the triplicated regions of AMY1 alone, we still did not see any association with BMI (P =0.50).
Association analysis in the GOT2D cohort
The dataset was first divided into T2D-cases (N: 1,437) and controls (N: 1.374). The BMI phenotype was transformed using the GIANT protocol (described above – adjusting BMI scores in a gender-stratified way for age and age-squared by fitting a linear regression model and subsequently applying inverse normal transformation on resulting residuals from the model). Cases and controls were analyzed separately and the copy number values were regressed against normalized BMI scores while adjusting for gender and source-cohort. All copy number calls were used, regardless of quality. The latter variable was included in order to correct for population stratification as the GOT2D sample consists of 9 separate cohort-collections (Botnia, Diabetes-Registry, FUSION, Helsinki, KORA, Malmö, MPP, STT and WTCCC). Whereas both sub-cohorts (cases and controls) had >95% power to replicate the Falchi et al result (total variance explained 1.11%), we did not observe nominally significant associations with any of the AMY locus copy numbers in neither sub-cohort (Supplementary Table 8).
Supplementary Material
Acknowledgments
This work was supported by the National Human Genome Research Institute (R01 HG006855) given to S.A.M to support C.L.U, R.E.H, and S.A.M. Work by T.E. and A.M. was supported through the Estonian Genome Center of University of Tartu by Targeted Financing from the Estonian Ministry of Science and Education (SF0180142s08), the Development Fund of the University of Tartu (SP1GVARENG), the European Regional Development Fund to the Centre of Excellence in Genomics (3.2.0304.11-0312), and through FP7 grant 313010. T.E., A.M. and J.N.H. were further supported by the US National Institute of Health (R01 DK075787). T.M.F. is supported by European Research Council funding (FP7 SZ-50371-GLUCOSEGENES), M.A.T. and M.N.W. are supported by the Wellcome Trust Institutional Strategic Support Award (WT097835MF), and M.B. is supported by NIH grant DK062370.
Footnotes
C.L.U., J.N.H. and S.A.M conceived the project. C.L.U. pursued molecular (ddPCR) and statistical analyses of amylase locus structural variation. R.E.H. contributed analyses of whole-genome sequence data,. T.E., A.M., C.L.U., J.E.M, J.N.H analyzed the Estonian cohort. M.A.T., M.N.W., T.M.F., R.E.H., S.K. analyzed the InCHIANTI cohort. M.I.M., M.B., D.M.A., R.E.H., C.L.U., C.F. analyzed the GoT2D cohort. C.N.P., M.T.P., C.L.U., R.E.H. analyzed the GPC cohort. A.R.H and H.C. did the nanochannel-based genome mapping. C.L.U., J.N.H, and S.A.M. wrote the manuscript, with contributions from D.M.A., T.M.F, M.B., M.I.M., and T.E.
Competing Interests
A.R.H. and H.C. are employees at BioNano Genomics Inc. and own company stock options.
References
- 1.Conrad DF, et al. Origins and functional impact of copy number variation in the human genome. Nature. 2010;464:704–712. doi: 10.1038/nature08516. [DOI] [PMC free article] [PubMed] [Google Scholar]
- 2.Sudmant PH, et al. Diversity of human copy number variation and multicopy genes. Science. 2010;330:641–646. doi: 10.1126/science.1197005. [DOI] [PMC free article] [PubMed] [Google Scholar]
- 3.Handsaker RE, et al. Large multiallelic copy number variations in humans. Nat Genet. 2015;47:296–303. doi: 10.1038/ng.3200. [DOI] [PMC free article] [PubMed] [Google Scholar]
- 4.Falchi M, et al. Low copy number of the salivary amylase gene predisposes to obesity. Nat Genet. 2014;46:492–497. doi: 10.1038/ng.2939. [DOI] [PMC free article] [PubMed] [Google Scholar]
- 5.Handsaker RE, Korn JM, Nemesh J, McCarroll SA. Discovery and genotyping of genome structural polymorphism by sequencing on a population scale. Nature genetics. 2011;43:269–276. doi: 10.1038/ng.768. [DOI] [PMC free article] [PubMed] [Google Scholar]
- 6.Hindson BJ, et al. High-throughput droplet digital PCR system for absolute quantitation of DNA copy number. Anal Chem. 2011;83:8604–8610. doi: 10.1021/ac202028g. [DOI] [PMC free article] [PubMed] [Google Scholar]
- 7.Hastie AR, et al. Rapid genome mapping in nanochannel arrays for highly complete and accurate de novo sequence assembly of the complex Aegilops tauschii genome. PLoS ONE. 2013;8:e55864. doi: 10.1371/journal.pone.0055864. [DOI] [PMC free article] [PubMed] [Google Scholar]
- 8.Groot PC, et al. The human alpha-amylase multigene family consists of haplotypes with variable numbers of genes. Genomics. 1989;5:29–42. doi: 10.1016/0888-7543(89)90083-9. [DOI] [PubMed] [Google Scholar]
- 9.Perry GH, et al. Diet and the evolution of human amylase gene copy number variation. Nat Genet. 2007;39:1256–1260. doi: 10.1038/ng2123. [DOI] [PMC free article] [PubMed] [Google Scholar]
- 10.Groot PC, Mager WH, Frants RR. Interpretation of polymorphic DNA patterns in the human alpha-amylase multigene family. Genomics. 1991;10:779–785. doi: 10.1016/0888-7543(91)90463-o. [DOI] [PubMed] [Google Scholar]
- 11.Locke AE, et al. Genetic studies of body mass index yield new insights for obesity biology. Nature. 2015;518:197–206. doi: 10.1038/nature14177. [DOI] [PMC free article] [PubMed] [Google Scholar]
- 12.Cantsilieris S, White SJ. Correlating multiallelic copy number polymorphisms with disease susceptibility. Human mutation. 2013;34:1–13. doi: 10.1002/humu.22172. [DOI] [PubMed] [Google Scholar]
- 13.Barnes C, et al. A robust statistical method for case-control association testing with copy number variation. Nat Genet. 2008;40:1245–1252. doi: 10.1038/ng.206. [DOI] [PMC free article] [PubMed] [Google Scholar]
- 14.Clayton DG, et al. Population structure, differential bias and genomic control in a large-scale, case-control association study. Nat Genet. 2005;37:1243–1246. doi: 10.1038/ng1653. [DOI] [PubMed] [Google Scholar]
- 15.Zanda M, et al. A genome-wide assessment of the role of untagged copy number variants in type 1 diabetes. PLoS Genet. 2014;10:e1004367. doi: 10.1371/journal.pgen.1004367. [DOI] [PMC free article] [PubMed] [Google Scholar]
- 16.The 1000 Genomes Project Consortium. An integrated map of genetic variation from 1,092 human genomes. Nature. 2012;491:56–65. doi: 10.1038/nature11632. [DOI] [PMC free article] [PubMed] [Google Scholar]
- 17.International HapMap Consortium. The International HapMap Project. Nature. 2003;426:789–796. doi: 10.1038/nature02168. [DOI] [PubMed] [Google Scholar]
- 18.Carpenter D, et al. Obesity, starch digestion and amylase: association between copy number variants at human salivary (AMY1) and pancreatic (AMY2) amylase genes. Hum Mol Genet. 2015 doi: 10.1093/hmg/ddv098. [DOI] [PMC free article] [PubMed] [Google Scholar]
- 19.Groot PC, et al. Evolution of the human alpha-amylase multigene family through unequal, homologous, and inter- and intrachromosomal crossovers. Genomics. 1990;8:97–105. doi: 10.1016/0888-7543(90)90230-r. [DOI] [PubMed] [Google Scholar]
- 20.Boettger LM, Handsaker RE, Zody MC, McCarroll SA. Structural haplotypes and recent evolution of the human 17q21.31 region. Nat Genet. 2012;44:881–885. doi: 10.1038/ng.2334. [DOI] [PMC free article] [PubMed] [Google Scholar]
- 21.Steinberg KM, et al. Structural diversity and African origin of the 17q21.31 inversion polymorphism. Nat Genet. 2012;44:872–880. doi: 10.1038/ng.2335. [DOI] [PMC free article] [PubMed] [Google Scholar]
- 22.Lupski JR, Stankiewicz P. Genomic disorders: molecular mechanisms for rearrangements and conveyed phenotypes. PLoS Genet. 2005;1:e49. doi: 10.1371/journal.pgen.0010049. [DOI] [PMC free article] [PubMed] [Google Scholar]
- 23.Leitsalu L, et al. Cohort Profile: Estonian Biobank of the Estonian Genome Center, University of Tartu. International journal of epidemiology. 2014 doi: 10.1093/ije/dyt268. [DOI] [PubMed] [Google Scholar]
- 24.Speliotes EK, et al. Association analyses of 249,796 individuals reveal 18 new loci associated with body mass index. Nat Genet. 2010;42:937–948. doi: 10.1038/ng.686. [DOI] [PMC free article] [PubMed] [Google Scholar]
- 25.Ferrucci L, et al. Subsystems contributing to the decline in ability to walk: bridging the gap between epidemiology and geriatric practice in the InCHIANTI study. Journal of the American Geriatrics Society. 2000;48:1618–1625. doi: 10.1111/j.1532-5415.2000.tb03873.x. [DOI] [PubMed] [Google Scholar]
- 26.Wellcome Trust Case Control Consortium. Genome-wide association study of 14,000 cases of seven common diseases and 3,000 shared controls. Nature. 2007;447:661–678. doi: 10.1038/nature05911. [DOI] [PMC free article] [PubMed] [Google Scholar]
- 27.Wellcome Trust Case Control Consortium et al. Genome-wide association study of CNVs in 16,000 cases of eight common diseases and 3,000 shared controls. Nature. 2010;464:713–720. doi: 10.1038/nature08979. [DOI] [PMC free article] [PubMed] [Google Scholar]
- 28.Tognon G, et al. Mediterranean diet, overweight and body composition in children from eight European countries: cross-sectional and prospective results from the IDEFICS study. Nutrition, metabolism, and cardiovascular diseases : NMCD. 2014;24:205–213. doi: 10.1016/j.numecd.2013.04.013. [DOI] [PubMed] [Google Scholar]
- 29.Mottus R, et al. Personality traits and eating habits in a large sample of Estonians. Health psychology : official journal of the Division of Health Psychology, American Psychological Association. 2012;31:806–814. doi: 10.1037/a0027041. [DOI] [PubMed] [Google Scholar]
- 30.Berndt SI, et al. Genome-wide meta-analysis identifies 11 new loci for anthropometric traits and provides insights into genetic architecture. Nat Genet. 2013;45:501–512. doi: 10.1038/ng.2606. [DOI] [PMC free article] [PubMed] [Google Scholar]
- 31.Mejia-Benitez MA, et al. Beneficial effect of a high number of copies of salivary amylase AMY1 gene on obesity risk in Mexican children. Diabetologia. 2015;58:290–294. doi: 10.1007/s00125-014-3441-3. [DOI] [PubMed] [Google Scholar]
- 32.Iskow RC, Gokcumen O, Lee C. Exploring the role of copy number variants in human adaptation. Trends Genet. 2012;28:245–257. doi: 10.1016/j.tig.2012.03.002. [DOI] [PMC free article] [PubMed] [Google Scholar]
- 33.Stankiewicz P, Lupski JR. Structural variation in the human genome and its role in disease. Annu Rev Med. 2010;61:437–455. doi: 10.1146/annurev-med-100708-204735. [DOI] [PubMed] [Google Scholar]
- 34.Zhang F, Gu W, Hurles ME, Lupski JR. Copy number variation in human health, disease, and evolution. Annu Rev Genomics Hum Genet. 2009;10:451–481. doi: 10.1146/annurev.genom.9.081307.164217. [DOI] [PMC free article] [PubMed] [Google Scholar]
- 35.Zeggini E, et al. Replication of genome-wide association signals in UK samples reveals risk loci for type 2 diabetes. Science. 2007;316:1336–1341. doi: 10.1126/science.1142364. [DOI] [PMC free article] [PubMed] [Google Scholar]
- 36.Scott LJ, et al. A genome-wide association study of type 2 diabetes in Finns detects multiple susceptibility variants. Science. 2007;316:1341–1345. doi: 10.1126/science.1142382. [DOI] [PMC free article] [PubMed] [Google Scholar]
- 37.Diabetes Genetics Initiative of Broad Institute of, H et al. Genome-wide association analysis identifies loci for type 2 diabetes and triglyceride levels. Science. 2007;316:1331–1336. doi: 10.1126/science.1142358. [DOI] [PubMed] [Google Scholar]
- 38.Heid IM, et al. Genetic architecture of the APM1 gene and its influence on adiponectin plasma levels and parameters of the metabolic syndrome in 1,727 healthy Caucasians. Diabetes. 2006;55:375–384. doi: 10.2337/diabetes.55.02.06.db05-0747. [DOI] [PubMed] [Google Scholar]
- 39.Melzer D, et al. A genome-wide association study identifies protein quantitative trait loci (pQTLs) PLoS Genet. 2008;4:e1000072. doi: 10.1371/journal.pgen.1000072. [DOI] [PMC free article] [PubMed] [Google Scholar]
- 40.Church DM, et al. Modernizing reference genome assemblies. PLoS Biol. 2011;9:e1001091. doi: 10.1371/journal.pbio.1001091. [DOI] [PMC free article] [PubMed] [Google Scholar]
- 41.Li H, Durbin R. Fast and accurate short read alignment with Burrows-Wheeler transform. Bioinformatics. 2009;25:1754–1760. doi: 10.1093/bioinformatics/btp324. [DOI] [PMC free article] [PubMed] [Google Scholar]
- 42.Koren A, et al. Differential relationship of DNA replication timing to different forms of human mutation and variation. Am J Hum Genet. 2012;91:1033–1040. doi: 10.1016/j.ajhg.2012.10.018. [DOI] [PMC free article] [PubMed] [Google Scholar]
- 43.Teague B, et al. High-resolution human genome structure by single-molecule analysis. Proc Natl Acad Sci U S A. 2010;107:10848–10853. doi: 10.1073/pnas.0914638107. [DOI] [PMC free article] [PubMed] [Google Scholar]
- 44.Hach F, et al. mrsFAST: a cache-oblivious algorithm for short-read mapping. Nat Methods. 2010;7:576–577. doi: 10.1038/nmeth0810-576. [DOI] [PMC free article] [PubMed] [Google Scholar]
- 45.Smit A, Hubley R, Green P. RepeatMasker Open-3.0. 1996-2010 < http://www.repeatmasker.or>.
- 46.Benson G. Tandem repeats finder: a program to analyze DNA sequences. Nucleic Acids Res. 1999;27:573–580. doi: 10.1093/nar/27.2.573. [DOI] [PMC free article] [PubMed] [Google Scholar]
- 47.Alkan C, et al. Personalized copy number and segmental duplication maps using next-generation sequencing. Nat Genet. 2009;41:1061–1067. doi: 10.1038/ng.437. [DOI] [PMC free article] [PubMed] [Google Scholar]
- 48.Browning SR, Browning BL. Rapid and accurate haplotype phasing and missing-data inference for whole-genome association studies by use of localized haplotype clustering. Am J Hum Genet. 2007;81:1084–1097. doi: 10.1086/521987. [DOI] [PMC free article] [PubMed] [Google Scholar]
- 49.Purcell S, Cherny SS, Sham PC. Genetic Power Calculator: design of linkage and association genetic mapping studies of complex traits. Bioinformatics. 2003;19:149–150. doi: 10.1093/bioinformatics/19.1.149. [DOI] [PubMed] [Google Scholar]
- 50.Purcell S, et al. PLINK: a tool set for whole-genome association and population-based linkage analyses. Am J Hum Genet. 2007;81:559–575. doi: 10.1086/519795. [DOI] [PMC free article] [PubMed] [Google Scholar]
- 51.R: A Language and Environment for Statistical Computing. 2012 [Google Scholar]
Associated Data
This section collects any data citations, data availability statements, or supplementary materials included in this article.