

LPS causes lysosome tubulation in macrophages and dendritic cells. The PI3K-Akt-mTOR pathway is necessary for LPS-induced lysosome tubulation, and mTOR is required for MHC-II presentation in dendritic cells. Evidence shows that mTOR may control lysosome tubulation by modulating microtubule motor activity through Arl8b.
Abstract
Macrophages and dendritic cells exposed to lipopolysaccharide (LPS) convert their lysosomes from small, punctate organelles into a network of tubules. Tubular lysosomes have been implicated in phagosome maturation, retention of fluid phase, and antigen presentation. There is a growing appreciation that lysosomes act as sensors of stress and the metabolic state of the cell through the kinase mTOR. Here we show that LPS stimulates mTOR and that mTOR is required for LPS-induced lysosome tubulation and secretion of major histocompatibility complex II in macrophages and dendritic cells. Specifically, we show that the canonical phosphatidylinositol 3-kinase–Akt–mTOR signaling pathway regulates LPS-induced lysosome tubulation independently of IRAK1/4 and TBK. Of note, we find that LPS treatment augmented the levels of membrane-associated Arl8b, a lysosomal GTPase required for tubulation that promotes kinesin-dependent lysosome movement to the cell periphery, in an mTOR-dependent manner. This suggests that mTOR may interface with the Arl8b-kinesin machinery. To further support this notion, we show that mTOR antagonists can block outward movement of lysosomes in cells treated with acetate but have no effect in retrograde movement upon acetate removal. Overall our work provides tantalizing evidence that mTOR plays a role in controlling lysosome morphology and trafficking by modulating microtubule-based motor activity in leukocytes.
INTRODUCTION
Lysosomes are vital organelles that harbor an acidic and enzyme-rich lumen capable of molecular digestion. Key membrane trafficking pathways such as endocytosis, phagocytosis, and autophagy rely on fusion with the lysosome for degradation of cargo (Luzio et al., 2007). In an immunological context, lysosomes and lysosome-related organelles play pivotal and diverse roles. For example, in professional phagocytes such as macrophages, lysosomes fuse with phagosomes to generate phagolysosomes to digest microbes and apoptotic bodies from host tissue; in antigen-presenting cells such as dendritic cells (DCs), the lysosome-like major histocompatibility complex class II (MHC-II) compartment (MIIC) processes and delivers antigen to the plasma membrane for T-cell recognition (Neefjes et al., 1990, 1999), and in cytotoxic lymphocytes, lytic granules are secreted to kill virally infected target cells (Burkhardt et al., 1990; Peters et al., 1991).
Lipopolysaccharide (LPS), a herald of infection, primes macrophages and DCs to undergo numerous phenotypic changes in anticipation of bacterial assault. One striking morphological change in response to LPS is the conversion of punctate lysosomes into highly dynamic tubular lysosomes (TLs; Barois et al., 2002; Chow et al., 2002; Vyas et al., 2007; Mrakovic et al., 2012). Although the exact function is unclear, TLs have been implicated in phagosome maturation (Harrison et al., 2003), fluid-phase retention (Swanson et al., 1985), and antigen presentation (Boes et al., 2002, 2003; Chow et al., 2002). We and others previously identified some of the molecular regulators of TL biogenesis (Swanson et al., 1987; Vyas et al., 2007; Mrakovic et al., 2012). Among these, microtubules appear to provide a scaffold along which the plus end–directed motor protein kinesin-1 and the minus end–directed motor dynein act in concert to “stretch” lysosomes, although this likely requires alterations in membrane trafficking as well. These motors link to lysosomes through the small GTPases Rab7 and Arl8b and their effectors; Rab7 recruits RILP and FYCO1 to respectively link to dynein and kinesin-1, whereas Arl8b links to kinesin-1 through its effector SKIP (Cantalupo et al., 2001; Jordens et al., 2001; Pankiv et al., 2010; Rosa-Ferreira and Munro, 2011; Mrakovic et al., 2012). However, it remains unclear how LPS-dependent signaling interfaces with the microtubule-dependent motors to modulate lysosome morphology and identity.
Innate immune cells respond to LPS through the Toll-like receptor 4 (TLR4). Typically, TLR4 activation triggers two major signaling pathways that lead to the production of inflammatory mediators. The MyD88-independent pathway recruits the TRIF adaptor protein to activate the kinases TBK1 and IKK, which in turn stimulate IRF3, leading to the production of type 1 interferons (Kawai et al., 1999, 2001; Yamamoto et al., 2002, 2003a, b; Fitzgerald et al., 2003). In comparison, the MyD88-dependent pathway signals through the adapter protein MyD88 to activate interleukin-1 receptor–associated kinase 1/4 (IRAK1/4) and TRAF6 (Suzuki et al., 2002; Burns et al., 2003). Ultimately, IκB is degraded and NF-κB is translocated to the nucleus to induce proinflammatory cytokine production (Beg et al., 1993). In addition, the MyD88 adaptor may also stimulate phosphatidylinositol 3-kinase (PI3K), which synthesizes phosphatidylinositol-3,4,5-trisphosphate (PtdIns(3,4,5)P3), a major signaling hub that coordinates cell survival and growth, inflammatory response, and metabolic activity (Stambolic et al., 1998; Cantley, 2002; Laird et al., 2009). One of the key effectors of PtdIns(3,4,5)P3 is the kinase Akt, which, when up-regulated, is a potent prosurvival signal (reviewed in Datta et al., 1999). Whereas Akt itself has a multitude of targets, it can phosphorylate the GTPase-activating proteins TSC1/2 to suppress the GTPase Rheb, which is required for up-regulating the kinase mechanistic target of rapamycin (mTOR) within the mTOR complex 1 (mTORC1); in other words, Akt activates mTORC1 (Inoki et al., 2002, 2003a). Ironically, Akt itself is fully activated when phosphorylated by mTOR within the mTOR complex 2 (mTORC2), forming a feedback loop. Thus mTOR is a major signaling hub that responds and integrates signals from nutrients and growth factors to govern the metabolic state of the cell. Despite all of this, other than a proposed requirement for MyD88 (Boes et al., 2003), little is known about the signaling players required for controlling lysosome tubulation in response to LPS.
Of interest, it is now appreciated that lysosomes sense stress and the metabolic state of the cell through mTOR (Sengupta et al., 2010; Settembre et al., 2012, 2013). Not only is mTOR localized to lysosomes as part of mTORC1, it is required for autophagic lysosome reformation, a process in which lysosomes are retrieved through tubular intermediates from autophagolysosomes at the end of autophagy (Yu et al., 2010). Moreover, mTOR is reported to be activated by LPS exposure in monocytes, macrophages, and dendritic cells (Ohtani et al., 2008; Weichhart et al., 2008; Schaeffer et al., 2011). Thus we speculated whether mTOR might help integrate LPS-mediated signaling with the cellular machinery responsible for lysosome morphology and trafficking. Indeed, in this report, we provide evidence that buttresses a key role for mTOR in mediating lysosome tubulation and antigen presentation, likely by regulating microtubule-based lysosomal transport.
RESULTS
TLR4-induced lysosome tubulation in macrophages requires PI3K
LPS exposure converts punctate lysosomes into a tubular network of lysosomes in macrophages and dendritic cells. Little is known about the downstream signaling pathway responsible for this, except that LPS fails to tubulate the MIIC in DCs from myd88−/− mice (Boes et al., 2003). To address this dearth of knowledge, we first used pharmacological antagonists targeting MyD88-dependent and MyD88-independent pathways downstream of TLR4 and assessed their effect on lysosome tubulation in RAW 264.7 macrophages. Cells were permitted to endocytose fluorescent dextran, followed by a 1-h chase to allow for accumulation of the fluorescence probe in lysosomes. Lysosome tubulation was stimulated by exposure of cells to 100 ng/ml LPS for 2 h and scored for tubulation by fluorescence microscopy.
Using this approach, we found that LPS exposure resulted in nearly 2.5-fold increase in lysosome tubulation compared with unstimulated cells (Figure 1A). Lysosome tubulation was significantly abated in cells pretreated with the MyD88 antagonistic Pepinh-MYD peptide but not with the control peptide (Figure 1, A and B). In contrast, inhibition of TBK1 with MRT67307 had little effect on LPS-induced lysosome tubulation (Figure 1, A and B). To ensure the efficacy of MRT67307, we demonstrated that this drug blocked the phosphorylation of IRF3, a substrate of TBK1, in response to LPS (Supplemental Figure S1A). Together, these results indicate that LPS-induced TL biogenesis proceeds through the MyD88 signaling branch downstream of TLR4 in macrophages.
FIGURE 1:
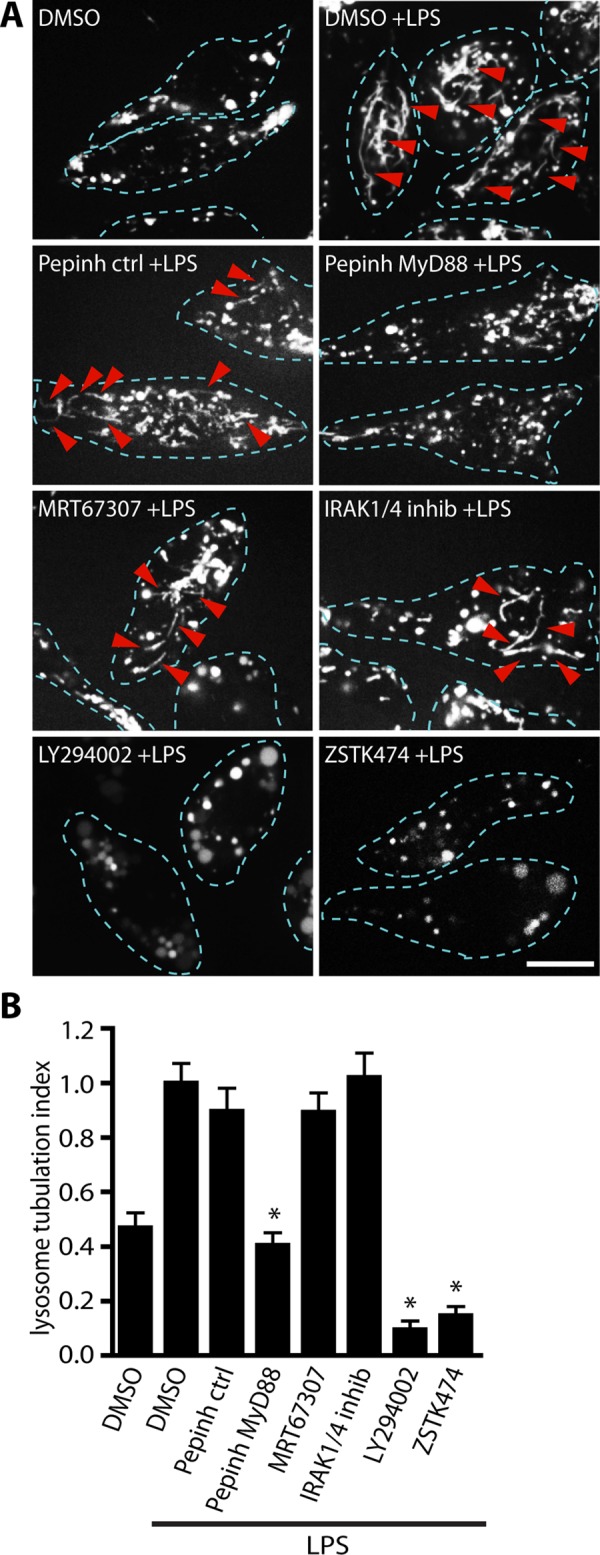
MyD88 and PI3K are required for LPS-induced lysosome tubulation in macrophages. (A) Lysosomes of RAW 264.7 macrophages labeled with Alexa 555–dextran. Cells were either treated with the vehicle DMSO alone as a control or pretreated for 20 min with DMSO, 5 μM IRAK1/4 inhibitor, 2 μM TBK1 inhibitor (MRT67307), 100 μM PI3K inhibitor (LY294002), or 1 μM class I PI3K inhibitor (ZSTK474) before stimulation with 100 ng/ml LPS for 2 h to induce lysosome tubulation. Alternatively, cells were incubated with Pepinh-ctrl (control peptide) or Pepinh-MYD (MyD88-inhibitory peptide) for 3 h before stimulation with LPS. LPS induces extensive tubulation but not in cells inhibited for MyD88 and PI3Ks. Dashed lines outline individual cells. Red arrowheads denote individual lysosome tubules. Scale bar, 10 μm. (B) Quantification of lysosome tubulation under conditions described in A. Mean ± SEM of three independent experiments based on 25–30 cells per condition per experiment. Data were statistically analyzed using a one-way ANOVA, followed by Tukey’s post hoc test. *p < 0.001, significant difference between LPS alone and cells pretreated with MyD88 inhibitory peptide and PI3K inhibitors.
MyD88 is reported to stimulate IRAK1/4 and PI3K after LPS treatment (Suzuki et al., 2002; Burns et al., 2003; Laird et al., 2009). Subsequently we used inhibitors of IRAK1/4 and PI3K to examine their role on TL formation. We found that inhibition of IRAK1/4 did not significantly affect TL formation in RAW macrophages, despite being able to block LPS-induced transcription of interleukin-6 (IL-6; Figure 1, A and B, and Supplemental Figure S1B), a cytokine expressed upon TLR stimulation of the IRAK1/4-NFκB pathway (Thomas et al., 1999; Suzuki et al., 2002). By comparison, TL formation in LPS-stimulated cells treated with LY294002, a general PI3K inhibitor, or with the class I PI3K inhibitor ZSTK474 strongly impaired TL biogenesis (Figure 1, A and B). Overall these data suggest that LPS signals through a TLR4–MyD88–class I PI3K pathway to induce lysosome tubulation.
The canonical PI3K-Akt pathway regulates LPS-induced lysosome tubulation
Activation of PI3K results in the production of PtdIns(3,4,5)P3 at the inner leaflet of the plasma membrane, which recruits the PH domain–containing protein Akt, leading to its activation (Bellacosa et al., 1998). Because inhibition of PI3K strongly abated TL biogenesis in response to LPS, we asked whether Akt played a role in lysosome tubulation. Before assessing the effects on lysosome tubulation, we first characterized the signaling pathway to ascertain that indeed LPS triggered the PI3K-Akt pathway in RAW cells. Indeed, LPS increased the level of Akt phosphorylated at S473, which serves as a readout for activation (Figure 2A). Of interest, S473 is modified by mTORC2, suggesting that LPS stimulates mTORC2 (Sarbassov et al., 2005). Second, we showed that Akt activation was independent of IRAK1/4 or TBK1 but required PI3K (Figure 2A) and Myd88 (Supplemental Figure S1C). Having shown this, we then showed that LPS-treated cells exposed to the Akt inhibitor Akti had a 70% reduction in lysosome tubulation relative to LPS-treated cells exposed to vehicle only (Figure 2, B and C). Overall this illustrates that Akt plays an essential role in lysosome tubulation.
FIGURE 2:

Akt is required for LPS-induced lysosome tubulation in macrophages. (A) Western blots of whole-cell lysates from RAW cells treated as indicated across lanes. LPS increases the levels of activated Akt (pAkt) in a PI3K-dependent manner but independently of IRAK1/4 and TBK1 activity. Total Akt was used as loading control. (B) Lysosomes of RAW 264.7 macrophages labeled with Alexa 555–dextran. Cells were treated with vehicle alone (DMSO) or pretreated for 20 min with DMSO or 5 μM Akt inhibitor (Akti) before 2-h LPS stimulation. Extensive lysosomal tubules appear upon LPS stimulation but not in cells inhibited for Akt. Dashed lines outline individual cells. Scale bar, 10 μm. (C) Quantification of lysosome tubulation under conditions described in B. Mean ± SEM of three independent experiments based on 25–30 cells per condition per experiment. Data were statistically analyzed using a one-way ANOVA, followed by Tukey’s post hoc test. *p < 0.0001, significant difference between LPS alone and cells inhibited for Akt.
mTOR is required for lysosome tubulation in macrophages
mTORC1 is a key effector of the PI3K-Akt pathway. Thus we next examined whether mTORC1 is involved in LPS-mediated lysosome tubulation. First, we assessed mTORC1 activation in response to LPS by probing the levels of S6K phosphorylated at T389, a canonical target of mTORC1 (Isotani et al., 1999; Saitoh et al., 2002). We demonstrated that LPS greatly enhanced the levels of phospho-S6K and that this is abolished by torin1, a potent and specific mTOR inhibitor, showing that S6K phosphorylation depends on mTOR (Figure 3A). Second, we showed that mTOR activation depends on PI3K but is independent of IRAK1/4 and TBK1, as expected (Figure 3B). Of greatest importance, pharmacological inhibition of mTOR with torin1 robustly impaired lysosome tubulation (Figure 3, C and D), with similar results obtained with other mTOR antagonists, including rapamycin, PP242, or WYE687 (Supplemental Figure S2A). Because rapamycin inhibits mTORC1 specifically, this suggests that mTORC1 is responsible for tubulation (Jacinto et al., 2004). However, because mTORC2 is also necessary for Akt activation, which then activates mTORC1, it is most likely that both mTOR complexes play a role in LPS-stimulated lysosome tubulation.
FIGURE 3:

mTOR is activated by LPS and required for lysosome tubulation in macrophages. (A) Western blots of whole-cell lysates from RAW cells treated as indicated across lanes. LPS treatment for 1 and 2 h enhances S6K phosphorylation (pS6K) relative to non–LPS-treated cells, and this is suppressed by torin1. Total S6K was used as loading control. (B) LPS-dependent increase in pS6K levels is dependent on PI3K but independent of IRAK1/4 and TBK activity. (C) Lysosomes of RAW 264.7 macrophages labeled with Alexa 555–dextran. Cells were treated with vehicle alone (DMSO) or pretreated for 20 min with DMSO or 100 nM torin1 before 2-h LPS stimulation. Extensive lysosomal tubules appear upon LPS stimulation but not in cells inhibited for mTOR. Dashed lines outline individual cells. Red arrowheads denote individual lysosome tubules. Scale bar, 10 μm. (D) Quantification of lysosome tubulation under conditions described in C. (E) Lysosomes labeled with Alexa 555–dextran in LPS-treated cells electroporated with nontargeting pool (siNTP) or mTOR-targeting siRNA oligonucleotides (simTOR). (F) Quantification of lysosome tubulation under conditions described in E. Data are mean ± SEM of four independent experiments containing 25–30 cells/condition. (G) Treatment of RAW cells with the AMPK activator A769662 blocks TL formation. (H) Quantification of lysosome tubulation under conditions described in G. Data are mean ± SEM of three independent experiments containing 25–30 cells/sample. For D, data were statistically tested using one-way ANOVA test, followed by Tukey’s test. For G and H, data were tested with a paired Student’s t test, *p < 0.0001. Arrowheads indicate TLs in micrographs. Scale bars, 10 μm.
To complement our pharmacological findings, we used small interfering RNA (siRNA)–mediated gene silencing against mTOR. A pool of four siRNA oligonucleotides against mouse mTOR was electroporated into RAW cells, which were then stimulated with LPS and scored for tubulation. mTOR-silenced cells expressed <40% of the mTOR protein levels relative to control cells (Supplemental Figure S2B). Of importance, lysosome tubulation was strongly hindered in mTOR-silenced cells relative to control cells treated with the nontargeting pool of siRNA oligonucleotides (Figure 3, E and F).
Finally, we inhibited mTOR function in a different and independent way to assess its role in TL biogenesis. The cellular energy sensor AMP-activated protein kinase (AMPK) is activated when the ATP:ADP ratio is low, leading to the arrest of anabolic processes and a shift to catabolic processes (reviewed in Hardie et al., 2012). Of note, the activation of AMPK is inversely related to the activation of mTOR, since active AMPK increases the activity of the mTOR repressor TSC1/2 and can phosphorylate a component of mTORC1, Raptor, to impair mTOR complex assembly and function (Inoki et al., 2003b; Gwinn et al., 2008). Therefore we used the AMPK agonist A769662 to activate AMPK and indirectly inhibit mTOR and then scored for lysosome tubulation. As with our findings with direct mTOR inhibition, this method also blocked mTOR activity (Supplemental Figure S2C) and impeded TL biogenesis in response to LPS (Figure 3, G and H).
The Akt-mTOR axis prolongs LPS-derived signaling in macrophages
After LPS exposure, the TLR4-MyD88 complexes are quickly internalized and trafficked to endosomes for inactivation (Husebye et al., 2006). This led to the question of whether the Akt-mTOR pathway might serve to sustain LPS-induced signaling after TLR4 degradation. To test this, we examined the kinetics of phospho-Akt and phospho-S6K to assess Akt and mTOR activation after LPS exposure. Note that both Akt and mTOR were not only significantly stimulated within 15 min of LPS exposure but also remained strongly up-regulated for at least 2 h (Figure 4A). We then asked whether the kinetics of lysosome tubulation correlated well with those of Akt and mTOR stimulation. Intriguingly, significant lysosome tubulation occurred within 30 min of LPS exposure and gradually increased over time (Figure 4, B and C). These results suggest that the Akt-mTOR axis might help sustain signaling after TLR4 internalization and degradation and help to reprogram various aspects of macrophages, including lysosome morphology and function. We next examined whether the role of mTOR on lysosome tubulation extended to dendritic cells as well.
FIGURE 4:

The Akt-mTOR pathway is activated early and maintained under LPS signaling and coincides with lysosome tubulation. (A) Western blots of RAW whole-cell lysates after LPS stimulation for the time points indicated across the top (in minutes). LPS stimulation caused phosphorylation of Akt and S6K as early as 15 min, increasing at 30 min and remaining for at least 2 h. (B) Lysosomes of RAW 264.7 macrophages labeled with Alexa 555–dextran. Cells were treated with LPS, and live-cell imaging was carried out at the time points indicated (in minutes). Dashed lines outline individual cells. Red arrowheads indicate lysosomal tubules. Scale bar, 10 μm. (C) Quantification of lysosome tubulation under conditions described in B. Data were statistically analyzed using a one-way ANOVA, followed by Tukey’s post hoc test. *p < 0.05, significant difference from 0-min condition.
mTOR controls lysosome/MIIC tubulation in primary dendritic cells
Primary dendritic cells convert their MIIC, a lysosome-related organelle, into long tubular structures after LPS stimulation, and this is proposed to aid antigen presentation in maturing DCs (Boes et al., 2002; Chow et al., 2002). To determine whether mTOR controls lysosome tubulation in DCs, we tested the findings from the RAW 264.7 cell line in primary mouse bone marrow–derived dendritic cells (BMDCs). To first confirm that the tubular MIIC and TLs are the same in BMDCs, we used BMDCs from MHC-II–green fluorescent protein (GFP)–expressing transgenic mice (Boes et al., 2002). These BMDCs were allowed to endocytose Alexa 555–coupled dextran and were chased for at least 1 h to label lysosomes. After LPS stimulation, cells were observed by live-cell imaging. Of importance, we observed numerous MHC-II-GFP–positive tubules that overwhelmingly colabeled with Alexa 555–coupled dextran, suggesting that the MIIC tubules are lysosomal in nature (Figure 5A).
FIGURE 5:

mTOR is required for MIIC tubulation in primary dendritic cells. (A) LPS-stimulated BMDCs from MHC-II-GFP mice labeled with Alexa 555–dextran. Merge shows intracellular colocalization of MHC-II and dextran. Insets highlight lysosomal tubules. (B) Western blot of whole-cell lysates from wild-type BMDCs. LPS treatment for 1 and 2 h increases the levels of phospho-S6K in a torin1-dependent manner, indicating that LPS activates mTOR. Total S6K was used as loading control. (C) Lysosomes of wild-type BMDCs labeled with Alexa 555–dextran. Cells were treated with vehicle alone (DMSO) or pretreated for 20 min with DMSO, 100 nM rapamycin, or 100 nM torin1, followed by 100 ng/ml LPS treatment for 2 h to induce lysosome tubulation. Both torin1 and rapamycin appeared to strongly reduce lysosome tubulation in BMDCs. (D) Quantification of lysosome tubulation under conditions described in C. Data are mean ± SEM of three independent experiments containing 25–30 cells per sample per experiment. Scale bars, 10 μm. Data were statistically analyzed using a one-way ANOVA, followed by Tukey’s post hoc test. *p < 0.0001, significant difference between LPS alone and cells exposed to rapamycin and torin1.
Second, we demonstrated that LPS treatment increased the levels of phospho-S6K in BMDCs by ∼90% at 1 and 2 h and that this was suppressed by torin1, suggesting that LPS stimulates mTOR in DCs as well (Figure 5B). Strikingly, LPS activation induced a 20-fold increase in lysosome tubulation in BMDCs, which is far more robust than in RAW cells (Figure 5, C and D). We then applied torin1 or rapamycin to block mTOR in BMDCs and observed a fivefold reduction in lysosome tubulation in LPS-treated BMDCs relative to LPS-only–treated BMDCs (Figure 5, C and D). Overall these results indicate that mTOR plays an important role in lysosome tubulation in innate immune cells.
Autophagy does not affect LPS-mediated lysosome tubulation
Inhibition of mTOR is a key trigger for autophagy (Beugnet et al., 2003). Therefore we wondered whether autophagy might impinge on LPS-stimulated lysosome tubulation in cells treated with torin1. To test this, we used siRNA-mediated silencing against ULK1, achieving >60% reduction in ULK1 expression (Figure 6A). To verify that this level of ULK1 silencing was sufficient to hinder autophagy, we examined the number of LC3 puncta that formed in cells by immunofluorescence microscopy, a well-characterized assay for autophagosome formation (Kimura et al., 2009). Using cells electroporated with nontargeting siRNA oligonucleotides, we showed that torin1 treatment led to a threefold increase in the number of LC3-positive structures relative to resting cells (Figure 6, B and C). Remarkably, ULK1-silenced cells strongly resisted the formation of LC3-positive puncta after incubation with torin1 (Figure 6, B and C), demonstrating that autophagy was suppressed. Nevertheless, ULK1-silenced cells were as proficient as cells transfected with the nontargeting oligonucleotides at tubulating their lysosomes in response to LPS (Figure 6, D and E). Of most importance, LPS-induced lysosome tubulation was suppressed by torin1 equally well between ULK1-silenced cells and cells transfected with the nontargeting oligonucleotides (Figure 6, D and E). This suggests that autophagy is not responsible for blocking lysosome tubulation in cells treated with torin1 but instead that mTOR activity is necessary for tubulation of lysosomes.
FIGURE 6:

Torin1 blocks lysosome tubulation in a manner independent of autophagy. (A) Relative mRNA expression of ULK1 in RAW cells upon siRNA-mediated silencing of ULK1 compared with control cells treated with nontargeting oligonucleotides (siNTP). Data are mean ± SEM of three independent experiments. (B) Immunofluorescence staining of RAW cells for LC3 in control (siNTP) and ULK1-silenced (siULK1) conditions. Torin1 exposure increases the number of LC3 puncta in control cells (siNTP), indicating activation of autophagy, but not in ULK1-silenced cells, suggesting that autophagy was inhibited. (C) Quantification of LC3 puncta in B. Data are mean ± SEM from three individual experiments in which 15–20 cells were analyzed per condition per experiment. *p < 0.0001, significant difference relative to cells treated with siNTP and without torin1. (D) Lysosomes in control (siNTP; top row) or siULK1-macrophages (bottom row) labeled with Alexa 555–dextran. Cells were either treated with vehicle (DMSO) alone or pretreated for 20 min with DMSO or 200 nM torin1, followed by 2-h LPS stimulation. Dashed lines outline individual cells. Red arrowheads indicate lysosomal tubules. (E) Quantification of lysosome tubulation in D. *Significant difference between control cells (siNTP) exposed to DMSO alone. Data were statistically analyzed using a two-way ANOVA, followed by Tukey’s post hoc test. Scale bars, 10 μm.
LPS increases the level of membrane-associated Arl8b in an mTOR-dependent manner
To begin to understand how mTOR might control lysosome tubulation, we assessed whether LPS and torin1 affect the Arl8b and Rab7 GTPases, which are essential for tubulation (Mrakovic et al., 2012). To do this, we transfected cells with Arl8b-GFP and RFP-Rab7 and quantified the membrane-to-cytosol fluorescence ratio in resting and LPS-treated cells. We found that LPS did not alter the relative levels of membrane-bound to cytosolic RFP-Rab7, nor did it alter the levels of RILPC33-GFP, a probe for GTP-bound Rab7 (Figure 7A). In contrast, incubating cells with LPS led to a significant increase in membrane-associated Arl8b relative to cytosolic Ar8b (Figure 7, B and C). Strikingly, torin1 pretreatment hindered this LPS-dependent enhancement of Arl8b-GFP recruitment to lysosomes, although it had little effect on basal Arl8b membrane association (Figure 7, B and C). We tried expressing Myc-tagged SKIP to assess changes in GTP-bound Arl8b levels, but ectopic expression of SKIP altered lysosome distribution, precluding this analysis. Overall we provide evidence that LPS stimulates Arl8b membrane association in an mTOR-dependent manner.
FIGURE 7:

LPS increases the levels of membrane-associated Arl8b in an mTOR-dependent manner. (A) Quantification of fluorescence micrographs of membrane-associated RFP-Rab7 (black bars) or RILPc33-GFP (gray bars). Quantification is a ratio of the fluorescence intensity on the membrane (defined by overlap with fluorescent lysosomal dextran) to the fluorescence intensity in the cytosol, normalized to cells unexposed to LPS. (B) Fluorescence micrographs of RAW cells expressing Arl8b-GFP and lysosomes labeled with Alexa 555–dextran. Scale bar, 10 μm. (C) Quantification of membrane-associated Arl8b-GFP signal as in A. Data are mean ± SEM. Data were statistically analyzed using a one-way ANOVA, followed by Tukey’s post hoc test. *p < 0.001, significant difference between DMSO plus LPS and DMSO conditions
mTOR is required for anterograde lysosomal transport
Arl8b helps to modulate lysosome motility and positioning by interfacing with microtubule-dependent kinesin motors. Thus we next examined the effect of LPS and mTOR on the microtubule system, which is believed to scaffold lysosome tubules (Swanson et al., 1987; Vyas et al., 2007). Using immunofluorescence against α-tubulin, we compared the general appearance of microtubules in cells with and without functional mTOR. We observed no apparent differences in microtubule organization in RAW cells between control, LPS, torin1, or torin1 plus LPS conditions (Supplemental Figure S3A). Because overall microtubule structure appeared to be unaffected, we sought to determine whether motor activity was altered upon mTOR suppression. To do this, we first tracked lysosome motility between resting and torin1-treated cells. However, manual tracking of random lysosomes did not detect a significant difference in lysosome motility between resting and torin1-treated cells (Supplemental Figure S3B). This suggests that mTOR does not regulate basal motility and positioning of lysosomes.
We next examined whether mTOR might control lysosome motility and/or positioning in stimulated cells. Although we could not examine LPS stimulation because tubulation confounded analysis, we used a previously established protocol developed by Heuser (1989) that did not cause morphological changes in lysosomes By lowering of the pH of the medium with acetate, lysosomes can be forced to the cell periphery, a process that requires kinesin and/or hindrance of dynein. This can be followed by a recovery period in regular medium, during which time lysosomes return to their more perinuclear and/or dispersed distribution. Thus we assessed the lysosomal distribution in cells under resting, acid, and recovery treatments in both mTOR-enabled and mTOR-inhibited cells. To do this, we applied a shell analysis in which the percentage of total lysosome signal was computed among three different regions of the cell: near the nucleus, in the cell periphery, and in the intermediate space between these two areas (schematic in Figure 8B, top). To further enhance analysis, we computed the lysosomal redistribution as a ratio of percentage of lysosome-associated signal in peripheral shell to percentage of lysosome-associated signal in perinuclear shell, with a high ratio indicating strong peripheral accumulation of lysosomes and a low ratio indicating poor peripheral redistribution.
FIGURE 8:

mTOR is required for anterograde lysosomal transport and antigen presentation. (A) Lysosomes of RAW cells were prelabeled with Alexa 555–dextran and treated for 2 h with either DMSO (top row) or 200 nM torin1 (bottom row). Cells were left sitting in regular Ringer’s medium (resting), treated with acetate Ringer’s for 20 min (acetate), or treated with acetate Ringer’s for 20 min followed by regular Ringer’s medium for 20 min (recovery). Scale bars, 10 μm. (B) Top, schematic of shell analysis in which three different regions (1, peripheral shell; 2, middle shell; 3, inner shell) were analyzed for percentage of lysosomes. Bottom, quantification of the ratio of percentage lysosomes in shell 1 to that in shell 3. Data are mean ± SEM of four independent experiments containing 10 cells per condition per sample. Data were statistically analyzed using a two-way ANOVA, followed by Tukey’s post hoc test. *p < 0.05, significant difference between control acetate and torin1–acetate treatments,. (C) Wild-type BMDCs were treated with DMSO for 5 h or DMSO plus LPS for 5 h or pretreated for 20 min with torin1 followed by LPS plus torin1 for 5 h. Cells were stained live and gated on the dendritic cell–specific marker CD11c. This subset was analyzed for cell-surface MHC-II using anti–MHC-II antibodies and flow cytometry. Data are mean fluorescence intensity ± SEM of seven independent experiments normalized to control (DMSO). We collected 10,000 events/condition. Data were statistically analyzed using a one-way ANOVA, followed by Tukey’s post hoc test. *p < 0.0001, significant difference between LPS and LPS plus torin1 treatments. (D) Western blot of whole-cell lysates from wild-type BMDCs treated as described in C, showing total MHC-II levels and GAPDH as loading control. (E) Quantification of three individual Western blots under conditions described in D and normalized to GAPDH. Data are mean ± SD.
Using this method, we found that resting cells with and without torin1 treatment had a similar ratio of 0.8 of peripheral-to-perinuclear lysosomes (Figure 8, A and B). In comparison, mTOR-enabled, acetate-treated cells exhibited a dramatic increase in the ratio of peripheral-to-perinuclear lysosomes of ∼3.8, showing that acetate redistributed lysosomes toward the cell periphery (Figure 8, A and B). Strikingly, acetate treatment in torin1-exposed cells had a significantly reduced ratio of 2.2 of peripheral-to-perinuclear lysosomes (Figure 8, A and B). This suggests that mTOR is required for the movement of lysosomes to the periphery in response to acetate exposure. In contrast, both mTOR-enabled and torin1-treated cells displayed a similar ratio of 0.8 of peripheral-to-perinuclear lysosomes during recovery from acid treatment, suggesting that mTOR was not necessary for lysosome movement toward the cell center (Figure 8, A and B). Thus we conclude that mTOR may play a role in mediating anterograde rather than retrograde lysosomal trafficking. By extension, we suggest that mTOR may exert its effects on lysosome tubulation by directly or indirectly up-regulating kinesin activity and/or downgrading dynein activity.
mTOR is required for antigen presentation in dendritic cells
Tubules containing MHC-II–GFP in DCs were observed to target the plasma membrane and the immune synapse between the host DC and the bound T-cell (Boes et al., 2002, 2003; Chow et al., 2002). From this, it was proposed that tubular MIIC intermediates are involved in delivering MHC-II to the plasma membrane for antigen presentation (Barois et al., 2002; Boes et al., 2002, 2003; Chow et al., 2002). We thus asked whether inhibition of mTOR, which impairs TL biogenesis, would also impair the levels of MHC-II in the plasma membrane of activated DCs. To assess this, we treated BMDCs from wild-type C57BL/6J mice with either LPS or LPS and torin1 and then stained for surface MHC-II. Using flow cytometry, we detected strong surface accumulation of MHC-II in the LPS condition, as expected (Figure 8C). In comparison, mTOR-inhibited cells consistently exhibited significantly reduced plasma membrane MHC-II after LPS stimulation (Figure 8C). Of note, total MHC-II levels were unchanged, as shown by Western blotting (Figure 8, D and E). These results indicate that mTOR, a regulator of the morphology and trafficking of lysosomes/MIIC, controls cell-surface delivery of MHC-II in BMDCs. Thus these results remain consistent with the proposed role for tubular MIIC in delivering antigens to the cell surface for antigen presentation.
DISCUSSION
Lysosome tubulation is a striking phenotype that macrophages and dendritic cells undergo upon exposure to certain stimuli such as LPS, fungal antigens, and phorbol esters (Swanson et al., 1985; Chow et al., 2002; Boes et al., 2003; Vyas et al., 2007; Mrakovic et al., 2012). Tubular lysosomes have been proposed to enhance fluid-phase retention in activated macrophages (Swanson et al., 1985), facilitate NOD2 signaling (Nakamura et al., 2014), remodel the phagosome (Harrison et al., 2003; Stephen et al., 2007; Mantegazza et al., 2014), and deliver MHC-II–antigen complexes to the surface of antigen-presenting cells (Boes et al., 2002, 2003; Chow et al., 2002). We also observed that tubular lysosomes are highly motile compared with punctate lysosomes, which may enhance trafficking rates to lysosomes (Mrakovic et al., 2012). Despite these proposed functions, there are very few known players involved in TL biogenesis and function, as well as an open question of how LPS-mediated signaling interfaces with molecular architects of lysosome identity.
Here we propose a model by which the TLR4-MyD88-PI3K-Akt-mTOR pathway helps trigger lysosome tubulation in response to LPS exposure in macrophages and DCs. This model relies on data showing that inhibition of MyD88, PI3K, and in particular the class I PI3K Akt and mTOR all lead to potent abatement of TL biogenesis. By contrast, inhibition of TBK and IRAK1/4 had no detectable effect on TL formation and is consistent with LPS-dependent activation of Akt and mTOR being independent of IRAK1/4 or TBK1. Of importance, our observations agree with previous work showing that MyD88, an essential adaptor protein that can link TLR4 to PI3K-Akt, is required for LPS-induced lysosome tubulation (Boes et al., 2003; Laird et al., 2009; Bauerfeld et al., 2012). Nevertheless, alternate signaling pathways that govern TL biogenesis might also exist. For instance, Vyas et al. (2007) demonstrated that the fungal pathogen Cryptococcus neoformans, which engages TLR2 and TLR4, can stimulate extensive tubulation of endolysosomes in MyD88-deficient dendritic cells, although it remains possible that this proceeds through the PI3K-Akt-mTOR module. In fact, we propose that mTOR may be a convergence point for other signals that induce tubulation, including phorbol esters and peptide–MHC-II engagement. Indeed, phorbol esters have been shown to up-regulate Akt and mTOR activity in various cells (Aeder et al., 2004; Hartmann et al., 2013; Ni et al., 2015).
Having shown that the PI3K-Akt-mTOR module is required for LPS-induced TL biogenesis, we next attempted to understand how mTOR might govern TL biogenesis. First, there was no apparent difference in the gross morphological pattern of microtubules or the basal motility of lysosomes in cells inhibited for mTOR. This suggests that mTOR does not control the overall microtubule architecture or the basal motor activity associated with lysosomes in macrophages or dendritic cells. In comparison, we provide evidence that mTOR can control stimulus-driven changes to lysosome motility and positioning. Although we could not assess the role of mTOR in LPS-induced lysosome distribution due to changes in lysosome morphology that confounded this analysis, we could examine the role of mTOR in pH-dependent lysosome positioning. As previously described, acidification of the cytosol forces lysosomes to the periphery, whereas subsequent neutralization permits lysosomes to rebound to the center of cells (Heuser, 1989). Strikingly, mTOR inhibition impaired acid-induced anterograde transport of lysosomes but did not affect retrograde transport. These observations provide evidence that mTOR can control microtubule-based motor activity, In particular, mTOR can stimulate kinesin and/or repress dynein activity upon certain stimuli. On the basis of this, we speculate that LPS uses mTOR signaling to coordinate kinesin and/or dynein activity to induce lysosome tubulation. This model would be consistent with previous work showing that MIIC tubules emanate from the cell center toward the cell periphery (Chow et al., 2002).
Although the exact mechanism by which mTOR might control microtubule motor activity is unknown, it is possible that mTOR directly regulates motor activity through phosphorylation of motor subunits and/or indirectly by modulating other factors that control or anchor motor proteins to lysosomes. In fact, there are several connections between the regulatory machineries of mTOR and microtubule-based motors. To illustrate: first, mTOR forms a complex with and phosphorylates CLIP-170, a plus-end microtubule-tracking protein, to control the development of dendrites and arborization of neurons in a PI3K-dependent process (Swiech et al., 2011); second, Arl8b and the Ragulator complex, which control activation of mTORC1 on lysosomes, appear to coordinate the delivery of focal adhesion components during cell adhesion (Schiefermeier et al., 2014); and third, and most tantalizing of all, a recent article identified an interaction between the Ragulator and a novel lysosome-localized protein complex called the BLOC-one-related complex (BORC) that recruits Arl8 to lysosomes and is required for anterograde lysosomal motility and tubulation (Pu et al., 2015). Given our observations showing that LPS enhances the levels of membrane-associated Arl8b in an mTOR-dependent manner, we propose a model in which LPS enhances Arl8b membrane association via mTOR stimulation of BORC. Somehow this process is then coordinated to drive lysosome tubulation and exocytosis of antigen–MHC-II complexes.
Overall mTOR is an ideal candidate to govern lysosomal properties, since it associates with the lysosomal membrane via mTORC1. Perhaps the best-characterized function for lysosome-associated mTOR is in its ability to integrate signals related to amino acid levels in the cell (Zoncu et al., 2011; Bar-Peled et al., 2012). Clearly, however, mTOR is subject to other signals, including those originating from the plasma membrane, such as growth factors and LPS, and it may serve to adapt lysosome function and properties in response to certain stimuli. mTOR may also control tubulation by mechanisms other than modulating microtubule motor activity. In particular, mTOR may control membrane fission and/or fusion. This is supported by a precedent, in which mTOR is proposed to control membrane fission from phagosomes containing apoptotic bodies (Krajcovic et al., 2013). In addition, we suspect that both mTORC1 and mTORC2 are important in transmitting LPS-mediated signaling into lysosome tubulation, since LPS enhanced the levels of both phospho-S473 in Akt, a target of mTORC2, and T389 in S6K, a target of mTORC1 (Saitoh et al., 2002; Sarbassov et al., 2005). It will be interesting to examine whether these two mTOR assemblies control distinct processes in the LPS response.
In conclusion, we propose a model in which LPS activates the MyD88-PI3K-Akt-mTOR pathway to coordinate microtubule-based motor activity, likely by up-regulating Arl8b-mediated kinesin activity and/or depressing dynein activity to help induce lysosome tubulation and secretion in macrophages and dendritic cells.
MATERIALS AND METHODS
Cell and tissue culture
The murine macrophage cell line RAW264.7 was grown in RPMI 1640 supplemented with 5% fetal bovine serum (Wisent, St. Bruno, Canada) at 37°C with 5% CO2. Bone marrow–derived dendritic cells were harvested from wild-type female 7- to 9-wk-old C57BL/6J mice (Jackson Laboratory, Bar Harbor, ME) or MHC-II-GFP knock-in mice (Boes et al., 2002) as previously described (Inaba et al., 1992) with minor modifications. Briefly, the bone marrow was flushed from leg bones with phosphate-buffered saline (PBS) using a 25G syringe, and red blood cells were lysed with a brief hypoosmotic treatment. Cells were plated at 2 × 10⁶/well in 4 ml of DMEM supplemented with 10% fetal bovine serum, 55 μM 2-mercaptoethanol, 10 ng/ml recombinant mouse granulocyte-macrophage colony-stimulating factor (PeproTech, Rocky Hill, NJ), and penicillin/streptomycin antibiotics (Pen/Strep from Wisent). Cells were washed every 2 d by replacing half of the medium with fresh medium. Experiments were conducted on days 7–9. All animals were used following institutional ethics requirements.
siRNA gene silencing
Gene silencing in RAW cells by siRNA oligonucleotides was conducted using electroporation. Briefly, RAW cells were grown to confluence in a T25 flask. Cells were then scraped, pelleted. and resuspended in 90 μl of Amaxa electroporation solution (Lonza, Basel, Switzerland) and 5 μl of a 20 μM SMARTpool set containing four siRNA oligonucleotides against mouse mTOR (gene ID, 56717; SMARTpool, open reading frame [ORF] L-065427-00-0005; Dharmacon, Lafayette, CO) or Ulk1 (gene ID, 22241; SMARTpool, ORF L-040155-00-0005; Dharmacon). As a control, a nontargeting SMARTpool siRNA oligonucleotide set was used (D-001810-10; Dharmacon). Optimal target knockdown was achieved when cells were electroporated with two pulses separated by 1 min with an Amaxa Nucleofector 1 Electroporator and incubated for 48 h to allow for gene silencing. Degree of silencing was detected by Western blot for mTOR or by quantitative real-time PCR for Ulk1.
Reagents and antibodies
Cells were treated with various compounds throughout this study, including 1 μM LY294002 (L9908), 2 μM MRT67307 (SML0702), 5 μM IRAK1/4 Inhibitor I (I5409), 1 μM rapamycin (R8781), and 200 nM PP242 (P0037), all from Sigma-Aldrich (St. Louis, MO); 200 nM torin1 (4247), 50 nM WYE687 (4282), 100 μM A769662 (3336) from Tocris (Bristol, United Kingdom); and 1 μM ZSTK474 (S1072) from Selleckchem (Houston, TX). Primary antibodies used for Western blotting were rabbit anti-mTOR, anti-S6K, anti-pS6KT389, anti-Akt, anti-pAktS473, and anti-pIRF3 (Cell Signaling, Danvers, MA), all used at 1:1000 dilution; mouse anti-glyceraldehyde-3-phosphate dehydrogenase (GAPDH) antibodies (Millipore, Billerica, MA), used at 1:10,000 dilution; and Bett rabbit polyclonal antibody against MHC-II β chain, which was a kind gift from Jeoung-Sook Shin (University of California, San Francisco, San Francisco, CA). For immunofluorescence, mouse anti–α-tubulin (Sigma-Aldrich) or anti-LC3 (Cell Signaling) antibodies were used at 1:1000. Secondary antibodies were horseradish peroxidase (HRP)–linked goat anti-rabbit or donkey anti-mouse and Alexa Fluor 488–linked donkey anti-mouse from Jackson ImmunoResearch (West Grove, PA). Cells were labeled for flow cytometry with hamster anti-CD11c and rat anti–MHC-II primary antibodies from BD PharMingen (San Jose, CA), followed by Dylight 649–linked donkey anti-hamster and Alexa Fluor 488–linked donkey anti-rat from Jackson ImmunoResearch. MyD88 inhibitory peptide (Pepinh-MYD) and control peptide (Pepinh-ctrl) were from InvivoGen (tlrl-pimyd; San Diego, CA).
Quantitative real-time PCR
Cells were lysed, and total RNA was extracted using the GeneJET RNA Purification Kit (K0731; Thermo Scientific, Waltham, MA). Equal amounts of RNA from all conditions were loaded as template for generation of cDNA by reverse transcription PCR using the SuperScript VILO cDNA synthesis kit (11754050; Invitrogen, Carlsbad, CA). cDNA was diluted 1:100, and quantitative PCR was conducted using the TaqMan system (Life Technologies, Carlsbad, CA) on a Step One Plus Real-Time PCR thermal cycler (Applied Biosystems, Foster City, CA) with Step One software (version 2.2.2; Applied Biosystems). The TaqMan gene expression assays for the reference gene Abt1 (4331182/Mm00803824; Life Technologies) and target genes Ulk1 (4331182/Mm00437238; Life Technologies) and IL-6 (4331182/Mm00446190; Life Technologies) were duplexed in triplicate, and the TaqMan Fast Advanced Master Mix (4444963) was used. Target gene expression was determined by relative quantification (ΔΔCt method) to the Abt1 reference gene and the control sample (nontargeting oligonucleotides for Ulk1 gene silencing or LPS for IL-6 expression assays).
SDS–PAGE, Western blotting, and immunofluorescence
Total cell lysates were prepared by resuspending and homogenizing cells in lysis buffer consisting of protease (Complete, mini, EDTA-free) and phosphatase (PhosSTOP) inhibitor cocktail tablets from Roche (Indianapolis, IN) dissolved in PBS plus 0.1% Triton X-100. Cell lysates were cleared by centrifugation for 10 min at 18,000 × g. The supernatant was then mixed with 2× Laemmli sample buffer (Bio-Rad, Hercules, CA) and boiled for 5 min. Lysates were then loaded and separated in a 12% SDS–PAGE and transferred onto a polyvinylidene fluoride membrane (Bio-Rad, Hercules, CA). The membranes were incubated with primary antibodies, followed by HRP-linked secondary antibodies in Tris-buffered saline plus 0.1% Tween-20 containing 5% nonfat milk or bovine serum albumin (BSA; BioShop Canada, Burlington, ON), followed by enhanced chemiluminescence detection using the Amersham ECL Western Blotting Detection Reagent and high-performance chemiluminescence film from GE Healthcare (Chalfont St Giles, United Kingdom). Western blots were quantified using the software program ImageStudio (version 3.1.4; LI-COR, Lincoln, NE).
To visualize microtubules, immunostaining was conducted by briefly washing cells in PBS on ice and fixing cells with 4% paraformaldehyde for 20 min. Cells were washed in 0.5% BSA/PBS, permeabilized with 0.1% Triton X-100 in PBS for 5 min, and washed again with BSA/PBS. Staining with primary antibodies was conducted at room temperature for 0.5 h. Cells were washed with BSA/PBS, incubated with secondary antibodies for 1 h, and washed a final time before mounting coverslips with Dako fluorescent mounting medium.
Labeling of lysosomes and tubulation assays
To visualize lysosomes, cells were pulsed with 100 μg/ml dextran labeled with Alexa Fluor 555 (Invitrogen) for 0.5 h, followed by at least 1-h chase in dextran-free medium to ensure accumulation of fluorescence signal in lysosomes. After the chase, cells were treated with 100 ng/ml LPS (Salmonella minnesota serotype minnesota Re 595; Sigma-Aldrich) for 2 h to induce lysosome tubulation, or an equivalent volume of PBS was used as control. When inhibitors were used, cells were pretreated with compounds at the concentrations indicated for 20 min before LPS addition for 2 h, or an equivalent volume of dimethyl sulfoxide (DMSO) was used as control, followed by LPS treatment. Cells were imaged live after treatments, and LPS, inhibitors, DMSO, and PBS were maintained in the medium during imaging. TLs were quantified manually by counting all lysosomal tubules that were ≥4 μm in length. Finally, and because of significant variation in the actual number of tubules from day to day, we developed a tubulation index by which the number of tubules in any given condition within a specific day was normalized against number of tubules found in cells treated with LPS for 2 h. For the kinetics of lysosome tubulation, cells were treated with 100 ng/ml LPS and imaged live at various time points.
Lysosome positioning assays
Lysosomes of RAW 264.7 cells were labeled with dextran, and cells were either left untreated or treated with 200 nM torin1 for 1 h. Cells were either kept in regular Ringer’s medium (pH 7.2) for 20 min, acetate Ringer’s (pH 6.8) for 20 min, or acetate Ringer’s for 20 min, followed by regular Ringer’s medium for 20 min (Ringer’s and acetate Ringer’s solutions were prepared as before; Heuser, 1989). Cells were briefly washed in PBS, fixed in 4% paraformaldehyde, and mounted onto glass slides with Dako fluorescent mounting medium. Cells were imaged by confocal microscopy, and z-stacks were acquired. Lysosomal positioning was quantified using ImageJ software (National Institutes of Health, Bethesda, MD). Briefly, z-stacks were collapsed to give an extended view of all lysosomes in cells. Each cell was outlined manually to generate a region of interest (shell), and the same shell was reduced in size by 15-pixel iterations to produce three shells in total per cell. Thresholding for lysosomal signal was conducted manually, and the lysosomal area was computed in each shell and normalized to shell area.
Fluorescence microscopy
Cell images were acquired using a Quorum Wave-FX spinning disk confocal microscope (Quorum Technologies, Guelph, ON, Canada) based on a Zeiss Axiovert 200M fitted with a Yokogawa CSU10 spinning-disk head and a back-thinned electron multiplier camera (C9100-13 ImagEM; Hamamatsu, Hamamatsu City, Japan). Imaging was conducted using a 63× oil immersion objective. During live-cell microscopy, cells were kept in RPMI 1640 medium (Wisent) supplemented with 5% fetal bovine serum and buffered with 4-(2-hydroxyethyl)-1-piperazineethanesulfonic acid, and a 37°C heated stage was used. Images were acquired with Volocity software (version 6.3; PerkinElmer, Woodbridge, ON, Canada). Image processing was done with CS3 Adobe Photoshop (version 10.0) and Illustrator (version 13.0.0).
Imaging quantification of LC3, RFP-Rab7, and Arl8b-GFP
To determine whether Ulk1 silencing affected autophagy, control and Ulk1-silenced cells were either untreated or treated with torin1 for 2 h. Immunofluorescence against LC3 was conducted as described, and images of cells were acquired (z-stacks) by spinning-disk confocal microscopy. Cells were analyzed for average number of LC3 puncta, representing autophagosomes. Briefly, by use of ImageJ software (1.46r), z-stacks were collapsed to provide an extended view of each field, and individual cells were cropped. A manual threshold was applied to all cells to exclude all cytosolic signal, which did not appear punctate. Using the Analyze Particles tool, the count was obtained, which identified the number of LC3 puncta. This was done for each cell for each condition (at least 15 cells per condition across two experiments).
For quantification of membrane-to-cytosol distribution of Arl8b and Rab7, cells were transfected with GFP-Arl8b, RFP-Rab7, and Rilpc33-GFP plasmids using FuGENE HD (Promega, Madison, WI) as per manufacturer’s instructions. After each treatment, live-cell imaging with spinning-disk microscopy was performed. Subsequently each image was analyzed using ImageJ by manually applying a threshold outlining only the membrane-bound fluorescence (punctae), creating a mask. The mean fluorescence intensity under this mask was then subjected to Analyze Particle function, followed by background subtraction. Next the mean intensity of the cytosol was obtained by drawing regions of interest in the cytosolic pool, followed by background subtraction. The average ratio of membrane-bound to cytosolic fluorescence intensity was then calculated for each treatment.
Flow cytometry
BMDCs were washed in 0.5% BSA/PBS three times and incubated on ice for 30 min with primary antibodies (1:100). Cells were washed twice with 0.5% BSA/PBS and incubated on ice for 20 min with secondary antibodies (1:50). Cells were washed with BSA/PBS then fixed in 2% paraformaldehyde in PBS for 20 min. Finally, cells were washed in PBS and stored on ice until analyzed. Flow cytometry was performed at the University of Toronto Flow Cytometry facility on an LSRII flow cytometer (BD Biosciences, Mississauga, ON, Canada), and analysis was conducted using FlowJo software (Tree Star, Ashland, OR).
Statistical analyses
All experiments were repeated independently at least three times. Measurements of lysosomal tubulation across various conditions were subject to one-way analysis of variance (ANOVA) with Tukey’s post hoc test. Statistical analysis between experimental conditions and control conditions was done using a Student’s t test. A p < 0.05 was considered significant. Data are presented as mean ± SEM.
Supplementary Material
Acknowledgments
We thank Sergio Grinstein (Hospital for Sick Children, Toronto, Canada) for numerous discussions about this work. In addition, we acknowledge the laboratory of Hidde Ploegh (Massachusetts Institute of Technology, Cambridge, MA), where the MHC-II–GFP knock-in mice were originally generated. This work was funded by an Operating Grant from the Canadian Institutes of Health Research to R.J.B. A.S. was supported by an Ontario Graduate Scholarship.
Abbreviations used:
- BMDC
bone marrow–derived dendritic cell
- DC
dendritic cell
- LPS
lipopolysaccharide
- MHC-II
major histocompatibility complex class II
- MIIC
MHC-II compartment
- mTOR
mechanistic target of rapamycin
- PI3K
phosphatidylinositol 3-kinase
- PtdIns(3,4,5)P3
phosphatidylinositol-3,4,5-trisphosphate
- TL
tubular lysosome.
Footnotes
This article was published online ahead of print in MBoC in Press (http://www.molbiolcell.org/cgi/doi/10.1091/mbc.E15-05-0272) on November 18, 2015.
REFERENCES
- Aeder SE, Martin PM, Soh J-W, Hussaini IM. PKC-eta mediates glioblastoma cell proliferation through the Akt and mTOR signaling pathways. Oncogene. 2004;23:9062–9069. doi: 10.1038/sj.onc.1208093. [DOI] [PubMed] [Google Scholar]
- Barois N, de Saint-Vis B, Lebecque S, Geuze HJ, Kleijmeer MJ. MHC class II compartments in human dendritic cells undergo profound structural changes upon activation. Traffic. 2002;3:894–905. doi: 10.1034/j.1600-0854.2002.31205.x. [DOI] [PubMed] [Google Scholar]
- Bar-Peled L, Schweitzer LD, Zoncu R, Sabatini DM. Ragulator is a GEF for the rag GTPases that signal amino acid levels to mTORC1. Cell. 2012;150:1196–1208. doi: 10.1016/j.cell.2012.07.032. [DOI] [PMC free article] [PubMed] [Google Scholar]
- Bauerfeld CP, Rastogi R, Pirockinaite G, Lee I, Hüttemann M, Monks B, Birnbaum MJ, Franchi L, Nuñez G, Samavati L. TLR4-mediated AKT activation is MyD88/TRIF dependent and critical for induction of oxidative phosphorylation and mitochondrial transcription factor A in murine macrophages. J Immunol. 2012;188:2847–2857. doi: 10.4049/jimmunol.1102157. [DOI] [PMC free article] [PubMed] [Google Scholar]
- Beg AA, Finco TS, Nantermet P V, Baldwin AS. Tumor necrosis factor and interleukin-1 lead to phosphorylation and loss of I kappa B alpha: a mechanism for NF-kappa B activation. Mol Cell Biol. 1993;13:3301–3310. doi: 10.1128/mcb.13.6.3301. [DOI] [PMC free article] [PubMed] [Google Scholar]
- Bellacosa A, Chan TO, Ahmed NN, Datta K, Malstrom S, Stokoe D, McCormick F, Feng J, Tsichlis P. Akt activation by growth factors is a multiple-step process: the role of the PH domain. Oncogene. 1998;17:313–325. doi: 10.1038/sj.onc.1201947. [DOI] [PubMed] [Google Scholar]
- Beugnet A, Tee AR, Taylor PM, Proud CG. Regulation of targets of mTOR (mammalian target of rapamycin) signalling by intracellular amino acid availability. Biochem J. 2003;372:555–566. doi: 10.1042/BJ20021266. [DOI] [PMC free article] [PubMed] [Google Scholar]
- Boes M, Bertho N, Cerny J, Op den Brouw M, Kirchhausen T, Ploegh H. T cells induce extended class II MHC compartments in dendritic cells in a Toll-like receptor-dependent manner. J Immunol. 2003;171:4081–4088. doi: 10.4049/jimmunol.171.8.4081. [DOI] [PubMed] [Google Scholar]
- Boes M, Cerny J, Massol R, Op den Brouw M, Kirchhausen T, Chen J, Ploegh HL. T-cell engagement of dendritic cells rapidly rearranges MHC class II transport. Nature. 2002;418:983–988. doi: 10.1038/nature01004. [DOI] [PubMed] [Google Scholar]
- Burkhardt JK, Hester S, Lapham CK, Argon Y. The lytic granules of natural killer cells are dual-function organelles combining secretory and pre-lysosomal compartments. J Cell Biol. 1990;111:2327–2340. doi: 10.1083/jcb.111.6.2327. [DOI] [PMC free article] [PubMed] [Google Scholar]
- Burns K, Janssens S, Brissoni B, Olivos N, Beyaert R, Tschopp J. Inhibition of interleukin 1 receptor/Toll-like receptor signaling through the alternatively spliced, short form of MyD88 is due to its failure to recruit IRAK-4. J Exp Med. 2003;197:263–268. doi: 10.1084/jem.20021790. [DOI] [PMC free article] [PubMed] [Google Scholar]
- Cantalupo G, Alifano P, Roberti V, Bruni CB, Bucci C. Rab-interacting lysosomal protein (RILP): the Rab7 effector required for transport to lysosomes. EMBO J. 2001;20:683–693. doi: 10.1093/emboj/20.4.683. [DOI] [PMC free article] [PubMed] [Google Scholar]
- Cantley LC. The phosphoinositide 3-kinase pathway. Science. 2002;296:1655–1657. doi: 10.1126/science.296.5573.1655. [DOI] [PubMed] [Google Scholar]
- Chow A, Toomre D, Garrett W, Mellman I. Dendritic cell maturation triggers retrograde MHC class II transport from lysosomes to the plasma membrane. Nature. 2002;418:988–994. doi: 10.1038/nature01006. [DOI] [PubMed] [Google Scholar]
- Datta SR, Brunet A, Greenberg ME. Cellular survival: a play in three Akts. Genes Dev. 1999;13:2905–2927. doi: 10.1101/gad.13.22.2905. [DOI] [PubMed] [Google Scholar]
- Fitzgerald KA, Rowe DC, Barnes BJ, Caffrey DR, Visintin A, Latz E, Monks B, Pitha PM, Golenbock DT. LPS-TLR4 signaling to IRF-3/7 and NF-kappaB involves the toll adapters TRAM and TRIF. J Exp Med. 2003;198:1043–1055. doi: 10.1084/jem.20031023. [DOI] [PMC free article] [PubMed] [Google Scholar]
- Gwinn DM, Shackelford DB, Egan DF, Mihaylova MM, Mery A, Vasquez DS, Turk BE, Shaw RJ. AMPK phosphorylation of raptor mediates a metabolic checkpoint. Mol Cell. 2008;30:214–226. doi: 10.1016/j.molcel.2008.03.003. [DOI] [PMC free article] [PubMed] [Google Scholar]
- Hardie DG, Ross FA, Hawley SA. AMPK: a nutrient and energy sensor that maintains energy homeostasis. Nat Rev Mol Cell Biol. 2012;13:251–262. doi: 10.1038/nrm3311. [DOI] [PMC free article] [PubMed] [Google Scholar]
- Harrison RE, Bucci C, Vieira O V, Schroer TA, Grinstein S. Phagosomes fuse with late endosomes and/or lysosomes by extension of membrane protrusions along microtubules: role of Rab7 and RILP. Mol Cell Biol. 2003;23:6494–6506. doi: 10.1128/MCB.23.18.6494-6506.2003. [DOI] [PMC free article] [PubMed] [Google Scholar]
- Hartmann B, He X, Keller F, Fischereder M, Guba M, Schmid H. Development of a sensitive phospho-p70 S6 kinase ELISA to quantify mTOR proliferation signal inhibition. Ther Drug Monit. 2013;35:233–239. doi: 10.1097/FTD.0b013e3182804c9b. [DOI] [PubMed] [Google Scholar]
- Heuser J. Changes in lysosome shape and distribution correlated with changes in cytoplasmic pH. J Cell Biol. 1989;108:855–864. doi: 10.1083/jcb.108.3.855. [DOI] [PMC free article] [PubMed] [Google Scholar]
- Husebye H, Halaas Ø, Stenmark H, Tunheim G, Sandanger Ø, Bogen B, Brech A, Latz E, Espevik T. Endocytic pathways regulate Toll-like receptor 4 signaling and link innate and adaptive immunity. EMBO J. 2006;25:683–692. doi: 10.1038/sj.emboj.7600991. [DOI] [PMC free article] [PubMed] [Google Scholar]
- Inaba K, Inaba M, Romani N, Aya H, Deguchi M, Ikehara S, Muramatsu S, Steinman RM. Generation of large numbers of dendritic cells from mouse bone marrow cultures supplemented with granulocyte/macrophage colony-stimulating factor. J Exp Med. 1992;176:1693–1702. doi: 10.1084/jem.176.6.1693. [DOI] [PMC free article] [PubMed] [Google Scholar]
- Inoki K, Li Y, Xu T, Guan KL. Rheb GTpase is a direct target of TSC2 GAP activity and regulates mTOR signaling. Genes Dev. 2003a;17:1829–1834. doi: 10.1101/gad.1110003. [DOI] [PMC free article] [PubMed] [Google Scholar]
- Inoki K, Li Y, Zhu T, Wu J, Guan K-L. TSC2 is phosphorylated and inhibited by Akt and suppresses mTOR signalling. Nat Cell Biol. 2002;4:648–657. doi: 10.1038/ncb839. [DOI] [PubMed] [Google Scholar]
- Inoki K, Zhu T, Guan K-L. TSC2 mediates cellular energy response to control cell growth and survival. Cell. 2003b;115:577–590. doi: 10.1016/s0092-8674(03)00929-2. [DOI] [PubMed] [Google Scholar]
- Isotani S, Hara K, Tokunaga C, Inoue H, Avruch J, Yonezawa K. Immunopurified mammalian target of rapamycin phosphorylates and activates p70 S6 kinase a in vitro. J Biol Chem. 1999;274:34493–34498. doi: 10.1074/jbc.274.48.34493. [DOI] [PubMed] [Google Scholar]
- Jacinto E, Loewith R, Schmidt A, Lin S, Rüegg MA, Hall A, Hall MN. Mammalian TOR complex 2 controls the actin cytoskeleton and is rapamycin insensitive. Nat Cell Biol. 2004;6:1122–1128. doi: 10.1038/ncb1183. [DOI] [PubMed] [Google Scholar]
- Jordens I, Fernandez-Borja M, Marsman M, Dusseljee S, Janssen L, Calafat J, Janssen H, Wubbolts R, Neefjes J. The Rab7 effector protein RILP controls lysosomal transport by inducing the recruitment of dynein-dynactin motors. Curr Biol. 2001;11:1680–1685. doi: 10.1016/s0960-9822(01)00531-0. [DOI] [PubMed] [Google Scholar]
- Kawai T, Adachi O, Ogawa T, Takeda K, Akira S. Unresponsiveness of MyD88-deficient mice to endotoxin. Immunity. 1999;11:115–122. doi: 10.1016/s1074-7613(00)80086-2. [DOI] [PubMed] [Google Scholar]
- Kawai T, Takeuchi O, Fujita T, Inoue J, Mühlradt PF, Sato S, Hoshino K, Akira S. Lipopolysaccharide stimulates the MyD88-independent pathway and results in activation of IFN-regulatory factor 3 and the expression of a subset of lipopolysaccharide-inducible genes. J Immunol. 2001;167:5887–5894. doi: 10.4049/jimmunol.167.10.5887. [DOI] [PubMed] [Google Scholar]
- Kimura S, Fujita N, Noda T, Yoshimori T. Monitoring autophagy in mammalian cultured cells through the dynamics of LC3. Methods Enzymol. 2009;452:1–12. doi: 10.1016/S0076-6879(08)03601-X. [DOI] [PubMed] [Google Scholar]
- Krajcovic M, Krishna S, Akkari L, Joyce JA, Overholtzer M. mTOR regulates phagosome and entotic vacuole fission. Mol Biol Cell. 2013;24:3736–3745. doi: 10.1091/mbc.E13-07-0408. [DOI] [PMC free article] [PubMed] [Google Scholar]
- Laird MHW, Rhee SH, Perkins DJ, Medvedev AE, Piao W, Fenton MJ, Vogel SN. TLR4/MyD88/PI3K interactions regulate TLR4 signaling. J Leukoc Biol. 2009;85:966–977. doi: 10.1189/jlb.1208763. [DOI] [PMC free article] [PubMed] [Google Scholar]
- Luzio JP, Pryor PR, Bright NA. Lysosomes: fusion and function. Nat Rev Mol Cell Biol. 2007;8:622–632. doi: 10.1038/nrm2217. [DOI] [PubMed] [Google Scholar]
- Mantegazza AR, Zajac AL, Twelvetrees A, Holzbaur ELF, Amigorena S. TLR-dependent phagosome tubulation in dendritic cells promotes phagosome cross-talk to optimize MHC-II antigen presentation. Proc Natl Acad Sci USA. 2014;111:15508–15513. doi: 10.1073/pnas.1412998111. [DOI] [PMC free article] [PubMed] [Google Scholar]
- Mrakovic A, Kay JG, Furuya W, Brumell JH, Botelho RJ. Rab7 and Arl8 GTPases are necessary for lysosome tubulation in macrophages. Traffic. 2012;13:1667–1679. doi: 10.1111/tra.12003. [DOI] [PubMed] [Google Scholar]
- Nakamura N, Lill JR, Phung Q, Jiang Z, Bakalarski C, de Mazière A, Klumperman J, Schlatter M, Delamarre L, Mellman I. Endosomes are specialized platforms for bacterial sensing and NOD2 signalling. Nature. 2014;509:240–244. doi: 10.1038/nature13133. [DOI] [PubMed] [Google Scholar]
- Neefjes J. CIIV, MIIC and other compartments for MHC class II loading. Eur J Immunol. 1999;29:1421–1425. doi: 10.1002/(SICI)1521-4141(199905)29:05<1421::AID-IMMU1421>3.0.CO;2-C. [DOI] [PubMed] [Google Scholar]
- Neefjes JJ, Stollorz V, Peters PJ, Geuze HJ, Ploegh HL. The biosynthetic pathway of MHC class II but not class I molecules intersects the endocytic route. Cell. 1990;61:171–183. doi: 10.1016/0092-8674(90)90224-3. [DOI] [PubMed] [Google Scholar]
- Ni Y, Wang L, Zhang J, Pang Z, Liu Q, Du J. PKD1 is downregulated in non-small cell lung cancer and mediates the feedback inhibition of mTORC1-S6K1 axis in response to phorbol ester. Int J Biochem Cell Biol. 2015;60:34–42. doi: 10.1016/j.biocel.2014.12.018. [DOI] [PubMed] [Google Scholar]
- Ohtani M, Nagai S, Kondo S, Mizuno S, Nakamura K, Tanabe M, Takeuchi T, Matsuda S, Koyasu S. Mammalian target of rapamycin and glycogen synthase kinase 3 differentially regulate lipopolysaccharide-induced interleukin-12 production in dendritic cells. Blood. 2008;112:635–643. doi: 10.1182/blood-2008-02-137430. [DOI] [PMC free article] [PubMed] [Google Scholar]
- Pankiv S, Alemu EA, Brech A, Bruun JA, Lamark T, Øvervatn A, Bjørkøy G, Johansen T. FYCO1 is a Rab7 effector that binds to LC3 and PI3P to mediate microtubule plus end-directed vesicle transport. J Cell Biol. 2010;188:253–269. doi: 10.1083/jcb.200907015. [DOI] [PMC free article] [PubMed] [Google Scholar]
- Peters PJ, Borst J, Oorschot V, Fukuda M, Krähenbühl O, Tschopp J, Slot JW, Geuze HJ. Cytotoxic T lymphocyte granules are secretory lysosomes, containing both perforin and granzymes. J Exp Med. 1991;173:1099–1109. doi: 10.1084/jem.173.5.1099. [DOI] [PMC free article] [PubMed] [Google Scholar]
- Pu J, Schindler C, Jia R, Jarnik M, Backlund P, Bonifacino JS. BORC, a multisubunit complex that regulates lysosome positioning. Dev Cell. 2015;33:176–188. doi: 10.1016/j.devcel.2015.02.011. [DOI] [PMC free article] [PubMed] [Google Scholar]
- Rosa-Ferreira C, Munro S. Arl8 and SKIP act together to link lysosomes to kinesin-1. Dev Cell. 2011;21:1171–1178. doi: 10.1016/j.devcel.2011.10.007. [DOI] [PMC free article] [PubMed] [Google Scholar]
- Saitoh M, Pullen N, Brennan P, Cantrell D, Dennis PB, Thomas G. Regulation of an activated S6 kinase 1 variant reveals a novel mammalian target of rapamycin phosphorylation site. J Biol Chem. 2002;277:20104–20112. doi: 10.1074/jbc.M201745200. [DOI] [PubMed] [Google Scholar]
- Sarbassov DD, Guertin DA, Ali SM, Sabatini DM. Phosphorylation and regulation of Akt/PKB by the rictor-mTOR complex. Science. 2005;307:1098–1101. doi: 10.1126/science.1106148. [DOI] [PubMed] [Google Scholar]
- Schaeffer V, Arbabi S, Garcia IA, Knoll ML, Cuschieri J, Bulger EM, Maier RV. Role of the mTOR pathway in LPS-activated monocytes: influence of hypertonic saline. J Surg Res. 2011;171:769–776. doi: 10.1016/j.jss.2010.05.035. [DOI] [PMC free article] [PubMed] [Google Scholar]
- Schiefermeier N, Scheffler JM, de Araujo ME, Stasyk T, Yordanov T, Ebner HL, Offterdinger M, Munck S, Hess MW, Wickström SA, et al. The late endosomal p14-MP1 (LAMTOR2/3) complex regulates focal adhesion dynamics during cell migration. J Cell Biol. 2014;205:525–540. doi: 10.1083/jcb.201310043. [DOI] [PMC free article] [PubMed] [Google Scholar]
- Sengupta S, Peterson TR, Sabatini DM. Regulation of the mTOR complex 1 pathway by nutrients, growth factors, and stress. Mol Cell. 2010;40:310–322. doi: 10.1016/j.molcel.2010.09.026. [DOI] [PMC free article] [PubMed] [Google Scholar]
- Settembre C, Zoncu R, Medina DL, Vetrini , Erdin S, Erdin S, Huynh T, Ferron M, Karsenty G, Vellard MC, et al. A lysosome-to-nucleus signalling mechanism senses and regulates the lysosome via mTOR and TFEB. EMBO J. 2012;31:1095–1108. doi: 10.1038/emboj.2012.32. [DOI] [PMC free article] [PubMed] [Google Scholar]
- Settembre C, Fraldi A, Medina DL, Ballabio A. Signals from the lysosome: a control centre for cellular clearance and energy metabolism. Nat Rev Mol Cell Biol. 2013;14:283–296. doi: 10.1038/nrm3565. [DOI] [PMC free article] [PubMed] [Google Scholar]
- Stambolic V, Suzuki A, De la Pompa JL, Brothers GM, Mirtsos C, Sasaki T, Ruland J, Penninger JM, Siderovski DP, Mak TW. Negative regulation of PKB/Akt-dependent cell survival by the tumor suppressor PTEN. Cell. 1998;95:29–39. doi: 10.1016/s0092-8674(00)81780-8. [DOI] [PubMed] [Google Scholar]
- Stephen TL, et al. Transport of Streptococcus pneumoniae capsular polysaccharide in MHC class II tubules. PLoS Pathog. 2007;3:e32. doi: 10.1371/journal.ppat.0030032. [DOI] [PMC free article] [PubMed] [Google Scholar]
- Suzuki N, Suzuki S, Duncan GS, Millar , Wada T, Mirtsos C, Takada H, Wakeham A, Itie A, Li S, et al. Severe impairment of interleukin-1 and Toll-like receptor signalling in mice lacking IRAK-4. Nature. 2002;416:750–756. doi: 10.1038/nature736. [DOI] [PubMed] [Google Scholar]
- Swanson J, Bushnell A, Silverstein SC. Tubular lysosome morphology and distribution within macrophages depend on the integrity of cytoplasmic microtubules. Proc Natl Acad Sci USA. 1987;84:1921–1925. doi: 10.1073/pnas.84.7.1921. [DOI] [PMC free article] [PubMed] [Google Scholar]
- Swanson JA, Yirinec BD, Silverstein SC. Phorbol esters and horseradish peroxidase stimulate pinocytosis and redirect the flow of pinocytosed fluid in macrophages. J Cell Biol. 1985;100:851–859. doi: 10.1083/jcb.100.3.851. [DOI] [PMC free article] [PubMed] [Google Scholar]
- Swiech L, Blazejczyk M, Urbanska M, Pietruszka P, Dortland BR, Malik AR, Wulf PS, Hoogenraad CC, Jaworski J. CLIP-170 and IQGAP1 cooperatively regulate dendrite morphology. J Neurosci. 2011;31:4555–4568. doi: 10.1523/JNEUROSCI.6582-10.2011. [DOI] [PMC free article] [PubMed] [Google Scholar]
- Thomas JA, Allen JL, Tsen M, Dubnicoff T, Danao J, Liao XC, Cao Z, Wasserman SA. Impaired cytokine signaling in mice lacking the IL-1 receptor-associated kinase. J Immunol. 1999;163:978–984. [PubMed] [Google Scholar]
- Vyas JM, Kim Y-M, Artavanis-Tsakonas K, Love JC, Van der Veen AG, Ploegh HL. Tubulation of class II MHC compartments is microtubule dependent and involves multiple endolysosomal membrane proteins in primary dendritic cells. J Immunol. 2007;178:7199–7210. doi: 10.4049/jimmunol.178.11.7199. [DOI] [PMC free article] [PubMed] [Google Scholar]
- Weichhart T, Costantino G, Poglitsch M, Rosner , Zeyda M, Stuhlmeier KM, Kolbe T, Stulnig TM, Hörl WH, Hengstschläger M, et al. The TSC-mTOR signaling pathway regulates the innate inflammatory response. Immunity. 2008;29:565–577. doi: 10.1016/j.immuni.2008.08.012. [DOI] [PubMed] [Google Scholar]
- Yamamoto M, Sato S, Hemmi H, Hoshino , Kaisho T, Sanjo H, Takeuchi O, Sugiyama M, Okabe M, Takeda K, et al. Role of adaptor TRIF in the MyD88-independent toll-like receptor signaling pathway. Science. 2003a;301:640–643. doi: 10.1126/science.1087262. [DOI] [PubMed] [Google Scholar]
- Yamamoto M, Sato S, Hemmi H, Uematsu S, Hoshino K, Kaisho T, Takeuchi O, Takeda K, Akira S. TRAM is specifically involved in the Toll-like receptor 4-mediated MyD88-independent signaling pathway. Nat Immunol. 2003b;4:1144–1150. doi: 10.1038/ni986. [DOI] [PubMed] [Google Scholar]
- Yamamoto M, Sato S, Mori K, Hoshino K, Takeuchi O, Takeda K, Akira S. Cutting edge: a novel Toll/IL-1 receptor domain-containing adapter that preferentially activates the IFN-beta promoter in the Toll-like receptor signaling. J Immunol. 2002;169:6668–6672. doi: 10.4049/jimmunol.169.12.6668. [DOI] [PubMed] [Google Scholar]
- Yu L, McPhee CK, Zheng L, Mardones , Rong Y, Peng J, Mi N, Zhao Y, Liu Z, Wan F, et al. Termination of autophagy and reformation of lysosomes regulated by mTOR. Nature. 2010;465:942–946. doi: 10.1038/nature09076. [DOI] [PMC free article] [PubMed] [Google Scholar]
- Zoncu R, Bar-Peled L, Efeyan A, Wang S, Sancak Y, Sabatini DM. mTORC1 senses lysosomal amino acids through an inside-out mechanism that requires the vacuolar H+-ATPase. Science. 2011;334:678–683. doi: 10.1126/science.1207056. [DOI] [PMC free article] [PubMed] [Google Scholar]
Associated Data
This section collects any data citations, data availability statements, or supplementary materials included in this article.