Abstract
Background
Previous research suggests that classically trained professional singers rely not only on external auditory feedback but also on proprioceptive feedback associated with internal voice sensitivities.
Objectives
The Lombard Effect in singers and the relationship between Sound Pressure Level (SPL) and external auditory feedback was evaluated for professional and non-professional singers. Additionally, the relationship between voice quality, evaluated in terms of Singing Power Ratio (SPR), and external auditory feedback, level of accompaniment, voice register and singer gender was analyzed.
Methods
The subjects were 10 amateur or beginner singers, and 10 classically-trained professional or semi-professional singers (10 males and 10 females). Subjects sang an excerpt from the Star-spangled Banner with three different levels of the accompaniment, 70, 80 and 90 dBA, and with three different levels of external auditory feedback. SPL and the SPR were analyzed.
Results
The Lombard Effect was stronger for non-professional singers than professional singers. Higher levels of external auditory feedback were associated with a reduction in SPL. As predicted, the mean SPR was higher for professional than non-professional singers. Better voice quality was detected in the presence of higher levels of external auditory feedback.
Conclusions
With an increase in training, the singer’s reliance on external auditory feedback decreases.
Keywords: Singing voice, Lombard Effect, Auditory feedback, Voice training, Singing Power Ratio
Introduction
It has been established that auditory feedback has a strong effect on the performance of singers, and instrumentalists, and an integration of such feedback is important in the search for the ideal sound.1 In the case of instrumentalists, the source of sound is external to their own body, while for vocal performers, the voice is generated internally. Therefore, vocal performers rely not only on external auditory feedback but also on proprioceptive feedback associated with internal voice sensitivities. These sensitivities, consisting primarily of pallesthetic (vibratory) and kinesthetic (muscular) sensitivities, provide performers with landmarks for controlling their emissions.2 This means of control is more reliable than external auditory feedback, in which the perceived voice is substantially modified by the acoustics of the environment.2
Over the last few decades, several studies have been conducted to quantify external auditory feedback and to assess which acoustic parameters are relevant to performance quality.3 Currently, the Support (ST) parameters proposed by Gade are part of the standard ISO 3382:2009.4 A voice-specific support parameter, STV, was proposed by Brunskog et al.5 and revised by Pelegrín-García.6 By analogy with Gade’s ST3, this parameter is termed voice support and is defined as the difference between the reflected sound and the direct sound of the Impulse Response (IR), measured using the mouth of a Head and Torso Simulator (HATS) as the source, with the ears as receivers.
During a performance, the singer moves around on the stage. In different positions, the acoustic conditions and the balance with the orchestra differ; however, the singer’s voice emission should be internally consistent. Consequently, one of the goals of classical vocal training is to emit a consistent sound that is independent from the acoustics of the space. This goal is inconsistent with natural tendencies in the use of the voice, such as the Lombard Effect. Lombard noted in 1911 that a speaker changes his or her voice level when the ambient noise level increases, on the one hand, and when the level at which he hears his own voice (his external auditory feedback) decreases, on the other.7
Few studies have examined the Lombard Effect in singers. Coleman and Hicks8 measured the sound pressure level (SPL) produced by singers (6 professional singers, 6 choir singers) at six inches from the mouth during a performance of two songs with three different levels of accompaniment (80, 95 and 110 dB) presented by means of headphones. In most cases, professional singers were approximately 5–6 dB louder than choir singers. The only significant effect of the level of the accompaniment on that of the voice was found for choir and professional singers with a slope of 0.06 dB/dB and 0.12 dB/dB, respectively. In 1992, Tonkinson9 found a similar effect in choir singers, but experience was not a significant factor.
The SPL of the voice is also influenced by the dynamics specified in the score. Boren et al.10 asked nine professional singers (6 females and 3 males) to perform a piece (30–60 s long) from their repertoire at three levels: pianissimo, mezzo forte and fortissimo. The range of the Leq for the mask singing voice was found to be 73.2–84.8 dBA, while the range of the peak sound pressure level was 93.8–106.4 dBA.
The Lombard Effect involves not only an increase in SPL, but also spectral changes.11 Some voice acoustic measures take into account these spectral changes and their relationship with voice quality. Among them, the Singing Power Ratio or SPR12 represents the ratio between the greatest spectral resonance peak between 2 and 4 kHz and the greatest spectral resonance peak between 0 and 2 kHz. This parameter, which typically relates to the number of years of voice training, is used for an objective evaluation of singing voice quality.13
In the present study, recordings of an excerpt of the Star-spangled Banner (the American National Anthem) sung by ten female and ten male classical singers were analyzed. The singers comprised ten professional and ten non-professional singers. The Lombard Effect in singers and the relationship between SPL and external auditory feedback was evaluated for both groups. Additionally, the relationship between voice quality (evaluated in terms of SPR) and external auditory feedback, level of accompaniment, voice register and singer gender was analyzed.
Methods
Subjects
The human subject research was approved by the Institutional Review Board (IRB #13-1149). Ten female and ten male singers (mean age 22.9 ± 4.5 years) participated in the experiment. The sample was divided into two groups: group 1 comprised amateur or beginner singers, while group 2 comprised professional and semi-professional classical singers. In group 1, there were 3 Sopranos, 2 Mezzo sopranos, 3 Baritones and 2 Tenors. They were mainly choristers in a cappella choirs, with a primarily popular (“pop”) repertoire, with years of singing experience ranging from 4 to 16 and an average number of years of private classical voice lessons equal to 4.7. In group 2, there were 5 Sopranos, 1 Mezzo-soprano, 3 Basses, and 1 Tenor. They were predominantly Master’s students in classical singing, with years of singing experience ranging from 4 to 14 and an average number of years of private voice lessons equal to 7.6.
Protocol
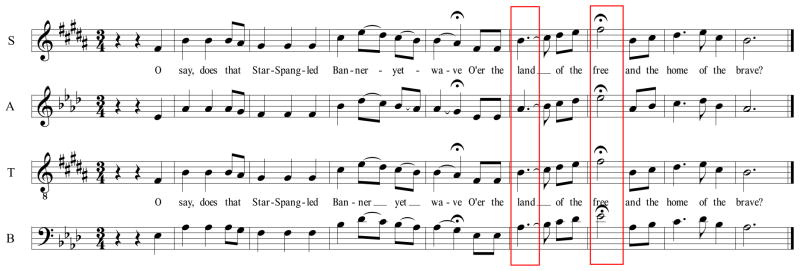
After an initial (guided) warm-up, subjects performed vocal tasks in three different external auditory feedback conditions. The tasks consisted of singing an excerpt from the Star-spangled Banner with a musical accompaniment, without the use of falsetto. The keys used were B major for Tenors and Sopranos and Ab major for the other singers. These keys were chosen with the purpose of recording notes in the low, middle and high registers according to the voice type. The scores of the excerpt for the different voice types is shown in Figure 1.
Figure 1.
Scores of the excerpt from the Star-spangled Banner used during the experiment. The keys used during the experiment were B major for Tenors and Sopranos and Ab major for the other singers.
The experiment was conducted in a soundproof room (2.5 × 2.75m and h=2 m). This environment is referred to as set 1. In a second condition (set 2), two reflective panels were placed in this room at 0.5 m from the singers, 45° from the mouth axis. In this condition, external auditory feedback is increased. In the third condition (set 3), singers were asked to put on headphones, which cancelled external auditory feedback. Three different levels of the accompaniment were used: 70, 80 and 90 dBA measured at the singers’ ears with a KEMAR 45BB-1 HATS. In sets 1 and 2, the accompaniment was played by means of a loudspeaker, while in set 3 headphones were used.
A total of 9 tasks were recorded for each subject by means of a boundary microphone (Behringer ECM8000) and a head-mounted microphone (HMM, Glottal Enterprises M-80). Both microphones were connected to a PC via a Scarlett 2i4 Focusrite soundboard. Audacity 2.0.6 was used as the recording software. In order to avoid systematic effects introduced by the order of task presentation, task order was randomized.
Analysis
For each task performed by each subject, the time history of the SPL was calculated from the head-mounted microphone signal. The calibration of the signal was performed by means of a comparison with the signal of the boundary microphone, which was first calibrated with a Sound Calibrator (NC-74). These analyses were conducted with MATLAB R2014b. The highest note in the excerpt from the Star-spangled Banner (the vowel in the word “free”) and a note in the low-middle voice register (the first portion of the vowel in the word “land”) were selected in each task. The relevant notes are highlighted in Figure 1. SPR was calculated per vowel and task with Praat 5.4.01.
Linear mixed-effects models were fit by Restricted Maximum Likelihood in R 3.1.214 using the lme4 package15 with p values based on Satterthwaite’s approximations16 and corrected Tukey’s post-hoc comparisons. Model comparisons were performed on the basis of the Akaike Information Criterion and chi-square (χ2) likelihood ratio test statistics and p values from the chi-square distribution.
Results
Acoustics of the sets
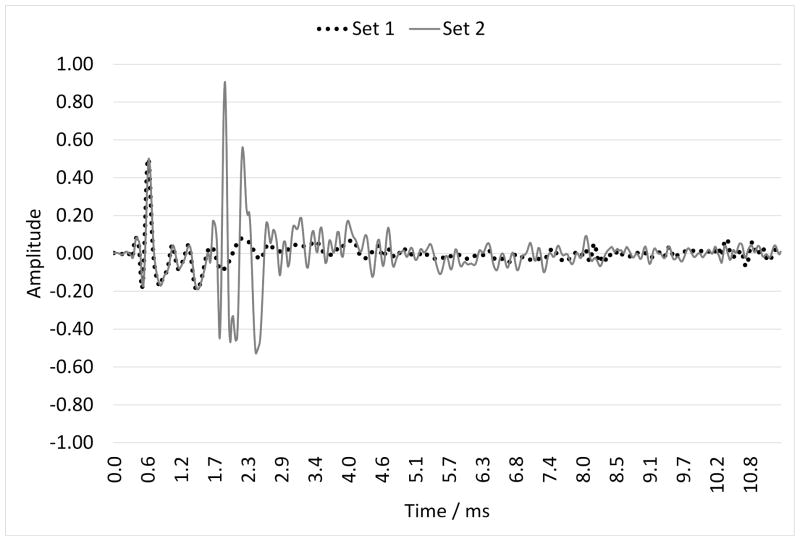
As described above, three sets were used during the experiment, which differed in the level of external auditory feedback. Set 1 consisted of the soundproof room, without reflective panels. The auditory feedback was at a medium–low level. The mid-frequencies Reverberation Time (RT) in the room was 0.05 s and the trend over the octave band was almost flat. The Schroeder Frequency was 121 Hz; consequently it was possible to evaluate the room acoustic parameters only for frequencies higher than 121 Hz. In set 2, auditory feedback was increased with the introduction of reflective panels. The introduction of the panels did not affect the reverberation time. The IR of this set showed a strong first reflection due to the panels, as is notable in Figure 2.
Figure 2.
Impulse Response between the mouth and the ears of a Head and Torso Simulator in the soundproof room with and without reflective panels (set 1, without panels; set 2, with panels).
STV and room gain (RG) were calculated for sets 1 and 2.6 Unlike the method proposed by Pelegrín-García6, a window of 1 ms (rather than 5) was used to discriminate between the direct and the reflected sound. This modification was necessary because the arrival time of the first reflection (due to the proximity of the panels) was used as a discriminant value for the direct sound. RG was 0.07 dB and 0.38 dB in set 1 and set 2, respectively, while STV was −18.1 dB and −10.4 dB in set 1 and set 2, respectively.
Set 3 involved the minimum level of the external auditory feedback and was obtained using headphones to reproduce the accompaniment. The insulation introduced by the headphones was higher at higher frequencies with an average attenuation of 16.2 dB for frequencies between 250 Hz and 8 kHz.
Sound pressure level in the singing voice
The sound pressure level (SPL) was derived from the signals per task with a time step of 0.186 s. The reported levels were estimated at 1 m from the subject on-axis in quasi-anechoic conditions. SPL means, standard deviations and peaks are reported in Table I per subject, with the subject’s age, gender, and group membership (non-professionals being group 0 and professionals being group 1).
Table I.
Characteristic of the sample, with age, gender, group (non-professionals being group 0 and professionals being group 1), SPL means, standard deviations and peaks and SPR means, standard deviations.
| Subject id | Age | Gender | Group* | SPL mean | SPL std | SPL Peak | SPR mean | SPR std |
|---|---|---|---|---|---|---|---|---|
| 1 | 30 | F | 0 | 79.8 | 10.5 | 95.8 | −17.9 | 4.9 |
| 2 | 20 | F | 0 | 72.1 | 9.3 | 89.5 | −21.4 | 3.1 |
| 3 | 21 | M | 0 | 77.8 | 10.8 | 92.6 | −17.1 | 8.2 |
| 4 | 19 | F | 0 | 78.0 | 10.1 | 97.4 | −21.4 | 5.0 |
| 5 | 20 | M | 0 | 80.5 | 9.0 | 95.8 | −19.4 | 3.5 |
| 6 | 29 | M | 0 | 70.2 | 10.1 | 87.4 | −25.1 | 5.5 |
| 7 | 19 | F | 0 | 72.5 | 10.6 | 89.7 | −33.3 | 3.3 |
| 8 | 24 | M | 0 | 79.6 | 8.6 | 93.4 | −19.8 | 3.7 |
| 9 | 19 | M | 0 | 77.1 | 9.0 | 91.0 | −15.3 | 6.3 |
| 10 | 25 | M | 1 | 82.1 | 8.8 | 95.1 | −9.1 | 3.2 |
| 11 | 19 | F | 0 | 76.4 | 8.7 | 88.8 | −19.3 | 3.2 |
| 12 | 19 | F | 1 | 82.0 | 11.2 | 99.5 | −16.8 | 6.0 |
| 13 | 19 | F | 1 | 83.5 | 10.7 | 101.1 | −18.5 | 2.0 |
| 14 | 32 | F | 1 | 81.1 | 8.7 | 95.9 | −13.7 | 2.4 |
| 15 | 21 | M | 1 | 80.7 | 10.7 | 92.0 | −10.4 | 4.5 |
| 16 | 22 | M | 1 | 81.0 | 10.0 | 92.5 | −11.0 | 2.4 |
| 17 | 24 | F | 1 | 80.6 | 10.6 | 97.0 | −17.9 | 2.8 |
| 18 | 26 | F | 1 | 74.8 | 10.2 | 92.9 | −20.7 | 4.6 |
| 19 | 20 | F | 1 | 76.5 | 11.1 | 93.4 | −21.8 | 2.6 |
| 20 | 31 | M | 1 | 81.2 | 10.1 | 92.6 | −11.3 | 6.7 |
0 = Non-professional, 1 = Professional.
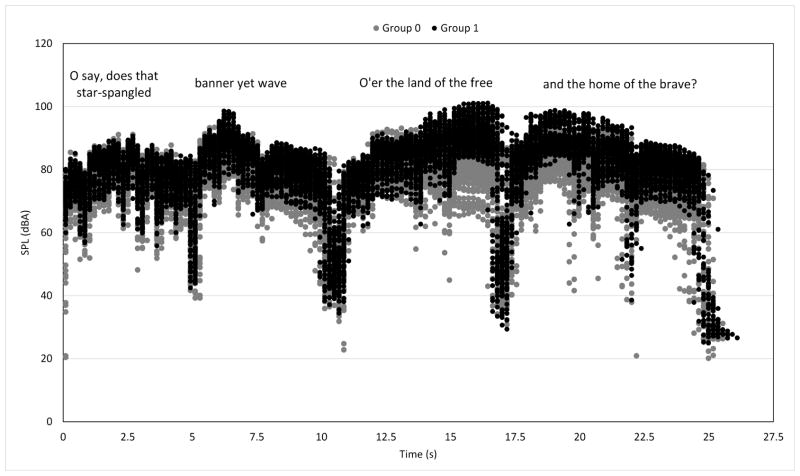
The range of the mean SPL was between 70.2 dBA and 83.5 dBA, and the range of the SPL peak was between 87.4 dBA and 101.1 dBA. These values are consistent with those reported by Boren et al.10 Indeed, as mentioned above, they found a mean SPL for singers varying between 73.2 dBA and 84.8 dBA and a peak SPL varying between 93.8 dBA and 106.4 dBA. The SPL values over the time for the two groups are shown in Figure 3. The SPL means and standard deviations are given in Table II per level, set and group.
Figure 3.
Voice Sound Pressure Level (dBA) at 1 meter in quasi-anechoic conditions recorded in all subjects over time (s). Values are presented per group (0: non-professional; 1: professional).
Table II.
SPL means and standard deviations for each level of accompaniment per set and group (non-professionals being group 0 and professionals being group 1) and SPR means and standard deviations obtained in each word in the same conditions.
| Level 70 | Level 80 | Level 90 | ||||
|---|---|---|---|---|---|---|
|
| ||||||
| Group 0 | Group 1 | Group 0 | Group 1 | Group 0 | Group 1 | |
| SPL/dB(A) | ||||||
| Set 1 | 74.8 (10.5) | 78.9 (11.4) | 76.5 (9.9) | 80.0 (10.0) | 79.6 (7.8) | 81.9 (9.2) |
| Set 2 | 73.5 (11.3) | 78.7 (11.5) | 75.7 (10.1) | 80.0 (10.6) | 78.2 (8.2) | 81.7 (9.3) |
| Set 3 | 74.9 (11.0) | 80.0 (10.9) | 76.1 (10.8) | 80.3 (10.7) | 78.2 (10.6) | 81.6 (10.7) |
|
| ||||||
| “free” SPR/dB | ||||||
| Set 1 | −21.1 (7.6) | −13.5 (7.4) | −20.8 (7.2) | −14.7 (7.8) | −17.9 (8.5) | −14.1 (7.1) |
| Set 2 | −17.1 (8.4) | −13.4 (7.1) | −16.7 (8.4) | −14.1 (7.2) | −17.1 (7.0) | −13.0 (7.4) |
| Set 3 | −21.5 (7.5) | −14.4 (7.4) | −20.0 (7.1) | −16.1 (6.8) | −20.4 (8.1) | −14.2 (6.6) |
| “land” SPR/dB | ||||||
| Set 1 | −21.8 (4.8) | −16.6 (5.4) | −22.1 (4.8) | −16.9 (5.5) | −21.0 (4.1) | −15.0 (3.9) |
| Set 2 | −24.0 (7.0) | −16.9 (5.0) | −21.6 (4.9) | −15.0 (3.5) | −21.3 (5.8) | −14.5 (3.4) |
| Set 3 | −24.3 (7.5) | −17.3 (4.8) | −25.3 (5.8) | −17.1 (5.4) | −23.8 (4.3) | −15.6 (4.9) |
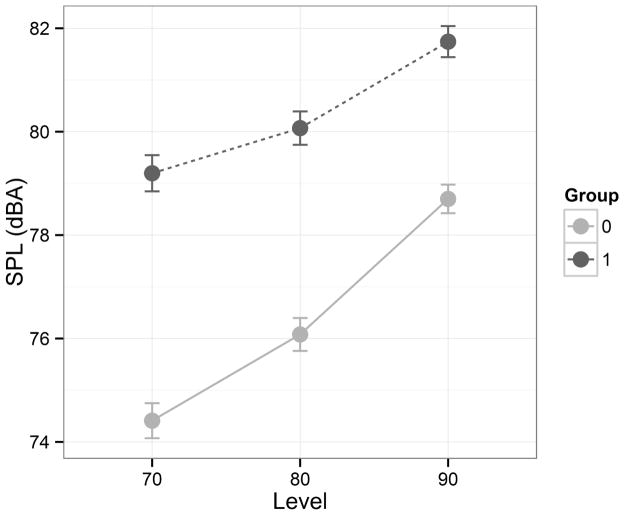
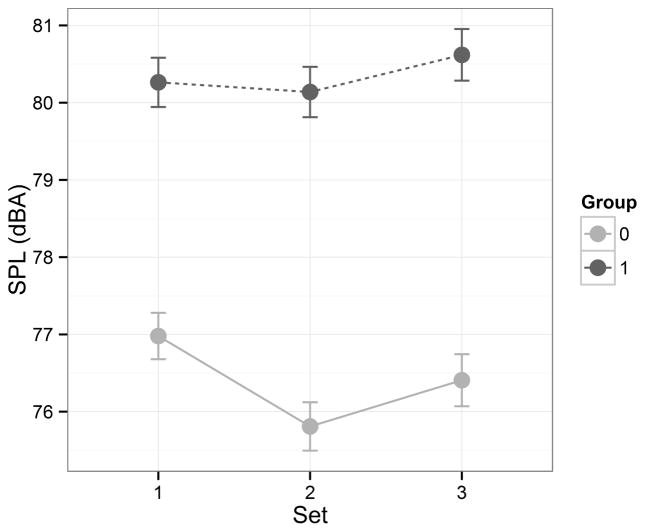
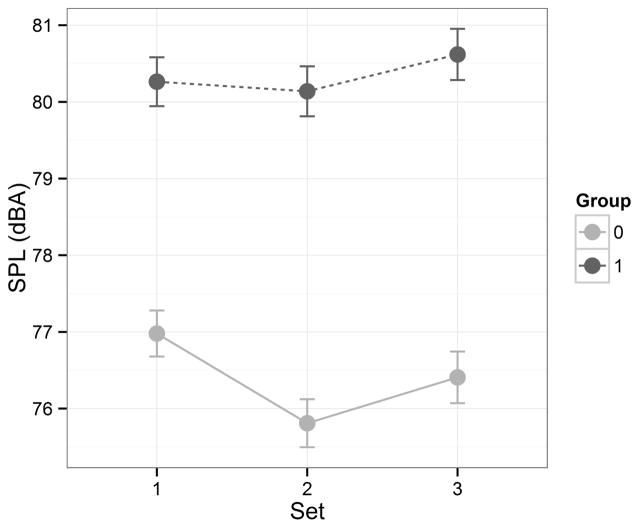
Table III shows the summary of the best fitting linear mixed-effects model to the SPL data with the predictors of (1) group, (2) level and (3) set, and interaction terms for (4) level and set and (5) level and professional, with the random effect term of (6) subject. The unconditional variance of subject was estimated as 9.86 (and the residual variance was estimated as 97.2). The estimate of the regression coefficient for group 1 was 4.81 dBA higher than the estimate for group 0 (p<0.01). This value is comparable with the difference between groups found by Coleman and Hicks8 (5 – 6 dB). Level 70 was associated with estimates that were 2.08 and 4.70 dBA lower than levels 80 and 90, respectively (p<0.0001). Figure 4 shows the sound pressure level by accompaniment level per group. The estimate for set 2 (highest level of external auditory feedback) was 0.73 and 1.29 dBA lower than the estimates for sets 1 and 3, respectively (p<0.01). Figure 5 shows SPL by set per group.
Table III.
Summary of the best fitting linear mixed-effects model for the SPL data with the predictors of group, level and set and interaction terms for level and set and level and professional, with the random effect term of subject. The reference levels are level 70, set 2 and group 0.
| Estimate | Std. Error | df | t-value | p-value | |
|---|---|---|---|---|---|
| Intercept | 73.74 | 1.017 | 19 | 72.51 | 0.0001 |
| Level 80 | 2.08 | 0.311 | 24073 | 6.69 | 0.0001 |
| Level 90 | 4.70 | 0.311 | 24073 | 15.12 | 0.0001 |
| Set 1 | 0.73 | 0.270 | 24073 | 2.70 | 0.0070 |
| Set 3 | 1.29 | 0.270 | 24073 | 4.78 | 0.0001 |
| Group 1 | 4.81 | 1.421 | 19 | 3.39 | 0.0032 |
| Level 80·Set 1 | −0.29 | 0.381 | 24073 | −0.77 | 0.4428 |
| Level 90·Set 1 | 0.09 | 0.381 | 24073 | 0.24 | 0.8126 |
| Level 80·Set 3 | −0.92 | 0.381 | 24073 | −2.40 | 0.0164 |
| Level 90·Set 3 | −1.34 | 0.381 | 24073 | −3.52 | 0.0004 |
| Level 80·Group 1 | −0.81 | 0.311 | 24073 | −2.60 | 0.0092 |
| Level 90·Group 1 | −1.74 | 0.311 | 24073 | −5.59 | 0.0001 |
Significance codes: <0.001; <0.01; <0.05; <0.1
Figure 4.
Means and 95% confidence intervals of voice Sound Pressure Level (dBA) at 1 meter in quasi-anechoic conditions. Values are presented by accompaniment level per group (0: non-professional; 1: professional).
Figure 5.
Means and 95% confidence intervals of voice Sound Pressure Level (dBA) at 1 meter in quasi-anechoic conditions. Values are presented by set and group (0: non-professional; 1: professional).
Regarding the interaction terms, there was least difference in SPL according to the level of the accompaniment in set 3 (p<0.05). SPL differed less according to accompaniment level for subjects in group 1 than for subjects in group 0 (p<0.001). Post-hoc multiple comparisons of means (Tukey’s with adjusted p values) were run for the level term in the fitted model. All comparisons were significant at p<0.0001 (80–70, z =6.7; 90–70, z=15.1; 90–80, z=8.45).
Singing Power Ratio
The singing power ratio (SPR) was calculated per task from the spectra of two extracted notes: (1) a note in the high register, sung on the word “free”, and (2) a note in the low-middle register, sung on the first portion of the word “land”. The SPR mean and standard deviation per subject are reported in Table I. The range of the mean SPR was between −33.3 dB and −9.1 dB. This range is consistent with the values reported by Omori et al.12 Means and standard deviations per set, level, group and word are reported in Table II.
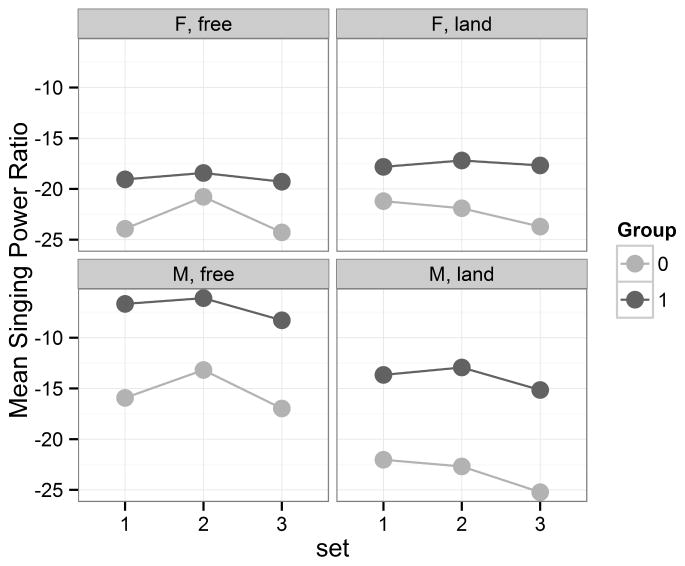
A model was fit to the SPR data with the predictors of (1) group, (2) level, (3) set, (4) word and (5) gender and the interaction of (6) word and gender, with the random effect term of (7) subject (Table IV). The unconditional variance of subject (subject-to-subject variability) was estimated as 15.47 (and the residual variance was estimated as 12.64). The effects of group and gender on SPR are shown in Figure 6. The estimate regression coefficient for “land” was 1.07 dB higher than that of “free” (p<0.05), while the estimate for group 1 was 6.4 dB higher than the estimate for group 0 (p<0.01). The estimate for males was 9.8 dB higher than that of females (p<0.0001). The estimate for set 2 (with panels) was higher than both set 1 and set 3, although the difference merely approached significance for set 1 (set 1 – set 2, p=0.054; set 3 – set 2, p<0.0001). The effect of set on SPR is shown in Figure 7.
Table IV.
Summary of the best fitting linear mixed-effects model for the SPR data with the predictors of group, set, level, word, gender and interaction terms for word and gender, with the random effect term of subject. The reference levels are group 0, set 2, level 70, the word “free” and female gender.
| Estimate | Std. Error | df | t-value | p-value | |
|---|---|---|---|---|---|
| Intercept | −23.71 | 1.627 | 20 | −14.57 | 0.0001 |
| Group 1 | 6.40 | 1.808 | 17 | 3.54 | 0.0025 |
| Set 1 | −0.89 | 0.459 | 334 | −1.93 | 0.0542 |
| Set 3 | −2.10 | 0.459 | 334 | −4.57 | 0.0001 |
| Level 80 | 0.13 | 0.459 | 334 | 0.28 | 0.7830 |
| Level 90 | 1.17 | 0.459 | 334 | 2.55 | 0.0112 |
| Word “land” | 1.07 | 0.505 | 334 | 2.12 | 0.0351 |
| Gender male | 9.77 | 1.855 | 18 | 5.27 | 0.0001 |
| Word “land” · Gender male | −8.56 | 0.753 | 334 | −11.36 | 0.0001 |
Significance codes: <0.001; <0.01; <0.05; <0.1
Figure 6.
Singing Power Ratio (SPR in dB) per group and gender where boxes represent the interquartile range (25 to 75%) and medians are marked by horizontal lines. Where notches differ, medians differ significantly.
Figure 7.
Mean values of the Singing Power Ratio (SPR in dB) evaluated on two notes (on the word “free” in the high register and on the word “land” in the mid-low register) for females and males, respectively. Values are presented by set and group (0: non-professional; 1: professional).
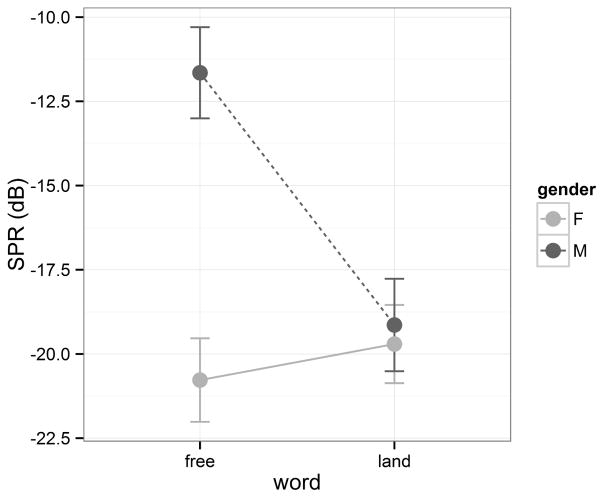
Level 70 tended to be associated with a lower SPR than 80 or 90, but differed significantly only from level 90, which was associated with an SPR estimate that was 1.2 dB higher (p <0.05). There was an interaction of word and gender (p<0.0001): the difference in SPR between genders was present only for the word “free”, for which males were associated with a higher SPR than females. This interaction effect is shown in Figure 8.
Figure 8.
Means and 95% confidence intervals of Singing Power Ratio (SPR in dB) evaluated on two notes (on the word “free” in the high register and on the word “land” in the mid-low register). Values are presented by gender.
Discussion
There are two opposing tendencies in the response of voice intensity to an increase in the level of the accompaniment. The Lombard Effect is the unconscious tendency to increase the intensity of the voice with an increase in the intensity of the background noise. The opposing tendency is due to the effect of a goal of (especially classical) singing training: a decrease in the dependency on external auditory feedback and an increase in the reliance on internal voice sensitivities (internal auditory and proprioceptive or kinesthetic feedback). In Figure 4, it was shown that the Lombard Effect is stronger for non-professional singers (group 0) than professional ones (group 1). Over the 20 dB increase in the level of the accompaniment, there was a 4.29 dB increase for group 0 and only a 2.55 dB increase for group 1. A slope of 0.21 dB/dB was found for non-professional singers and a slope of 0.13 dB/dB was found for professional singers, indicating a decrease in the reliance on external auditory feedback for the professional singers.
When the accompaniment was played via headphones (set 3), the slopes were 0.17 dB/dB for non-professional and 0.08 dB/dB for professional singers. These results differ from those of Coleman and Hicks, 8 who report a slope of 0.06 dB/dB for choristers and a slope of 0.12 dB/dB for professional singers. The differences between the results of the two studies may be due to lower subject numbers in the Coleman and Hicks8 study and to the fact that their accompaniment varied within a higher range (80 to 110 dB) than that of the present study. The implication of this difference in the level of the accompaniment is that an achievement of the singer’s maximum voice power may have occurred in Coleman and Hicks’ study8, more so for choristers than professionals. Indeed, the results of the present study indicate that non-professionals, who were typically choristers, have a lower maximum voice power (as indicated by the SPL peak reported in Table I).
The relationship between external auditory feedback and SPL was discussed, where in set 1, the external auditory feedback was at a medium–low level, in set 2, it was increased with the introduction of reflective panels and in set 3 it was strongly attenuated by headphones. As shown in Figure 5, set 2 was associated with the lowest SPL values. Thus, higher levels of external auditory feedback were associated with a reduction in SPL, as would be predicted on the basis of Pelegrín-García’s findings6 for the effect of RG on SPL in speech. The SPL was typically approximately 4 dB higher for professional than non-professional singers. For the non-professional singers, the SPL was 1.17 dB lower for set 2 than set 1, and 0.6 dB lower for set 2 than set 3. For the professional singers, the mean was 0.13 dB lower for set 2 than set 1, and 0.5 dB lower for set 2 than set 3. These results provide further evidence for the claim that the effect of external auditory feedback on voice regulation is reduced with (classical) training.
With regard to SPR, the mean for the professional singers was higher than that for the non-professional singers, just as the mean for males was higher than that for females (Figure 6). The difference in SPR between males and females was greater in the professional group, as shown in Figure 6. The mean SPR for professional female singers was −18.24 dB and for non-professional female singers, −22.6 dB. The mean SPR for professional male singers was −10.47 dB and for non-professional singers, −19.34 dB.
The results obtained in this study show some inconsistencies with the results reported by Omori et al.12 In the two studies, professional male singers show similar SPR values, while professional female singers in the present study show lower values than those in the Omori et al. study.12 The SPR values of the non-professional singers in the present study lie between those of non-singers and non-professional singers in the Omori et al. study. 12 The inconsistency may be caused by differences in the classification of the singers into groups in the two studies. In the present study, the non-professional singers received classical training but primarily performed a popular repertoire.
In the present study, a significant interaction was found between gender and word, where ‘word’ refers to different voice registers. As mentioned, the SPR was calculated separately for the two words, which were sung in two different registers: “free” (high register) and “land” (low-middle register). Figure 8 showed that the difference in SPR between genders occurred in the context of the high register only. That is to say, there was a higher SPR for males than females in the high register. This effect is related to the shape of the spectrum and hence the dimensions of the vocal tract. In general, as shown by Sundberg,17 the spectrum of singing voice differs according to gender. Male singers had a stronger frequency component between 2000 and 4000 Hz than female singers. In particular, tenors showed a peak between 2500 and 3500 Hz, while baritones and basses showed a peak between 2000 and 3000 Hz. These peaks increased with an increase in the fundamental frequency. Consequently, higher values of SPR were detected in the high register (on the word “free”). In the females’ voices, spectral components (e.g., vocal tract resonances) were stronger near the fundamental frequency and this spectral shape was emphasized in the high register. Relatedly, there was a decrease for females in SPR in the high register relative to the low-middle register.
As far as the effect of external auditory feedback on the SPR is concerned, as shown in Figure 7, higher levels of external auditory feedback were associated with higher levels of SPR. That is, better voice quality was detected in the presence of higher levels of external auditory feedback. The benefits of increased external auditory feedback were more evident for the high register than the low-middle register. Especially in the case of the low-middle register, an increase in SPR was evident for set 2 relative to set 3. This finding indicates that an increase in the level of external auditory feedback was associated with an increase in voice quality. Non-professional singers appeared to benefit more from the increase in external auditory feedback than professional singers. Consequently, these results confirm the tendency for classically trained professional singers to rely less on external auditory feedback than non-professional singers.
Conclusion
The current study considered the effect of training and external auditory feedback on two aspects of the singing voice: variation in voice level according to accompaniment level (the Lombard Effect) and voice quality, estimated by the SPR parameter. Ideally, a singer is independent from external auditory feedback, but this independence runs counter to the Lombard Effect. The findings are summarized below:
SPL was typically approximately 4 dB higher for (classically trained) professional than non-professional singers;
The Lombard Effect was stronger for non-professional singers (0.21 dB/dB) than in professional ones (0.13 dB/dB);
Higher levels of external auditory feedback were associated with a reduction in SPL and this effect was stronger in non-professional singers than professional ones;
The mean SPR was higher for professional than non-professional singers, i.e., voice quality as measured by SPR improved with training;
Better voice quality (higher SPR) was detected in the presence of higher levels of external auditory feedback, especially in the high register;
Non-professional (predominantly choral) singers appeared to benefit more from the increase in external auditory feedback than professional classical singers.
The limitations of this study include the fact that the professional singers were students, with a mean age of 22.9 ± 4.5 years. One implication is that the concepts concerning singing techniques, which have been learned by the singers, may not have been fully acquired as automatic behaviors. Thus, it is conceivable that mature singers rely only on internal sensitivities.
A limitation of the SPR measure is that it varies according to gender and register, as was found in the current study. Differences in male and female vocal tract dimensions are associated with differences in the voice spectrum. Moreover, the effect of an increase in fundamental frequency on the spectral slope differs between males and females. Due to these spectral differences, in the present study, SPR increased with the fundamental frequency for males, but decreased for females, independently from voice quality. Omori et al.12 did not observe the interaction between gender and fundamental frequency because they merely asked the singers to produce the vowel sound /a/ at a comfortable pitch and intensity. However, it is clear from the findings presented here that any future study of SPR should consider the effect of gender and singing register. Additionally, in future research the possibility of extending these findings to other types of professional singers, such as commercial ones, could be considered.
Acknowledgments
The kind cooperation of the singers has made this work possible. Thanks to Professor R. Fracker and A. Lee for assistance in recruiting singers and to L. Hunter for editing assistance. Research reported in this publication was supported by the National Institute on Deafness and Other Communication Disorders of the National Institutes of Health under Award Number R01DC012315.
Footnotes
The content is solely the responsibility of the authors and does not necessarily represent the official views of the National Institutes of Health.
Publisher's Disclaimer: This is a PDF file of an unedited manuscript that has been accepted for publication. As a service to our customers we are providing this early version of the manuscript. The manuscript will undergo copyediting, typesetting, and review of the resulting proof before it is published in its final citable form. Please note that during the production process errors may be discovered which could affect the content, and all legal disclaimers that apply to the journal pertain.
References
- 1.Bottalico P, Astolfi A, Masoero M, Giovannini M. Valutazione della qualità acustica del golfo mistico del Teatro Regio di Torino tramite misure e questionari. Proceedings of XXXV Convegno Nazionale dell’Associazione Italiana di Acustica; 2008 Jun 11–13; Milano. c2008. [Google Scholar]
- 2.Scotto Di Carlo N. Internal voice sensitivities in opera singers. Folia Phoniatr Logop. 1994;46(2):79–85. doi: 10.1159/000266296. [DOI] [PubMed] [Google Scholar]
- 3.Gade AC. Acoustics for symphony orchestras; status after three decades of experimental research. Building Acoust. 2011;18(3, 4):181–206. [Google Scholar]
- 4.ISO 3382-1. Acoustics - Measurement of room acoustic parameters. 2009. [Google Scholar]
- 5.Brunskog J, Gade AC, Bellester GP, Calbo LR. Increase in voice level and speaker comfort in lecture rooms. J Acoust Soc Am. 2009;125(4):2072–2082. doi: 10.1121/1.3081396. [DOI] [PubMed] [Google Scholar]
- 6.Pelegrín-García D. Comment on “Increase in voice level and speaker comfort in lecture rooms” [J Acoust Soc Am 2009; 125: 2072–2082] J Acoust Soc Am. 2011;129(3):1161–1164. doi: 10.1121/1.3543940. [DOI] [PubMed] [Google Scholar]
- 7.Lane H, Tranel B. The Lombard Sign and the Role of Hearing in Speech. J Speech Hear Res. 1971;14(4):677–709. [Google Scholar]
- 8.Coleman RF, Hicks DM. Singer’s compensation for varying loudness levels of musical accompaniment. In: Lawrence, editor. Transcripts of the seventh symposium: care of the professional voice, part I: The scientific papers. New York: The Voice Foundation; 1978. pp. 80–91. [Google Scholar]
- 9.Tonkinson S. The Lombard effect in choral singing. J Voice. 1994;8(1):24–29. doi: 10.1016/s0892-1997(05)80316-9. [DOI] [PubMed] [Google Scholar]
- 10.Boren B, Roginska A, Gill B. Maximum averaged and peak levels of vocal sound pressure. Proceedings of AES 135th Convention; 2013 Oct; New York. c2013. pp. 17–20. [Google Scholar]
- 11.Brumm H, Zollinger SA. The evolution of the Lombard effect: 100 years of psychoacoustic research. Behav. 2011;148:1173–1198. [Google Scholar]
- 12.Omori K, Kacker A, Carroll LM, Riley WD, Blaugrund SM. Singing power ratio: Quantitative evaluation of singing voice quality. J Voice. 1996;10(3):228–235. doi: 10.1016/s0892-1997(96)80003-8. [DOI] [PubMed] [Google Scholar]
- 13.Watts C, Barnes-Burroughs K, Estis J, Blanton D. The singing power ratio as an objective measure of singing voice quality in untrained talented and nontalented singers. J Voice. 2006;20(1):82–88. doi: 10.1016/j.jvoice.2004.12.003. [DOI] [PubMed] [Google Scholar]
- 14.R Core Team. A language and environment for statistical computing. R Foundation for Statistical Computing; Vienna, Austria: 2014. Available from: http://www.R-project.org/ [Google Scholar]
- 15.Bates D, Maechler M, Bolker B, Walker S. lme4: Linear mixed-effects models using Eigen and S4. R package version 1.1–7. 2014 Available from: http://CRAN.R-project.org/package=lme4.
- 16.Kuznetsova A, Brockhoff PB, Christensen RHB. lmerTest: Tests in linear mixed-effects models. R package version 2.0–20. 2014 Available from: http://CRAN.Rproject.org/package-lmerTest.
- 17.Sundberg J. Level and center frequency of the singer’s formant. J Voice. 2011;15(2):176–186. doi: 10.1016/S0892-1997(01)00019-4. [DOI] [PubMed] [Google Scholar]


