Abstract
Gastric carcinoma is a digestive related malignant tumor with poor diagnosis and prognosis for advanced patients. PTGR1 (prostaglandin reductase 1), as a potential cancer biomarker, has not been reported in gastric carcinoma occurrence. To investigate the role of PTGR1 on gastric carcinoma cells, human PTGR1 was efficiently silenced by lentivirus-mediated system in MGC-803 cells confirmed by quantitative real-time PCR (qRT-PCR) and western blot. Then cell proliferation, colony formation and cell cycle were determined after knockdown of PTGR1 by MTT assay, colony assay and flow cytometry, respectively and data suggested that PTGR1 down regulated MGC-803 cells significantly suppressed the proliferation and colony formation ability and induced cell cycle arrest in the G0/G1 phase compared to controls (P < 0.001). Further investigation demonstrated knockdown of PTGR1 influenced cell proliferation and cell cycle via activating p21 and p53 signaling pathway described by Western blot assay. Our findings indicate that PTGR1 may be an oncogene in human gastric carcinoma and identified as a diagnosis and prognosis target for gastric carcinoma.
Keywords: Gastric carcinoma, prostaglandin reductase 1, RNA interference, cell cycle
Introduction
Gastric carcinoma, derived from gastric epithelial cells, is a digestive related cancer with low survival. It has been considered as the second common cancer in China [1] and main causes of cancer-related death worldwide [2]. At present, the treatment and prognosis is quietly poor for advanced gastric carcinoma [3], which can be ascribed to a variety of factors, including genetic regulation and interaction [4]. Even though investigators have made great effort in clarifying the molecular diagnostic and prognostic markers for gastric carcinoma, the results are far from enough.
PTGR1 (prostaglandin reductase 1) is a nitroalkene reductase [5] and plays a key responsible for biological inactivation of prostaglandins [6,7]. It has been identified as a band of 33 kDa exclusively in tumor and evaluated as a potential biomarker in liver cancer [8]. In addition, prostaglandins are involved in metabolites of arachidonic acid through COX (cyclooxygenase) pathway and demonstrated to contribute to the development of lung cancer [9,10]. Available evidences also indicate that Cox-2 derived prostaglandins could stimulate the proliferation colorectal carcinoma [11] and pancreatic cancer [12]. In the tumor samples, PTGR1 is thought as the top-ranked protein and possesses dual activity [13] and its overexpression has been shown to increase cell viability [14]. Despite recent obtained advances in understanding the biology of PTGR1 on tumor progression, there is poor report about the effect of down-regulation of PTGR1 on gastric carcinoma diagnosis and prognosis.
Lentivirus-mediated RNA interference technique is more and more applied to specifically and efficiently down regulate the expression level of a target gene [15-17]. In the present study, to investigate whether PTGR1 functions as potential biomarker in gastric carcinoma, one stable knockdown of PTGR1 cell line model was constructed by means of lentivirus-mediated RNA interference technique. Based on constructed PTGR1 silencing cell model, we further determined the effect of PTGR1 silencing on gastric carcinoma cell proliferation and growth, cell cycle regulation as well as downstream target proteins expression level.
Materials and methods
Lentiviral vector construction
Two short hairpin RNA (shRNA) sequences (S1, 5’-CTTGGATTTGATGTCGTCTTTCTCGAGAAAGACGACATCAAATCCAAGTTTTT-3’ and S2, 5’-CTATCCTACTAATAGTGACTTCTCGAGAAGTCACTATTAGTAGGATAGTTTTT-3’) were specific designed for PTGR1 (NM_001146108.1). The sequence of control shRNA was 5’-GCGGAGGGTTTGAAAGAATATCTCGAGATATTCTTTCAAACCCTCCGCTTTTTT-3’. Three nucleotide sequences were inserted into the between NheI and PacI restriction sites of pFH-L lentiviral vector with green fluorescent protein (GFP), named shPTGR1 (S1), shPTGR1 (S2) and shCon.
Cell culture and transfection
Human gastric carcinoma cell line MGC-803 and embryonic kidney cell 293T were purchased from the Cell Bank of the Chinese Academy of Sciences (Shanghai, China) and cultured in RPMI-1640 and Dulbecco’s modified Eagle’s medium (DMEM), respectively, with 10% fetal bovine serum (FBS). Both of them were maintained in a humidified atmosphere containing 5% CO2 at a temperature of 37°C. Then the reconstructed plasmids were transfected into 293T cells with the pHelper of pVSVG-I and pCMVΔR8.92 (Shanghai Hollybio, China). Subsequently, packed lentiviruses were harvested and then stably transfected to MGC-803 cells (6 × 10⁵ cells/well) at a multiplicity of infection (MIO) of 60. Fluorescence microscopy was used to observe the GFP expression and PTGR1 knockdown efficiency was further confirmed by quantitative real-time polymerase chain reaction (qRT-PCR) and western blot analysis.
RNA extraction and qRT-PCR analysis
Total RNAs were extracted from MGC-803 cells infected with shPTGR1 (S1), shPTGR1 (S2) and shCon, respectively, and reverse-transcribed into complementary DNA (cDNA) from 1 μg RNA. Subsequently, primers for PTGR1, including forward: TCCTCCTGTGACCCTTTCGG and reverse: GAAGGCGGCTGGGACTGC, and actin containing forward: GTGGACATCCGCAAAGAC and reverse: AAAGGGTGTAACGCAACTA were designed to perform qRT-PCR analysis on BioRad Connet Real-Time PCR platform. For each PCR reaction, total 20 µl mixture was prepared that included 10 µl 2 × SYBR premix ex Taq, 0.5 µl primers (2.5 µM), 5 µl cDNA and 4.5 µl ddH2O, then using the following amplified procedure: 1 min initial denaturation at 95°C and 40 cycles consisted of 5 s denaturation at 95°C denaturation at 95sted of 5 95cDNA°C. The 2-ΔΔCt formula [18] was used to determine the relative expression of PTGR1.
Protein separation and western blot assay
The MGC-803 cells were collected and lysed in 2X SDS Sample Buffer, containing 10 mM EDTA, 100 mM Tris-Hcl (pH 6.8), 4% SDS and 10% glycine after 5 days’ transfection. The protein extract was detected by bicinchoninic acid (BCA) protein assay. Total 30 µg protein was subjected to polyacrylamide-sodium dodecyl sulfate (SDS-PAGE) electrophoresis, and then transferred onto polyvinylidene fluoride (PVDF) membranes. After blocking with 5% nonfat milk with phosphate-buffered saline with 0.05% Tween (PBST) for 1 h at room temperature, the membranes were blotted with primary antibodies, including rabbit anti-PTGR1 (1:1000, #ap5941c, Abgent), rabbit anti-p21 (1:500, #2947, Cell signaling), mouse anti-p53 (1:1000, sc-126, Santa Cruz) and rabbit anti-GAPDH (1:500000, 10494-1-AP, Proteintech), followed by incubation with HRP-conjugated goat anti-rabbit (1:5000, Santa Cruz, SC-2054). Immunoblot bands were detected by ECL kit (Pierce) according to the manufacture’s instruction.
Cell growth trend analysis by MTT
MGC-803 cells (2000 cells/well) were cultured into 96-well plates after 90 h transfection. Each well was added 20 µl MTT solution (5 mg/ml) and incubated for 4 h at 37°C, and added 100 µl acidic isopropanol (10% SDS, 5% isopropanol and 0.01 mol/L HCl). After removal of the medium, the absorbance of each plate was measured at a wavelength of 592 nm by spectrophotometer.
Colony formation assay used to determine cell proliferation potential
MGC-803 cells were seeded into six-well plates and cultured for 7 days after 120 h transfection with a density of 400 cells per well. According to previously described methods [19], the cells were washed with PBS and fixed in 4% paraformaldehyde, and then stained with crystal purple for 20 min, followed by counting the number of colonies under Fluorescence microscope. Per colony was defined as more than 50 cells.
Cell cycle distribution analysis
MGC-803 cells were seeded into 6 cm dish after 96 h transfection with a density of 1.0 × 10⁶ cells per dish, and then cultured for 4 days to reach 80% confluence. These cells were collected, stained with propidium iodide (PI), and subjected to flow cytometric analysis.
Statistical analysis
All the data were expressed as mean ± standard deviation (SD) using SPSS software. Student’s t-test was used to compare the different values between two groups and a value of P less than 0.05 was considered as significant difference.
Results
shPTGR1 decreased expression of PTGR1 in MGC-803 cells
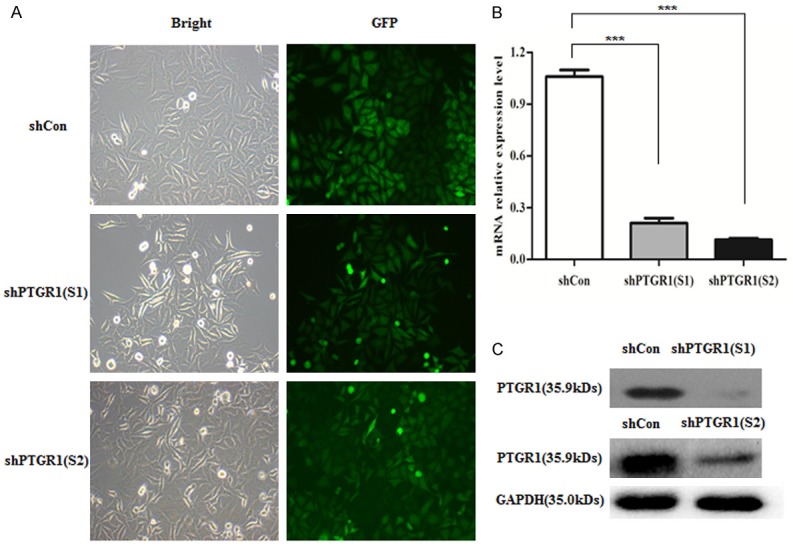
After transfected with shPTGR1, more than 80% cells were observed GFP positive expression, suggesting a higher efficiency recombinant lentivirus (Figure 1A). As shown in Figure 1B, qRT-PCR analysis for PTGR1 showed that there was an 80% and 89% decrease in MGC-803 cells transfected with shPTGR1 (S1) and shPTGR1 (S2) compared with shCon group, respectively, indicating a significant knockdown efficiency (P < 0.001). Further western blot confirmed PTGR1 protein expression was remarkably down regulated in MGC-803 cells transfected with shPTGR1 (S1) and shPTGR1 (S2) compared with shCon group.
Figure 1.

A. Representative images recorded under a fluorescence microscope of MGC-803 cells infected with shPTGR1 at MOI of 60; B, C. Knockdown efficiency of PTGR1 confirmed by quantitative real-time PCR and Western blot assay. ***, P < 0.001.
shPTGR1 suppressed MGC-803 cells’ growth trend
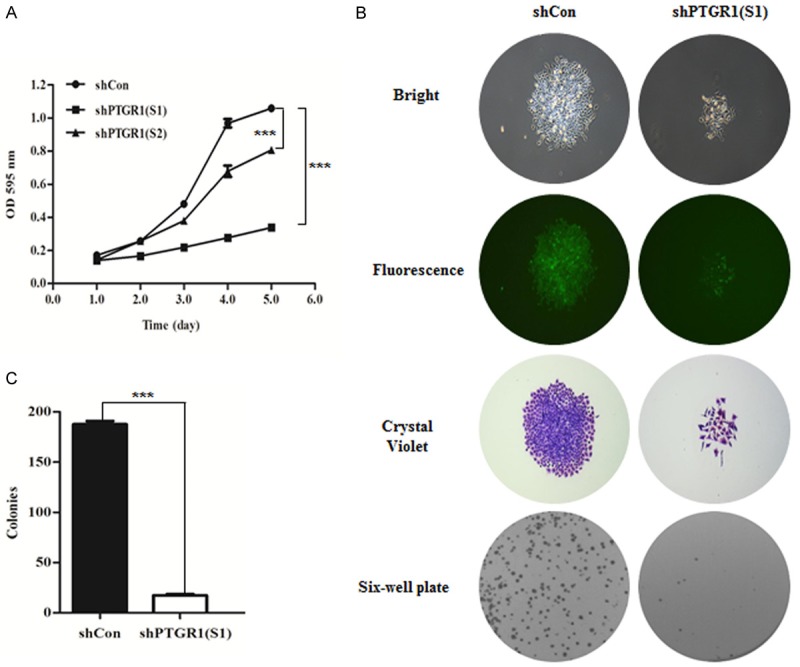
To determine the effect of PTGR1 knockdown on cell growth, MTT assay was conducted. As depicted Figure 2A, the optical density (OD) values of shPTGR1 (S1) and shPTGR1 (S2) infected MGC-803 cells were significantly reduced to 0.339 ± 0.007 and 0.806 ± 0.013, respectively compared with 0.241 ± 0.022 for shCon infected MGC-803 cells at the fifth day transfection, indicating there was an obvious suppressed growth trend in MGC-803 cells transfected with shPTGR1 (S1) and shPTGR1 (S2) compared with shCon group (P < 0.001).
Figure 2.

A. PTGR1 knockdown significantly inhibited MGC-803 cells proliferation confirmed by MTT. B, C. PTGR1 knockdown significantly suppressed colony formation ability in MGC-803 cells confirmed by colony formation assay. ***, P < 0.001.
shPTGR1 inhibited MGC-803 cells’ proliferation potential
To further confirm the PTGR1 knockdown affected cells’ proliferation, colony formation assay was used to the study. As depicted as in Figure 2B, a smaller and fewer colonies were observed in shPTGR1 (S1) infected MGC-803 cells than those in shCon by fluorescence microscope and crystal violet staining. Statistical analysis (Figure 2C) also demonstrated there was a significant proliferation inhibition in MGC-803 cells infected with shPTGR1 (S1), contrasted with those in shCon group (P < 0.001).
shPTGR1 blocked cell cycle progression
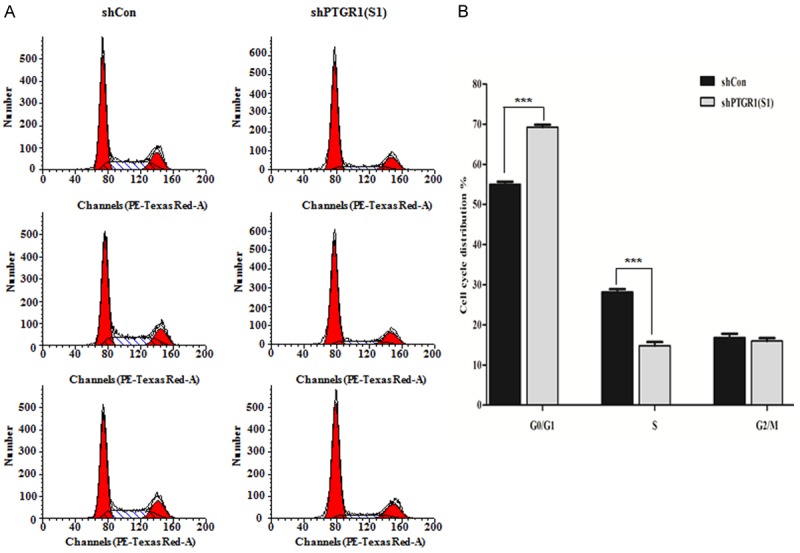
To uncover the cause of the inhibition of PTGR1 knockdown on MGC-803 cells proliferation, flow cytometry was conducted on distinguishing cells in different cell phases. As shown in Figure 3A, there existed an obvious effect on cell cycle progression after PTGR1 knockdown. Data showed the percentage of cells in G0/G1 phase increased from 54.98 ± 0.66 in MGC-803 cells infected with shCon to 69.22 ± 0.63 in MGC-803 cells infected with shPTGR1 (S1), while that in S phase decreased from 28.18 ± 0.71 in MGC-803 cells infected with shCon to 14.8 ± 0.93 MGC-803 cells infected with shPTGR1 (S1). Statistical analysis suggested that knockdown of PTGR1 significantly blocked cell cycle at G0/G1 phase (P < 0.001) (Figure 3B), which may be related with cell proliferation inhibition.
Figure 3.

A. Cell cycle distribution determined by flow cytometer. B. Statistical analysis of cell cycle in the PTGR1 knockdown group of MGC-803. ***, P < 0.001.
Cell cycle regulatory protein analysis using western blot assay
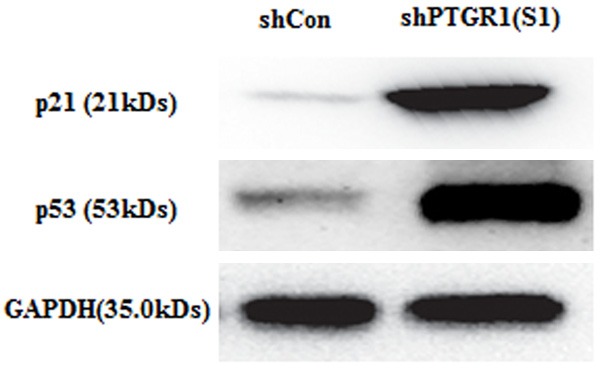
To further explain cell cycle progression resulted from PTGR1 knockdown, cell cycle regulatory proteins, including p21 and p53, were chosen to determine their expression level. Based on the result of western blot, the protein expression of p21 and p53 were obviously up regulated in MGC-803 cells infected with shPTGR1 (S1) compared that in MGC-803 cells infected with shCon (Figure 4).
Figure 4.

Expression analysis of downstream protein, including p21 and p53 using western blot assay.
Discussion
PTGR1 has been reported to be involved in many cancers’ progression, including bladder cancer [20], colorectal carcinoma [21]. However, its function in gastric carcinoma was rarely investigated. In the present study, we used RNAi approach to specifically silence the expression of PTGR1 in human gastric carcinoma MGC-803 cells. Our results indicated that down regulation of PTGR1 inhibited cell proliferation in time-dependent manner by MTT assay and suppressed colony formation ability, and the underlying molecular mechanisms might be correlated with cell cycle arrest. Further we found PTGR1 silencing influenced cell-cycle progression, induced G0/G1 phase arrest. Take this fact into account, we therefore turned to study the possible regulatory mechanism of PTGR1 and found cell-cycle arrest accompanied with p53 signaling activation.
Cell growth is mainly regulated by cell cycle control and many cycle regulatory proteins are involved in this process, including p21 and p53 [22]. The p21, as cyclin dependent kinase (CDK) inhibitor, has been demonstrated to play an inhibitory role in expression of CDK4/6, CDK1 and cyclin-CDK2 leading to cell cycle arrested at G1 and S phase [23,24]. The p53 is considered as a tumor suppressor gene with 63 kDa molecular weight and could tightly control the expression of p21 [25]. The accumulation of p53 could lead to cell cycle arrest and apoptosis in colorectal cells [26]. Some literatures pointed out up-regulation of p21 and p53 could arrest cell cycle progression in gastric cancer cells [27,28]. In p53 independent manner, p21 is significantly up regulated by suppressing cyclin-dependent kinase leading cell growth inhibition in gastric cancer cells [29,30]. More importantly, the expression of both p53 and p21 are up regulated in human gastric carcinoma MGC-803 cells dealt with honokiol [31], which is consistent with our results. Related study show that the gene expression level of PTGR1 is increased during cancer development as measured by qRT-PCR and Western blot assay, suggesting it was positively correlated with cancer progression [8]. All these evidences are in line with our results that knockdown of PTGR1 was negatively correlated with gastric cancer development via up regulating tumor suppressor gene, like p21 and p53.
In summary, PTGR1 silencing could significantly suppressed cell proliferation potential along with cell cycle arrest via partially activating p53 signaling and up regulating p21 expression. Based on these preliminary results, it seemed reasonable to highlight PTGR1 could play an important role in the diagnosis and prognosis of gastric carcinoma.
Disclosure of conflict of interest
None.
References
- 1.Zhao P, Dai M, Chen W, Li N. Cancer trends in China. Jpn J Clin Oncol. 2010;40:281–285. doi: 10.1093/jjco/hyp187. [DOI] [PubMed] [Google Scholar]
- 2.DeSantis C, Naishadham D, Jemal A. Cancer statistics for African Americans, 2013. CA Cancer J Clin. 2013;63:151–166. doi: 10.3322/caac.21173. [DOI] [PubMed] [Google Scholar]
- 3.Xiong B, Ma L, Cheng Y, Zhang C. Clinical effectiveness of neoadjuvant chemotherapy in advanced gastric cancer: an updated metaanalysis of randomized controlled trials. Eur J Surg Oncol. 2014;40:1321–1330. doi: 10.1016/j.ejso.2014.01.006. [DOI] [PubMed] [Google Scholar]
- 4.Garcia-Gonzalez MA, Lanas A. Genetic susceptibility and gastric cancer risk: the importance of meta-analyses as a statistical tool. Gastroenterol Hepatol. 2014;37:421–426. doi: 10.1016/j.gastrohep.2014.01.007. [DOI] [PubMed] [Google Scholar]
- 5.Vitturi DA, Chen CS, Woodcock SR, Salvatore SR, Bonacci G, Koenitzer JR, Stewart NA, Wakabayashi N, Kensler TW, Freeman BA. Modulation of Nitro-Fatty Acid Signaling: Prostaglandin Reductase-1 is a Nitroalkene Reductase. Journal of Biological Chemistry. 2013;288:25626–25637. doi: 10.1074/jbc.M113.486282. [DOI] [PMC free article] [PubMed] [Google Scholar]
- 6.Klinbunga S. Molecular characterization and expression of the Prostaglandin reductase 1 gene and protein during ovarian development of the giant tiger shrimp Penaeus monodon. Aquaculture. 2011;322:134–141. [Google Scholar]
- 7.Tai HH, Ensor CM, Tong M, Zhou H, Yan F. Prostaglandin catabolizing enzymes. Prostaglandins Other Lipid Mediat. 2002;68-69:483–493. doi: 10.1016/s0090-6980(02)00050-3. [DOI] [PubMed] [Google Scholar]
- 8.Sánchez-Rodríguez R, Torres-Mena JE, De-La-Luz-Cruz M, Bernal-Ramos GA, Villa-Treviño S, Chagoya-Hazas V, Landero-López L, García-Román R, Rouimi P, Del-Pozo-Yauner L, Meléndez-Zajgla J, Pérez-Carreón JI. Increased expression of prostaglandin reductase 1 in hepatocellular carcinomas from clinical cases and experimental tumors in rats. Int J Biochem Cell Biol. 2014;53:186–194. doi: 10.1016/j.biocel.2014.05.017. [DOI] [PubMed] [Google Scholar]
- 9.DuBois RN. Evaluation of the whole prostaglandin biosynthetic pathway in lung cancer. Clin Cancer Res. 2003;9:1577–1578. [PubMed] [Google Scholar]
- 10.Zhao Y, Weng CC, Min T, Wei J, Tai HH. Restoration of leukotriene B(4)-12-hydroxydehydrogenase/15- oxo-prostaglandin 13-reductase (LTBDH/PGR) expression inhibits lung cancer growth in vitro and in vivo. Lung Cancer. 2010;68:161–169. doi: 10.1016/j.lungcan.2009.06.011. [DOI] [PMC free article] [PubMed] [Google Scholar]
- 11.Sheng H, Shao J, Washington MK, DuBois RN. Prostaglandin E2 increases growth and motility of colorectal carcinoma cells. J Biol Chem. 2001;276:18075–18081. doi: 10.1074/jbc.M009689200. [DOI] [PubMed] [Google Scholar]
- 12.Tong WG, Ding XZ, Talamonti MS, Bell RH, Adrian TE. LTB4 stimulates growth of human pancreatic cancer cells via MAPK and PI-3 kinase pathways. Biochem Biophys Res Commun. 2005;335:949–956. doi: 10.1016/j.bbrc.2005.07.166. [DOI] [PubMed] [Google Scholar]
- 13.Ho DW, Yang ZF, Yi K, Lam CT, Ng MN, Yu WC, Lau J, Wan T, Wang X, Yan Z, Liu H, Zhang Y, Fan ST. Gene expression profiling of liver cancer stem cells by RNA-sequencing. PLoS One. 2012;7:e37159. doi: 10.1371/journal.pone.0037159. [DOI] [PMC free article] [PubMed] [Google Scholar]
- 14.Dick RA, Kwak MK, Sutter TR, Kensler TW. Antioxidative Function and Substrate Specificity of NAD(P)H- dependent Alkenal/one Oxidoreductase. J Biol Chem. 2001;276:40803–40810. doi: 10.1074/jbc.M105487200. [DOI] [PubMed] [Google Scholar]
- 15.Morris KV, Rossi JJ. Lentivirus-mediated RNA interference therapy for human immunodeficiency virus type 1 infection. Human Gene Therapy. 2006;17:479–486. doi: 10.1089/hum.2006.17.479. [DOI] [PubMed] [Google Scholar]
- 16.Sumimoto H, Miyagishi MH, Yamagata S, Shimizu A, Taira K, Kawakami Y. Inhibition of growth and invasive ability of melanoma by inactivation of mutated BRAF with lentivirusmediated RNA interference. Oncogene. 2004;23:6031–6039. doi: 10.1038/sj.onc.1207812. [DOI] [PubMed] [Google Scholar]
- 17.Hongxu L, Daiwang S, Tieqin L, Zhanwu Y, Chuanjiang Z. Lentivirus-mediated silencing of SCIN inhibits proliferation of human lung carcinoma cells. Gene. 2015;554:32–39. doi: 10.1016/j.gene.2014.10.013. [DOI] [PubMed] [Google Scholar]
- 18.Arocho A, Chen B, Ladanyi M, Pan Q. Validation of the 2-ΔΔCt Calculation as an Alternate Method of Data Analysis for Quantitative PCR of BCR-ABL P210 Transcripts. Diagn Mol Pathol. 2006;15:56–61. doi: 10.1097/00019606-200603000-00009. [DOI] [PubMed] [Google Scholar]
- 19.Wang X, Wang H, Ji F, Zhao S, Fang X. Lentivirus-Mediated Knockdown of CUGBP1 Suppresses Gastric Cancer Cell Proliferation In Vitro. Appl Biochem Biotechnol. 2014;173:1529–1536. doi: 10.1007/s12010-014-0937-8. [DOI] [PubMed] [Google Scholar]
- 20.Tapak L, Saidijam M, Sadeghifar M, Poorolajal J, Mahjub H. Competing Risks Data Analysis with High-dimensional Covariates: An Application in Bladder Cancer. Genomics Proteomics Bioinformatics. 2015;13:169–76. doi: 10.1016/j.gpb.2015.04.001. [DOI] [PMC free article] [PubMed] [Google Scholar]
- 21.Erzinger MM, Bovet C, Uzozie A, Sturla SJ. Induction of complementary function reductase enzymes in colon cancer cells by dithiole-3-thione versus sodium selenite. J Biochem Mol Toxicol. 2015;29:10–20. doi: 10.1002/jbt.21601. [DOI] [PubMed] [Google Scholar]
- 22.Lai YJ, Lin CI, Wang CL, Chao JI. Expression of survivin and p53 modulates honokiol-induced apoptosis in colorectal cancer cells. J Cell Biochem. 2014;115:1888–1899. doi: 10.1002/jcb.24858. [DOI] [PubMed] [Google Scholar]
- 23.Gartel AL, Radhakrishnan SK. Lost in transcription: p21 repression, mechanisms, and consequences. Cancer Res. 2005;65:3980–3985. doi: 10.1158/0008-5472.CAN-04-3995. [DOI] [PubMed] [Google Scholar]
- 24.Wang J, Wang X, Wu G, Hou D, Qi H. MiR-365b-3p, down-regulated in retinoblastoma, regulates cell cycle progression and apoptosis of human retinoblastoma cells by targeting PAX6. FEBS Lett. 2013;587:1779–1786. doi: 10.1016/j.febslet.2013.04.029. [DOI] [PubMed] [Google Scholar]
- 25.Rodriguez R, Meuth M. Chk1 and p21 cooperate to prevent apoptosis during DNA replication fork stress. Mol Biol Cell. 2006;17:402–12. doi: 10.1091/mbc.E05-07-0594. [DOI] [PMC free article] [PubMed] [Google Scholar]
- 26.Wang T, Chen F, Chen Z, Wu YF, Xu XL, Zheng S, Hu X. Honokiol induces apoptosis through p53-independent pathway in human colorectal cell line RKO. World J Gastroenterol. 2004;10:2205–2208. doi: 10.3748/wjg.v10.i15.2205. [DOI] [PMC free article] [PubMed] [Google Scholar]
- 27.Zhang LN, Yan YB. Depletion of poly(A)-specific ribonuclease (PARN) inhibits proliferation of human gastric cancer cells by blocking cell cycle progression. Biochim Biophys Acta. 2015;1853:522–534. doi: 10.1016/j.bbamcr.2014.12.004. [DOI] [PubMed] [Google Scholar]
- 28.Jiang X, Wong B, Lin M, Zhu G, Kung H, Jiang S, Yang D, Lam S. Functional p53 is required for triptolide-induced apoptosis and AP-1 and nuclear factor-kappaB activation in gastric cancer cells. Oncogene. 2001;20:8009–8018. doi: 10.1038/sj.onc.1204981. [DOI] [PubMed] [Google Scholar]
- 29.Kim S, Kim DH, Lee SH, Kim MJ, Yoon JH, Chung HY, Na CS, Kim ND. Urushiol Induces Apoptosis via a p53-dependent Pathway in Human Gastric Cancer Cells. J Cancer Prev. 2013;18:169–176. doi: 10.15430/JCP.2013.18.2.169. [DOI] [PMC free article] [PubMed] [Google Scholar]
- 30.Yuan CX, Zhou ZW, Yang YX, He ZX, Zhang X, Wang D, Yang T, Wang NJ, Zhao RJ, Zhou SF. Inhibition of mitotic Aurora kinase A by alisertib induces apoptosis and autophagy of human gastric cancer AGS and NCI-N78 cells. Drug Des Devel Ther. 2015;9:487–508. doi: 10.2147/DDDT.S74127. [DOI] [PMC free article] [PubMed] [Google Scholar] [Retracted]
- 31.Yan B, Peng ZY. Honokiol induces cell cycle arrest and apoptosis in human gastric carcinoma MGC-803 cell line. Int J Clin Exp Med. 2015;8:5454–5461. [PMC free article] [PubMed] [Google Scholar]


