

Abstract
N-acetyltransferase 10 (NAT10) is a nucleolar protein involved in histone acetylation, telomerase activity regulation, DNA damage response and cytokinesis. The expression of NAT10 was found to be enhanced in several types of tumors, suggesting its correlation with tumor development. However, the specific role of NAT10 in hepatocellular carcinoma (HCC) is still unclear. The aim of this study was to investigate the expression of NAT10 in HCC patients and to assess the relationship of NAT10 expression with clinicopathological characteristics and tumor prognosis. We selected 17 pairs of HCC samples and adjacent non-neoplastic tissue for mRNA expression analysis. We also performed immunohistochemistry in 186 HCC samples to evaluate the NAT10 protein expression. Cox regression and Kaplan-Meier analysis was used to study the diagnostic and prognostic value of NAT10. The results showed that NAT10 expression was mainly localized in the nuclei/nucleoli and was significantly higher in HCC tissues than peritumoral tissues (P < 0.01). High NAT10 expression was positively correlated with histological differentiation (P < 0.01) and TNM classification (P < 0.01). Cox regression univariate and multivariable analysis revealed that expression of NAT10 in HCC was an independent prognostic factor for patient survival time. Our data suggested that NAT10 might be a promising prognostic marker and potential therapeutic target in HCC.
Keywords: NAT10, prognosis, hepatocellular carcinoma
Introduction
Hepatocellular carcinoma (HCC) is one of the most common cancers in the world and is also with rapidly increased disease incidence [1,2]. Every year more than half of million patients are diagnosed with HCC worldwide. Epidemiologic study has showed that around 80% of HCC are found in the developing countries and China alone accounts for more than half of the number [3]. HCC generally shows intrahepatic multiple occurrence and intrahepatic metastasis. About 30 to 50% of HCC patients have extrahepatic metastasis and the extrahepatic metastasis of HCC is mostly found in the lung [4]. The prognosis of HCC is still very poor, only with a 5-year survival of 11%. The only potentially effective therapy is hepatectomy or orthotopic liver transplantation. However, most of HCC patients are usually diagnosed at advanced stages when surgical treatment are ineffective and these patients can only go for palliative treatments like transarterial chemoembolization (TACE), radiotherapy, systemic chemotherapy and immunotherapy [5,6]. Distinguishing biomarkers for the early detection and prognosis of HCC is therefore necessarily required.
NAT10 (N-acetyltransferase 10 or hALP, human N-acetyltransferase-like protein) was primarily found as an enhancer for telomerase activity by stimulating the transcription of hTERT [7]. This protein is consisted of 872 amino acids with acetyltransferase domain and a lysine-rich C-terminus. In other studies, NAT10 was found to be involved in histone and microtubule modification [8,9]. NAT10 also participated in DNA damage response [10]. NAT10 expression was found in various types of human cancers and mainly showed nuclear/nucleolar staining. Although NAT10 may play an important role in carcinogenesis, there is no report on its role in tumorigenesis and progression of HCC. To explore the exact role of NAT10 in HCC, we examined the expression of NAT10 in HCC and adjacent non-tumor liver tissues. In addition, we investigated the correlation of NAT10 expression level in HCC with clinicopathological characteristics and prognosis.
Materials and methods
Patients and tissue specimens
Formalin-fixed, paraffin-embedded materials from 186 liver cancer patients were collected from the Department of Pathology, the First Affiliated Hospital, College of Medicine, Zhejiang University. The clinical and pathological data was reviewed from impatient medical records and summarized in Table 1. The median follow-up period was 49 months (range from 5-78 months). The stages of all patients’ disease were classified based on the TNM classification. Additionally, 17 pairs of liver cancer tissues and matched adjacent normal tissue blocks were selected for NAT10 expression comparison. This study was approved by the Hospital Ethics Committee.
Table 1.
Correlation between patient’s clinicopathologic features and the expression of NAT10 protein
| Groups | No. | Nuclear staining of NAT-10 | Pearson X2 | P value | |
|---|---|---|---|---|---|
|
| |||||
| High expression (%) | Low expression (%) | ||||
| Total | 186 | 118 (63.4) | 68 (36.6) | ||
| Age | |||||
| < 50 | 43 | 25 (58.1) | 18 (41.9) | 0.68 | > 0.05 |
| ≥ 50 | 143 | 93 (65.0) | 50 (35.0) | ||
| Gender | |||||
| Male | 105 | 66 (62.9) | 39 (37.1) | 0.04 | > 0.05 |
| Female | 81 | 52 (64.2) | 29 (35.8) | ||
| Tumor size | |||||
| < 3 cm | 99 | 61 (61.6) | 38 (38.4) | 0.30 | > 0.05 |
| ≥ 3 cm | 87 | 57 (65.5) | 30 (34.5) | ||
| Histological differentiation | |||||
| Well | 55 | 15 (27.3) | 40 (72.7) | 60.16 | < 0.01 |
| Moderately | 70 | 44 (62.9) | 26 (37.1) | ||
| Poorly | 61 | 59 (96.7) | 2 (3.3) | ||
| Hepatic cirrhosis | |||||
| No | 35 | 18 (51.4) | 17 (48.6) | 2.68 | > 0.05 |
| Yes | 151 | 100 (66.2) | 51 (33.8) | ||
| TNM classification | |||||
| I | 51 | 19 (37.3) | 32 (62.7) | 38.31 | < 0.01 |
| II | 65 | 36 (55.4) | 29 (44.6) | ||
| III | 43 | 38 (88.4) | 5 (11.6) | ||
| IV | 27 | 25 (92.6) | 2 (7.4) | ||
RNA extraction and quantitative PCR
RNA from mentioned 17 pairs of tissue blocks were extracted using TRIzol solution (Invitrogen, USA) according to the manufacturer’s instruction. Isolated RNA concentration was then determined using the NanoDrop ND-1000 spectrophometer (NanoDrop Technologies, USA). The RNA underwent reverse transcription with the program of 30 min at 16°C, 30 min at 42°C and 5 min at 85°C. Afterwards, the cDNA was subjected to quantitative PCR for NAT10 mRNA expression level evaluation with the GAPDH as the internal control. NAT10 forward primer: 5’-GGGATTGGCCTGCAGCATA-3’, backward primer: 5’-GGCTCCATGACCACATCCTT-3’. GAPDH forward primer: 5’-CTCTGGTAAAGTGGATATTGT-3’, backward primer: 5’-GGTGGAATVATATTGGAACA-3’. Quantitative PCR was using the SYBR Green Master Mix (Applied Biosystems, Foster City, Calif) and running under the program: 95°C for 10 min, followed by 40 cycles of 95°C for 15 s and 60°C for 1 min.
Immunohistochemical staining
Section from each block was cut at a thickness of 4 μm and deparaffinized in xylene, and rehydrated in a descending alcohol series. Antigen retrieval was performed by pressurized heating in 10 mmol/L citrate buffer (pH 6.0). The endogenous peroxidase activity was blocked with 0.3% H2O2 for 15 min and then incubated in 5% serum to reduce non-specific binding. Afterwards, sections were incubated with primary mouse monoclonal anti-NAT10 antibody (Santa Cruz Biolotechnology, USA; 1:1000) at 4°C for overnight. On the next day after washing in phosphate-buffered saline (PBS), the slides were incubated with horseradishperoxidase-conjugated rabbit-anti-mouse secondary antibody and colorized with 3,3-diaminobenzidine (DAB) chromogen solution. All the slides were counterstained with Mayer hematoxylin. Negative controls were running at the same time by replacing the primary antibody to nonimmune serum.
Evaluation of immunohistochemical staining
The immunostained sections were examined independently by two pathologists blinded to the clinical data. The final data of NAT10 expression was the average score evaluated by the two pathologists. The staining intensity was graded as follows: 1 for weak staining; 2 for moderate staining; 3 for strong staining. The proportion of NAT10 positive cells was scored according to four criteria: 0 for no positive cells; 1 for < 10% positive cells; 2 for 10-50% positive cells; 3 for 51-80% positive cells and 4 for > 80% positive cells. Staining index was calculated as the multiplication of staining intensity score and the proportion of NAT10 positive cells. A cut-off value of 6 was set to differentiate low and high NAT10 expression.
Statistical analysis
Statistical analysis was performed using the SPSS statistics software (Version 18.0, Chicago) and Excel 2007. The correlation of NAT10 expression with clinicopathological features was studied via Chi-square test. The overall survival (OS) and disease-free survival (DFS) were used to evaluate the influence of the NAT10 expression on patient prognosis. Both OS and DFS curves were plotted using the Kaplan-Meier method and log-rank test. Univariate and multivariate regression analysis were carried out using the Cox proportional hazards regression model to examine the independent factors involved in tumor prognosis. A P value < 0.05 was considered as to be statistically significant.
Results
Localization of NAT10 in HCC
In this study, NAT10 showed major the nuclear and nucleolar staining and the immunostaining pattern of NAT10 in tumor cells was generally intenser than nonneoplastic cells. In addition, the expression of NAT10 in HCC was also altered which the staining was mainly seen in nucleoplasma whereas the peritumoral tissues showed only nucleolar staining (Figure 1). In details, 165 of 186 (88.7%) HCC samples showed NAT10 nuclear expression. The left 21 HCC samples had only nucleolar expression of NAT10 but the signal was obviously intenser than surrounding normal tissue. Moreover, 16 of this 21 HCC samples were pathologically classified as well-differentiated tumor. Unexpectedly, 12 out of 165 cases also showed membranous staining of NAT10 and these 12 cases were all morphologically poorly-differentiated HCC. In addition, the membranous-expressed NAT10 was mostly found in the invasive front of infiltrating tumor cells. In 89 peritumoral tissues, only 9 samples (10.1%) showed weak nuclear staining (other 80 samples showed only nucleolar staining). There was significantly difference in nuclear staining between HCC and peritumoral tissues (X2 = 160.12, P < 0.01).
Figure 1.
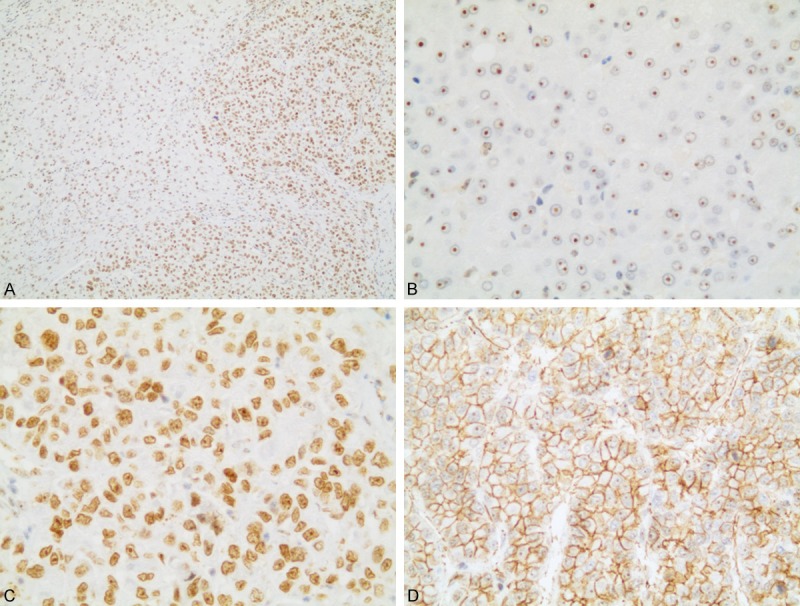
Representative immunohistochemical staining of NAT10 protein in HCC and peritumoral tissues. A. Immunostaining pattern of NAT10 in tumor cells was more intense than nonneoplastic cells. B. Peritumoral tissues showed only nucleolar staining. C. HCC tissues showed strong nuclear staining. D. High NAT10 expression in membranous of poorly-differentiated tumor cells (A. 100×, B, C. 400×, D. 200× magnification).
NAT10 mRNA expression in HCC and peritumoural tissue
Quantitative PCR was carried out to evaluated NAT10 mRNA expression level and we selected 17 pairs of HCC tissue and peritumoural tissue. As illustrated in Figure 2, the expression level of NAT10 in HCC tissue was significantly higher than the adjacent normal tissue (P < 0.001).
Figure 2.
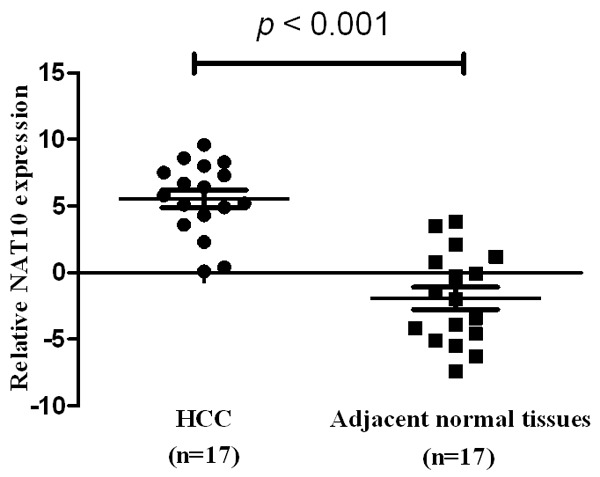
Real-time quantitative PCR analysis of NAT10 expression in HCC and adjacent normal tissue. Normalized to GAPDH mRNA levels, the expression level of NAT10 in HCC was significantly higher than the adjacent normal tissue (P < 0.001).
Relationship of NAT10 expression with clinical features
In order to verify the clinical significance of NAT10 in HCC patients, the correlation of NAT10 expression with clinic-pathologic variables was assessed. As illustrated in Table 1, we found a statistically significant correlation between NAT10 expression with histological differentiation (X2 = 60.16, P < 0.01), and TNM classification (X2 = 38.31, P < 0.01). In contrast, no statistically significant association was found for gender, age, tumor size and hepatic cirrhosis.
Association of NAT10 expression with patient survival time
Univatiate Cox regression analysis indicated that tumor size (P = 0.012), TNM classification (P = 0.001) and NAT10 expression (P = 0.002) were all significantly correlated with lifespan of HCC patients. These three factors were then further analyzed in a multivariable test. The analysis showed that high NAT10 expression (P=0.005) and TNM classification (P = 0.026) were found to be independent prognostic factors (Table 2). The data strongly supported that NAT10 can be a potential prognostic marker for patient with HCC. Moreover, the Kaplan-Meier survival curves also indicated that high NAT10 expression in HCC tissue had significantly shorter survival time compared to HCC with no or low NAT10 expression (Figure 3).
Table 2.
Univariate and multivariable analyses of prognostic factors in HCC for 5-year survival
| Variable | Univariate analysis | Multivariable analysis | ||||
|---|---|---|---|---|---|---|
|
| ||||||
| HR | P value | 95% CI | HR | P value | 95% CI | |
| Age | ||||||
| < 50 versus ≥ 50 | 0.916 | 0.806 | 0.430-1.425 | |||
| Gender | ||||||
| Male versus female | 1.002 | 0.796 | 0.581-1.536 | |||
| Tumor size | ||||||
| < 3 cm versus ≥ 3 cm | 2.940 | 0.012* | 1.315-5.876 | 1.189 | 0.076 | 0.813-1.386 |
| Differentiation | ||||||
| Well and mod versus poorly | 1.128 | 0.563 | 0.801-1.762 | |||
| Hepatic cirrhosis | ||||||
| No versus yes | 1.101 | 0.692 | 0.636-1.606 | |||
| TNM classification | ||||||
| Stage I/II versus stage III/IV | 5.455 | 0.001* | 1.963-6.623 | 1.523 | 0.026* | 1.102-2.103 |
| Nuclear expression of NAT10 | ||||||
| High versus low | 3.261 | 0.002* | 1.366-4.523 | 2.469 | 0.005* | 1.563-3.788 |
CI, confidence interval; HR, hazard ratio;
Significant different.
Figure 3.
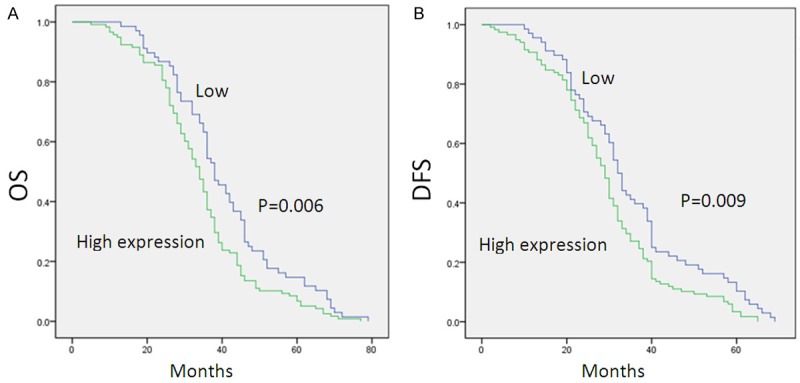
Correlation between expression level of NAT10 and patient’s survival. Patients with high NAT10 expression were closely correlated with poorer overall (OS) (A) and disease-free survival (DFS) (B).
Discussion
Accumulating evidences had showed that the key reasons for malignant tumor development were closely linked to genes that monitor cellular differentiation, developmental processes and senescence during usual growth [11]. Therefore, finding and developing these specific and sensitive molecular biomarkers are beneficial for disease management. Up to date, increasing number of genes have been identified which are involved in hepatocellular carcinoma development [12,13]. Although NAT10 expression is found in various types of tumors and may play an important role in carcinogenesis, its role in tumorigenesis and progression of HCC is still unclear. Our study demonstrated the clinicopathological significance of NAT10 expression in HCC.
In this study, we first analyzed the expression of NAT10 mRNA in HCC and adjacent noncancerous tissues and found a significantly higher mRNA level in HCC samples. We then carried out the immunohistochemical staining to visualize NAT10 expression and observed increased expression of NAT10 in HCC tissues. We also found nucleoplasmic and even cytoplasmic expression of NAT10 in HCC samples while the normal tissue only showed nucleolar staining. Intriguingly, we found that expression of NAT10 was correlated with poor clinical survival of HCC patients which indicating that cells with high level of NAT10 might progress faster and be more aggressive. These findings indicated that NAT10 expression in HCC had subcellular redistribution and this alteration was most likely to be involved in carcinogenesis and cancer behaviors.
Notable, the trend of NAT10 expression redistribution from nucleoli to nucleoplasma in HCC seemed to be highly correlated with tumor differentiation stage. The expression of NAT10 was diffusely distributed in the nucleoplasma in poorly-differentiated HCC, whereas in adjacent normal tissue and some well-differentiated HCC samples the expression of NAT10 was only localized in the nucleoli. We had found significant difference in NAT10 expression between tumor and peritumoral tissues, therefore NAT10 could be a supplementary biomarker for malignance discrimination, especially for distinguishing well-differentiated HCC and atypical hyperplasia. Moreover, we also observed cytoplasmic staining of NAT10 in several poorly-differentiated HCC samples, particularly in the invasive front. These findings were consistent with one previous study on NAT10 expression in colorectal carcinoma which the researchers found subcellular redistribution of NAT10 (most of colorectal cancers showed nucleoplasmic NAT10 expression and more than half showed cytoplasmic staining). Additionally, the membranous positive NAT10 was usually found at the invasive front tumor zone in infiltrating nests of colorectal carcinoma and NAT10 membrane expression was correlated with aggressive clinical behavior in colorectal carcinoma [14]. NAT10 over-expression was also observed in various soft tissue sarcomas which correlated with tumor histological grading. In details, the expression of NAT10 was found to be increasing when tumor histological grading was higher, especially in highly aggressive sarcomas [9].
The exact mechanism of NAT10 in tumorogenesis is still unclear. This protein was mainly found in the nucleolus and was involved in nuclear shape maintenance and DNA damage response [15,16]. NAT10 might regulate network organization via microtubules acetylation [8]. Additionally, NAT10 might be involved in DNA damage response and the overexpression of NAT10 in HCC was probably induced by aberrant and abnormal DNA replication in tumor cells [17,18]. Besides, Zhang et al. suggested that in colorectal carcinoma NAT10 was regulated by GSK-3β and was involved in Wnt signaling pathway [14].
This was the first paper that studied the NAT10 expression in HCC and its correlation with disease prognosis. In summary, the NAT10 protein was frequently over-expressed in HCC, particularly in the nuclei. The elevation of NAT10 expression might contribute to the tumorigenesis and cancer development. Therefore NAT10 could be a promising marker for the diagnosis and prognosis of HCC. Further researches on other types of tumors are necessary for a more comprehensive understanding of NAT10 in cancer development.
Acknowledgements
This study was supported by the Foundation for Innovative Research Groups of the National Natural Science Foundation of China, No. 81421062; Major Project of 12th five-year Grassroots Health Suitable Technology Achievements Transformation Engineering in Zhejiang Province, NO. 2013T301-15.
Disclosure of conflict of interest
None.
References
- 1.El-Serag HB. Hepatocellular carcinoma. N Engl J Med. 2011;365:1118–1127. doi: 10.1056/NEJMra1001683. [DOI] [PubMed] [Google Scholar]
- 2.Llovet JM, Pena CE, Lathia CD, Shan M, Meinhardt G, Bruix J SHARP Investigators Study Group. Plasma biomarkers as predictors of outcome in patients with advanced hepatocellular carcinoma. Clin Cancer Res. 2012;18:2290–2300. doi: 10.1158/1078-0432.CCR-11-2175. [DOI] [PubMed] [Google Scholar]
- 3.El-Serag HB, Rudolph KL. Hepatocellular carcinoma: epidemiology and molecular carcinogenesis. Gastroenterology. 2007;132:2557–2576. doi: 10.1053/j.gastro.2007.04.061. [DOI] [PubMed] [Google Scholar]
- 4.Natsuizaka M, Omura T, Akaike T, Kuwata Y, Yamazaki K, Sato T, Karino Y, Toyota J, Suga T, Asaka M. Clinical features of hepatocelular carcinoma with extrahepatic metastasis. J Gastroenterol Hepatol. 2005;20:1781–1787. doi: 10.1111/j.1440-1746.2005.03919.x. [DOI] [PubMed] [Google Scholar]
- 5.Hashimoto T, Minagawa M, Aoki T, Hasegawa K, Sano K, Imamura H, Sugawara Y, Makuuchi M, Kokudo N. Caval invasion by liver tumor is limited. J Am Coll Surg. 2008;207:383–392. doi: 10.1016/j.jamcollsurg.2008.02.017. [DOI] [PubMed] [Google Scholar]
- 6.Kang JY, Choi MS, Kim SJ, Kil JS, Lee JH, Koh KC, Paik SW, Yoo BC. Long-term outcome of preoperative transarterial chemoembolization and hepatic resection in patients with hepatocellular carcinoma. Korean J Hepatol. 2010;16:383–388. doi: 10.3350/kjhep.2010.16.4.383. [DOI] [PMC free article] [PubMed] [Google Scholar]
- 7.Lv JJ, Liu HJ, Wang Q, Tang ZW, Hou L, Zhang B. Molecular cloning of a novel human gene encoding histone acetyltransferase-like protein involved in transcriptional activation of hTERT. Bioche Biophy Res Commun. 2003;311:506–513. doi: 10.1016/j.bbrc.2003.09.235. [DOI] [PubMed] [Google Scholar]
- 8.Larrieu D, Britton S, Demir M, Rodriguez R, Jackson SP. Chemical inhibition of NAT10 corrects defects of laminopathic cells. Science. 2014;344:527–532. doi: 10.1126/science.1252651. [DOI] [PMC free article] [PubMed] [Google Scholar]
- 9.Shen Q, Zheng X, McNutt MA, Guang L, Sun Y, Wang J, Gong Y, Hou L, Zhang B. NAT10, a nucleolar protein, localizes to the midbody and regulates cytokinesis and acetylation of microtubules. Exp Cell Res. 2009;315:1653–1667. doi: 10.1016/j.yexcr.2009.03.007. [DOI] [PubMed] [Google Scholar]
- 10.Liu H, Ling Y, Gong Y, Sun Y, Hou L, Zhang B. DNA damage induces N-acetyltransferase NAT10 gene expression through transcriptional activation. Mol Cell Biochem. 2007;300:249–258. doi: 10.1007/s11010-006-9390-5. [DOI] [PubMed] [Google Scholar]
- 11.Zender L, Villanueva A, Tovar V, Sia D, Chiang DY, Llovet JM. Cancer gene discovery in hepatocellular carcinoma. J Hepatol. 2010;52:921–929. doi: 10.1016/j.jhep.2009.12.034. [DOI] [PMC free article] [PubMed] [Google Scholar]
- 12.Zender L, Xue W, Zuber J, Semighini CP, Krasnitz A, Ma B, Zender P, Kubicka S, Luk JM, Schirmacher P, McCombie WR, Wigler M, Hicks J, Hannon GJ, Powers S, Lowe SW. An oncogenomics-based in vivo RNAi screen identifies tumor suppressors in liver cancer. Cell. 2008;135:852–864. doi: 10.1016/j.cell.2008.09.061. [DOI] [PMC free article] [PubMed] [Google Scholar]
- 13.Horie Y, Suzuki A, Kataoka E, Sasaki T, Hamada K, Sasaki J, Mizuno K, Hasegawa G, Kishimoto H, Iizuka M, Naito M, Enomoto K, Watanabe S, Mak TW, Nakano T. Hepatocyte-specific Pten deficiency results in steatohepatitis and hepatocellular carcinomas. J Clin Invest. 2004;113:1774–1783. doi: 10.1172/JCI20513. [DOI] [PMC free article] [PubMed] [Google Scholar]
- 14.Zhang H, Hou W, Wang HL, Liu HJ, Jia XY, Zheng XZ, Zou YX, Li X, Hou L, McNutt MA, Zhang B. GSK-3β-regulated N-acetyltransferase 10 is involved in colorectal cancer invasion. Clin Cancer Res. 2014;20:4717–4729. doi: 10.1158/1078-0432.CCR-13-3477. [DOI] [PubMed] [Google Scholar]
- 15.Amin MA, Matsunaga S, Ma N, Takata H, Yokoyama M, Uchiyama S, Fukui K. Fibrillarin, a nucleolar protein, is required for normal nuclear morphology and cellular growth in HeLa cells. Biochem Biophys Res Commun. 2007;360:320–326. doi: 10.1016/j.bbrc.2007.06.092. [DOI] [PubMed] [Google Scholar]
- 16.Amin MA, Matsunaga S, Uchiyama S, Fukui K. Depletion of nucleophosmin leads to distortion of nucleolar and nuclear structures in HeLa cells. Biochem J. 2008;415:345–351. doi: 10.1042/BJ20081411. [DOI] [PMC free article] [PubMed] [Google Scholar]
- 17.Trinkle-Mulcahy L, Andrews PD, Wickramasinghe S, Sleeman J, Prescott A, Lam YW, Lyon C, Swedlow JR, Lamond AI. Time-lapse imaging reveals dynamic relocalization of PP1gamma throughout the mammalian cell cycle. Mol Biol Cell. 2013;14:107–117. doi: 10.1091/mbc.E02-07-0376. [DOI] [PMC free article] [PubMed] [Google Scholar]
- 18.Tsvetkov L, Xu X, Li J, Stern DF. Polo-like kinase 1 and Chk2 interact and co-localize to centrosomes and the midbody. J Biol Chem. 2003;278:8468–8475. doi: 10.1074/jbc.M211202200. [DOI] [PubMed] [Google Scholar]