

Key points
Mitochondrial respiration is regulated by multiple elaborate mechanisms.
It has been shown that muscle specific O2 binding protein, Myoglobin (Mb), is localized in mitochondria and interacts with respiratory chain complex IV, suggesting that Mb could be a factor that regulates mitochondrial respiration.
Here, we demonstrate that muscle mitochondrial respiration is improved by Mb overexpression via up‐regulation of complex IV activity in cultured myoblasts; in contrast, suppression of Mb expression induces a decrease in complex IV activity and mitochondrial respiration compared with the overexpression model.
The present data are the first to show the biological significance of mitochondrial Mb as a potential modulator of mitochondrial respiratory capacity.
Abstract
Mitochondria are important organelles for metabolism, and their respiratory capacity is a primary factor in the regulation of energy expenditure. Deficiencies of cytochrome c oxidase complex IV, which reduces O2 in mitochondria, are linked to several diseases, such as mitochondrial myopathy. Moreover, mitochondrial respiration in skeletal muscle tissue tends to be susceptible to complex IV activity. Recently, we showed that the muscle‐specific protein myoglobin (Mb) interacts with complex IV. The precise roles of mitochondrial Mb remain unclear. Here, we demonstrate that Mb facilitates mitochondrial respiratory capacity in skeletal muscles. Although mitochondrial DNA copy numbers were not altered in Mb‐overexpressing myotubes, O2 consumption was greater in these myotubes than that in mock cells (Mock vs. Mb‐Flag::GFP: state 4, 1.00 ± 0.09 vs. 1.77 ± 0.34; state 3, 1.00 ± 0.29; Mock: 1.60 ± 0.53; complex 2‐3‐4: 1.00 ± 0.30 vs. 1.50 ± 0.44; complex IV: 1.00 ± 0.14 vs. 1.87 ± 0.27). This improvement in respiratory capacity could be because of the activation of enzymatic activity of respiratory complexes. Moreover, mitochondrial respiration was up‐regulated in myoblasts transiently overexpressing Mb; complex IV activity was solely activated in Mb‐overexpressing myoblasts, and complex IV activity was decreased in the myoblasts in which Mb expression was suppressed by Mb‐siRNA transfection (Mb vector transfected vs. Mb vector, control siRNA transfected vs. Mb vector, Mb siRNA transfected: 0.15 vs. 0.15 vs. 0.06). Therefore, Mb enhances the enzymatic activity of complex IV to ameliorate mitochondrial respiratory capacity, and could play a pivotal role in skeletal muscle metabolism.
Key points
Mitochondrial respiration is regulated by multiple elaborate mechanisms.
It has been shown that muscle specific O2 binding protein, Myoglobin (Mb), is localized in mitochondria and interacts with respiratory chain complex IV, suggesting that Mb could be a factor that regulates mitochondrial respiration.
Here, we demonstrate that muscle mitochondrial respiration is improved by Mb overexpression via up‐regulation of complex IV activity in cultured myoblasts; in contrast, suppression of Mb expression induces a decrease in complex IV activity and mitochondrial respiration compared with the overexpression model.
The present data are the first to show the biological significance of mitochondrial Mb as a potential modulator of mitochondrial respiratory capacity.
Abbreviations
- COX
cytochrome c oxidase
- COX IV
cytochrome c oxidase subunit IV
- IP
immunoprecipitation
- Mb
myoglobin
- mtDNA
mitochondrial DNA
- nucDNA
nuclear DNA
oxygen pressure
- SCO2 (gene)
synthesis of cytochrome c oxidase 2 (gene)
- SDS‐PAGE
sodium dodecyl sulfate–polyacrylamide gel electrophoresis
- VDAC
voltage‐dependent anion channel
Introduction
Mitochondria produce ATP from ADP by oxidative phosphorylation and serve as a vital power plant of the cell. The chemical reaction pathway involves the critical reduction of molecular oxygen by cytochrome c oxidase (COX) or complex IV. Studies have shown that a deficiency in COX can induce severe diseases, such as Leigh syndrome (Lombes et al. 1991; Adams et al. 1997; Zhu et al. 1998) and mitochondrial myopathy (DiMauro et al. 1980, 1983). In addition, a mutation in the SCO2 (synthesis of cytochrome c oxidase 2) gene, which enables the assembly of complex IV, leads to fatal infantile cardioencephalomyopathy (Papadopoulou et al. 1999). Moreover, cardiac and skeletal muscle mitochondria have distinctive properties regulating respiration via complex IV (Rossignol et al. 1999).
COX has then a pivotal role in maintaining cellular homeostasis and health.
Even though many studies have investigated metabolism during exercise, oxidative metabolism in skeletal muscles still remains poorly understood. A key question focuses on the classic protein myoglobin (Mb), which has oxygen‐binding capacity because of the prosthetic haeme (Gros et al. 2010). Mb releases its O2, when cellular demand exceeds the delivery of the vascular O2 supply and the intracellular drops to a critical level (Molé et al. 1999; Ponganis et al. 2008; Takakura et al. 2010). Although Mb may play important roles in O2 transport, Mb knockout mice remain viable, fertile and exhibit normal exercise capacity (Garry et al. 1998; Flogel et al. 2001). The evidence suggests that Mb may have other functions outside of O2 transport (Shih et al. 2014) or the cell has adapted to the missing Mb by eliciting physiological compensations, such as increased capillary density, abundant antioxidant protein expression, and enhanced mitochondrial gene expression (Grange et al. 2001; Meeson et al. 2001). Our previous studies show that Mb still has an O2 related function under a defined physiological condition. At the onset of muscle contraction, Mb releases O2 immediately (Chung et al. 2005; Takakura et al. 2010), to regulate mitochondrial O2 consumption in skeletal muscles. However, the mechanism still remains unclear.
Because previous studies have shown mitochondrial localization of Mb (Postnikova et al. 2009) and interaction with COX IV, a subunit comprising respiratory complex IV (Yamada et al. 2013), a new hypothesis proposing interaction between mitochondrial protein and Mb (Mito‐Mb) has emerged, which identifies the underlying mechanisms for a direct role for Mb in interacting with complex IV to modulate mitochondrial respiration. Therefore, we hypothesized that the direct Mb interaction in the mitochondria (mito‐Mb) improves complex IV activity. The present study has investigated the effects of mito‐Mb on mitochondrial respiration by manipulating the expression of Mb in cultured skeletal muscle cells. We found that mito‐Mb accelerates mitochondrial respiration following the specific activation of complex IV, which indicates a mitochondria‐specific regulatory role for Mb.
Methods
The experiments in the present study provided two sets of data. One comprises the data for Mb overexpressing myotubes (results shown in Figs 1, 2, 3), and the other is the data for gene modified Mb: Mb overexpressing or Mb suppressing myoblasts (Figs 4, 5, 6, 7). Myotubes were used to investigate the significance of the up‐regulation of Mb during the differentiating period. Because endogenous Mb expression in myoblasts is completely quiescent (Kanatous & Mammen, 2010; Singh et al. 2014), it is possible to analyse the transient effect of Mb gene modification in myoblasts without the effects of endogenous myoglobin. Thus, myotubes and myoblasts were utilized in the present study.
Figure 1.
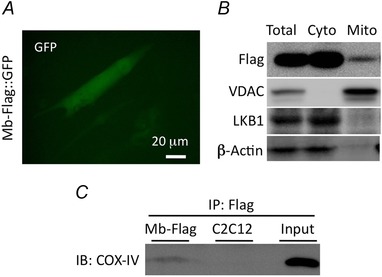
Characterization of C2C12 myotubes with and without Mb‐Flag
A, GFP fluorescent image of differentiated C2C12 cells expressing both Mb‐Flag and the GFP reporter shows a tube‐like morphology. B, immunoblots of the Mb‐Flag expressed cells probing for localization in the cytosol (LKB1 and β‐actin) and in the mitochondria (VDAC). Mb‐Flag was detected in all fractions, localized both in the cytosol and the mitochondria. C, immunoprecipitation with using Flag‐antibody showed that COX IV was immunoprecipatated with Mb‐Flag in stably Mb expressing myotubes.
Figure 2. Mitochondrial respiratory capacity and volume in myotubes that stably express Mb .
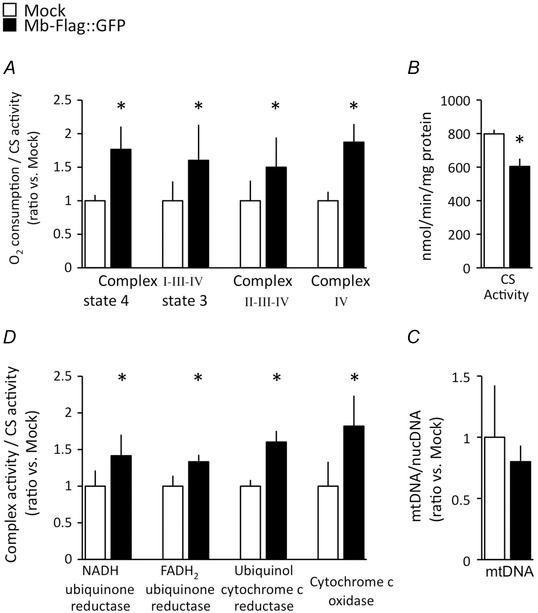
A, mitochondrial O2 consumption was greater in myotubes that stably express Mb than that in Mock cells in each of 3 electron transfer pathways; N = 8, *P < 0.05. B, citrate synthetase (CS) activity was suppressed in Mb‐overexpressing cells as compared with Mock cells; N = 8, *P < 0.05. C, copy numbers of mtDNA were not affected by Mb overexpression; N = 6. D, the enzymatic activity of all respiratory complexes was improved in myotubes that stably express Mb, potentially indicating an underlying mechanism of enhanced mitochondrial respiration; N = 7 and 8, *P < 0.05, mean ± SD.
Figure 3. Comparisons of mitochondrial respiratory complex expression in myotubes that stably express Mb .
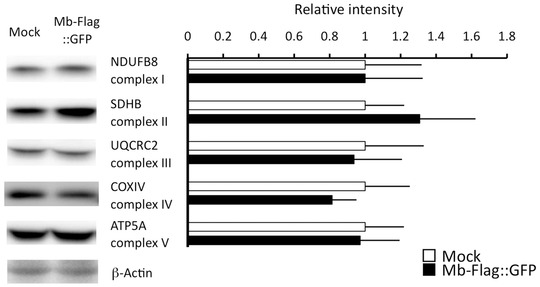
Protein quantities of mitochondrial respiratory complexes were determined in whole cell lysates from Mock or Mb‐overexpressing myotubes using immunoblotting of NDUFB8 (complex I), SDHB (complex II), UQCRC2 (complex III), COXIV (complex IV), and ATP5A (complex V; ATP synthase) proteins; β‐actin expression was determined as a loading control. No significant differences in protein quantities were identified (t test, P < 0.05, N = 5, mean ± SD), indicating that the number of respiratory complexes was not altered by Mb overexpression.
Figure 4. Characterization of myoblasts transiently expressing Mb .
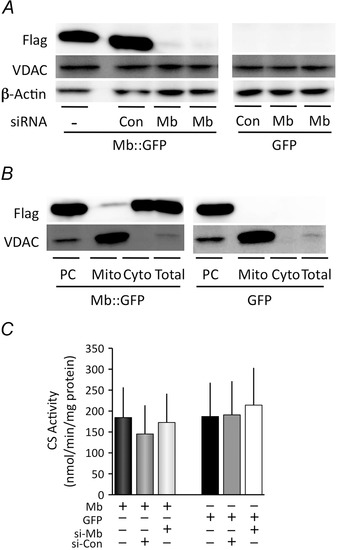
A, Mb‐Flag expression was determined using immunoblotting. Transient modification of Mb gene expression in myoblasts was achieved by transfection with an Mb vector, a control siRNA, and an Mb siRNA. Mb‐Flag expression was confirmed in Mb vector‐transfected and Mb vector plus control siRNA‐transfected myoblasts, whereas it was significantly decreased in Mb vector and Mb siRNA‐transfected myoblast. VDAC and β‐actin protein expression was determined as loading controls, and it was not affected by gene modifications even in GFP vector‐transfected myoblasts. B, Mb‐Flag was detected in all fractions, indicating mitochondrial localization of transiently expressed Mb. No Mb‐Flag protein was detected in any fraction of GFP‐transfected myoblasts. C, CS activity did not show any significant differences in each gene modified cell. These results indicated that transient gene modifications did not influence the capacity to produce respiratory substrates; N = 6, mean ± SD.
Figure 5. Comparison of O2 consumption in myoblasts transiently modified with Mb gene .
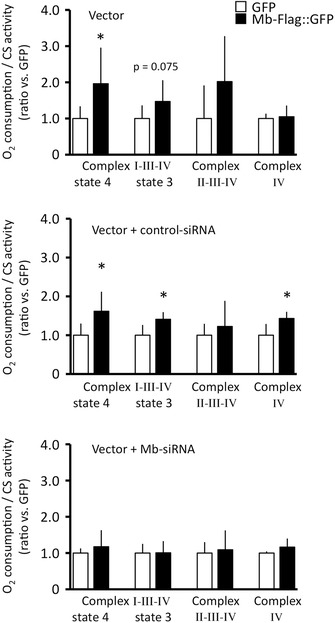
A, transient Mb expression after Mb vector transfection (Mb+, si‐RNA−) improved O2 consumption in myoblasts; State 4 respiration via the complexes I, III and IV was improved, and state 3 respiration showed a slight enhancement in Mb‐overexpressing cells (P = 0. 075). B, Mb overexpression following transfection with Mb vector and control siRNA (Mb+, si‐Con+) also improved O2 consumption in myoblasts, and state 4, state 3 and complex IV‐dependent respiration was significantly promoted. C, mitochondrial O2 consumption in Mb suppressed model by Mb vector and Mb siRNA transfection (Mb+, si‐Mb+) did not show a significant difference compared with O2 consumption in myoblasts transfected with GFP vector and Mb siRNA (GFP+, si‐Mb+). Consequently, mitochondrial respiration is regulated in an Mb‐dependent manner; N = 5–8, mean ± SD; *P < 0.05 vs. GFP at the same respiratory state.
Figure 6. Comparisons of the enzymatic activity of respiratory chain complexes .
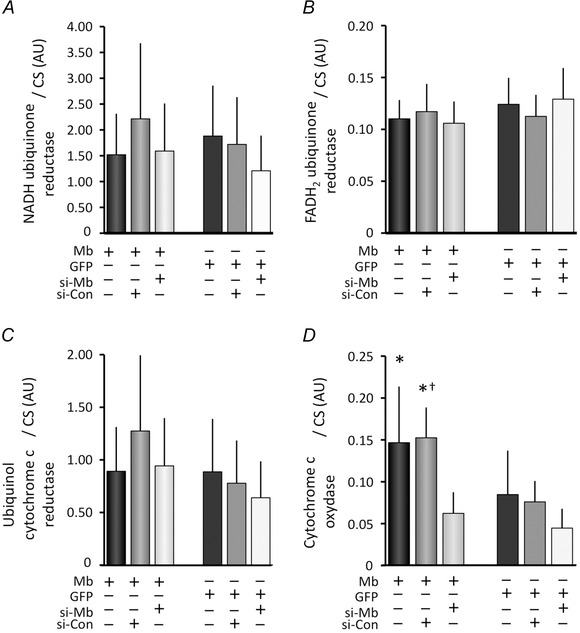
Transient Mb gene modification did not significantly affect enzymatic activities of the NADH‐ubiquinone reductase, FADH2‐ubiquinone reductase, ubiquinol‐cytochrome c reductase (A–C). However, cytochrome c oxidase activity was significantly greater in Mb‐overexpressing myoblasts (Mb+, si‐Con+) than that in GFP‐expressing myoblasts (GFP+, si‐Con+). In addition, the complex IV activity in Mb‐overexpressing myoblasts (Mb+, si‐RNA−) and (Mb+, si‐Con+) was significantly higher than that in Mb suppressed myoblasts (Mb+, si‐Mb+). These data indicate that transient Mb overexpression could improve cytochrome c oxidase activity and the termination of Mb overexpression by siRNA could compromise the activation of cytochrome c oxidase capacity (D); N = 5 and 6, *P < 0.05 vs. (Mb+, si‐Mb+), †P < 0.05 vs. (GFP+, si‐Con+), mean ± SD.
Figure 7. Comparisons of mitochondrial respiratory complex expression in transiently modified myoblasts with Mb gene .
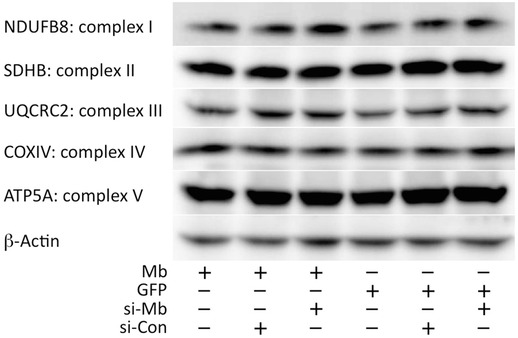
NDUFB8 (complex I), SDHB (complex II), UQCRC2 (complex III), COXIV (complex IV), and ATP5A (complex V; ATP synthase) proteins were detected in whole cell lysates from genetically modified myoblasts, and β‐actin expression was used as a loading control.
Cell culture
C2C12 cells, a cell culture line derived from mice myoblasts, were used for experiments. C2C12 myoblasts can differentiate to form myotubes and produce characteristics of muscle proteins. Cultured myoblasts were grown to confluence in DMEM containing 4.5 mg ml−1 glucose, 10% fetal bovine serum (FBS), 100 IU ml−1 penicillin, and 100 μg ml−1 streptomycin. Confluent myoblast cultures were then exposed to DMEM differentiation medium containing 2% donor bovine serum (DBS) with iron, 100 IU ml−1 penicillin, and 100 μg ml−1 streptomycin; myotubes were formed over a week. Myoblasts and myotubes of cells were then grown at 37°C in a humidified atmosphere with 5% CO2, and they were harvested for experiments.
Plasmid and siRNA design
A pReceiver‐M46 plasmid encoding Flag‐tagged mouse Mb cDNA with internal ribosomal entry site (IRES)‐GFP cDNA (EX‐Mm03786‐M46, GeneCopoeia, MD, USA) was purchased commercially, and siRNAs were designed to interfere with Mb expression using siDirect (http://sidirect2.rnai.jp/). Mb siRNA was selected from the mouse Mb open reading frame (ORF). The sequence of Mb siRNA originated from GATAAGTTTGACAAGTTCA, and was purchased from Nippon Gene (Toyama, Japan). A non‐specific siRNA (control) was also purchased from Nippon Gene.
Transfection and construction of stable cell lines
Plasmids and siRNAs were transfected into C2C12 myoblasts using an Amaxa Nucleofector system (Lonza, Basel, Switzerland) and Ingenio electroporation solution (Mirus, WI, USA) with the program B‐032 for high viability, according to the manufacturer's recommendations. Plasmids and siRNA constructs were added at 10 μg and 20 pmol, respectively, per transfection for all transfections. Transiently transfected myoblasts were harvested for experimentation 48 h after transfection.
To generate myotubes that stably express Mb‐Flag, 10 × 106 C2C12 myoblasts were transfected with 10 μg of plasmid (pReceiver M46) using nucleofector, and they were then plated into 10 cm2 dishes in culture media containing 1.5 mg ml−1 neomycin (WAKO, Osaka, Japan). GFP positive neomycin‐resistant clones were then isolated and analysed for Mb‐Flag expression using Western blotting. Neomycine‐resistant and Mb‐Flag‐expressing myoblasts were categorized as the cell line that stably expresses Mb. Neomycine‐resistant but not Mb‐Flag‐expressing cell lines were categorized as ‘Mock’ and used as a stable cell line control. The GFP images of the myotubes have a resolution of 1360 × 1024 pixels. A CKX41 microscope (Olympus, Japan) was used for observation, and a DP71 camera (Olympus) was used to take fluorescent images. The exposure time was optimized depending on the negative control.
Cell fractionation
Total cell lysates were homogenized in RIPA buffer containing 25 mm Tris‐HCl (pH 7.6), 150 mm NaCl, 1% NP‐40, 1% sodium deoxycholate, 0.1% SDS, 4 mg l−1 leupeptin, and 1 mm pepstatin A, using a pestle homogenizer (Nippi, Tokyo, Japan). Homogenates were then successively passed through 27‐gauge syringe needles 10 times each and centrifuged at 600 g for 10 min at 4°C to remove debris. Supernatants were then used as total cell lysates in immunoblotting analyses.
Harvested cells were homogenized in lysis buffer containing 20 mm Tris‐HCl (pH 7.4), 50 mm NaCl, 250 mm sucrose, 50 mm NaF, 5 mm sodium pyrophosphate, 1 mm DTT, 4 mg l−1 leupeptin, 50 mg l−1 trypsin inhibitor, 0.1 mm benzamidine, and 0.5 mm PMSF, using a pestle homogenizer to obtain crude fractionated samples. These homogenates were also processed using syringe needle mechanical lysis and centrifugation at 600 g for 10 min at 4°C to remove nuclei and debris. Aliquots of supernatants were used as total cell fractions in immunoblots, and the remaining supernatant was centrifuged at 10,000 g for 30 min at 4°C to precipitate crude mitochondrial fractions. The resulting supernatants were used as the cytosolic fraction in immunoblotting experiments, and mitochondrial pellets were washed initially by resuspension in lysis buffer. Suspensions were then centrifuged at 10,000 g for 30 min at 4°C, washed twice in lysis buffer, and resuspended in lysis buffer containing 1% Triton‐X 100. Finally, supernatants containing mitochondrial protein fractions were obtained after centrifugation at 1100 g for 20 min at room temperature, and were used in immunoblotting experiments after standardization of protein contents.
Immunoblotting
Western blot analysis was performed, as previously described (Yamada et al. 2013). Samples of equal protein contents were loaded and electrophoresed on SDS‐PAGE gels, and proteins were then transferred to PVDF membranes. Subsequently, membranes were incubated in blocking buffer followed by incubation with anti‐voltage‐dependent anion channel 1 (VDAC‐I; ab15895, Abcam, Cambridge, UK), anti‐β‐actin (ab8226, Abcam), anti‐LKB1 (ab58786, Abcam), anti‐COX‐IV (ab14744, Abcam), anti‐Flag (no. 2368, Cell Signalling Technology, MA, USA), or anti‐mitochondrial respiratory complex (ab110413, Abcam) antibodies at 4°C overnight. After exposure to secondary antibody, chemiluminescent signals were visualized using ECL prime reagents (GE Healthcare, NJ, USA). Signal intensities were quantified using Image J imaging software (NIH, MD, USA).
Immunoprecipitation
Mitochondrial fractions were obtained, as described above for immunoblotting. Proteins of the mitochondrial fraction were then divided into 1 ml aliquots of PBS, and Dynabeads (Invitrogen, CA, USA) were added and incubated at 4°C for 1 h. Dynabeads were then collected using magnets, and normal mouse immunoglobulin G (nIgG; sc2343‐B2111, Santa Cruz Biotechnology, CA, USA) was added to supernatants and incubated at 4°C overnight. Samples were then centrifuged at 7000 g for 30 s at 4°C, and aliquots of supernatant were reacted with complexes of Dynabeads and primary antibody against Flag at 4°C overnight. Beads and antibodies complexes were prepared before adding samples. A 60 μl aliquot of beads and 10 μg of Flag antibodies were incubated in a tube to make bead–antibody complexes. Subsequently, pellets were collected using magnets and washed with PBS. Immunoprecipitates were eluted from Dynabeads by incubation in Flag peptide solution (500 mg ml−1) at room temperature for 1 h, and immunoprecipitated (IP) supernatants were analysed using SDS‐PAGE and immunoblotting. Anti‐Flag and anti‐COXIV antibodies were used for Mb‐Flag immunoprecipitation and detection, respectively.
Mitochondrial respiration
Measurements of mitochondrial respiration were performed, as described previously (Kuznetsov et al. 2008). Mitochondrial oxygen consumption was monitored using a Oxygraph‐2k (Oroboros, Innsbruck, Austria) at 37°C in a 2 ml thermostatically controlled chamber equipped with polarographic oxygen sensors in respiration buffer containing 0.5 mm EGTA, 3 mm MgCl2.6H2O, 20 mm taurine, 10 mm KH2PO4, 20 mm Hepes, 1 g l−1 BSA, 60 mm potassium‐lactobionate, 110 mm mannitol, and 0.3 mm dithiothreitol (pH was adjusted to 7.1 using 5 n KOH). This buffer was sterilized by filtration through a 0.45 μm filter. Malate (5 mm) and glutamate (10 mm) were then added to induce state 4 respiration, which is dependent on the complexes I, III and IV. ADP (1 mm) was added to the chambers to induce state 3 respiration, and after inhibition with 0.5 μm rotenone, 10 mm succinate was added to activate respiration via complexes II, III, and IV. Subsequently, antimycin A (5 μm) was added to the chambers to stop respiration, and COX IV‐dependent O2 consumption was monitored after the addition of 0.5 mm TMPD and 2 mm ascorbate. TMPD was added after addition of ascorbate to the chamber to avoid oxidation, and chemical background fluxes in the chamber due to autoxidation of TMPD/ascorbate were determined before the experiment, in the absence of biological material, and used for corresponding correction.
Mitochondrial enzyme activity
Enzymatic activities were assessed using a spectrophotometer on the basis of a previously described protocol (Spinazzi et al. 2012). Oxidation of NADH (10 mm) by complex I (NADH‐ubiquinone reductase) was recorded using the ubiquinone analogue decylubiquinone (10 mm) as an electron acceptor. Oxidation of succinate (400 mm) by complex II (FADH2‐ubiquinone reductase) was determined using decylubiquinone as an electron acceptor. Oxidation of decylubiquinol (10 mm) by complex III (ubiquinol‐cytochrome c reductase) was determined using oxidized cytochrome c as an electron acceptor. Complex IV (cytochrome c oxidase) activity was determined using reduced cytochrome c as a substrate and O2 (dissolved oxygen in cuvettes) as an acceptor (Rossignol et al. 1999). Citrate synthetase (CS) activity was measured using a spectrophotometer, as previously described (Spinazzi et al. 2012). All enzymatic activities were measured at 37°C in final volumes of 1 ml, and they were expressed in nanomoles of the product formed per minute per milligram of mitochondrial protein, and normalized to CS activity.
Mitochondrial DNA (mtDNA) copy number
MtDNA copy numbers were determined using real‐time PCR, as previously reported (Philp et al. 2011). Total DNA was isolated using DNeasy blood and tissue kits (Qiagen, Venlo, Netherlands), and real‐time PCR was performed using Platinum SYBR Green qPCR Supermix‐UDG (Takara Bio, Tokyo, Japan). Subsequently, RT‐PCR was performed using specific primers for mitochondrial (cytochrome b Fwd, 5′‐TTCGCAGTCATAGCCACAG‐3′; Rev, 5′‐AGATGAAGTGGAAAGCGAAG‐3′) or nuclear (β‐globulin Fwd, 5′‐TGCCATCCCATCACAACAAG‐3′; Rev, 5′‐GCCAATACACAGGTCACAGAG‐3′) encoded genes. Relative mtDNA contents were calculated according to the CT method with genomic DNA as an internal standard using the 7500 System SDS Software (Version 1.2.1.22, Applied Biosystems, CA, USA).
Statistical analysis
All data are expressed as means ± standard deviations (SD). Multiple comparisons of variables were performed using one‐way ANOVA, and Turkey–Kramer post hoc tests were conducted if significant differences were identified by ANOVA. Student's t tests were used to identify pairwise differences between groups and differences were considered significant when P < 0.05.
Results
Characterization of stable cell lines
Profiles of stable cell lines were assessed using imaging and biochemical analyses. Myotubes that stably expressed Mb had tube‐like morphology and showed green fluorescence from the reporter GFP (Fig. 1 A). Mb‐Flag expression in myotubes was confirmed by immunoblotting using a Flag antibody, and localization in mitochondrial fractions was observed. LKB1, β‐actin and VDAC protein expressions were used as cytosolic and mitochondrial markers, respectively (Fig. 1 B), and COXIV was detected in immunoprecipitates of mitochondrial Mb‐Flag‐expressing cells, but not in C2C12 cells (Fig. 1 C). Even though COXIV also interacts with endogenous Mb in Mb‐Flag‐expressing and ‘Mock’ myotubes, Mb‐Flag does not express in Mock (data not shown). Therefore, the amount of Mb that interacts with COXIV should be increased in myotubes stably overexpressing Mb as compared with Mock. These data indicate that mitochondrial Mb‐Flag interacts with COXIV in myotubes that stably express Mb.
Mitochondrial respiratory capacity in stable cell lines
In subsequent experiments, we analysed the respiratory capacity of mitochondria in Mb‐overexpressing myotubes to test the hypothesis that interactions of Mito‐Mb with complex IV facilitate mitochondrial respiration. Mb overexpression enhanced mitochondrial respiratory capacity, but it did not influence the number of mitochondria in myotubes. Mitochondrial O2 consumption relative to CS activity was elevated in Mb‐overexpressing myotubes (Fig. 2 A), and was mediated by electron transfer from glutamate and malate via complexes I, III and IV (means ± SD of raw data for O2 consumption/CS activity in myotubes are represented as follows: state 4 respiration of Mb‐Flag::GFP, 0.07 ± 0.01, Mock, 0.04 ± 0.01; state 3 respiration of Mb‐Flag::GFP, 0.26 ± 0.09; Mock, 0.16 ± 0.05), from succinate via complexes II, III and IV (Mb‐Flag::GFP, 0.23 ± 0.07; Mock, 0.15 ± 0.05), and from ascorbate and TMPD via complex IV‐dependent respiration (Mb‐Flag::GFP, 0.60 ± 0.09; Mock, 0.32 ± 0.04) (Fig. 2 A).
Mb‐overexpressing myotubes do not significantly increase the amount of mitochondrial enzyme but do increase the activities of respiratory enzymes (Fig. 2 C and D). Specifically, the activities of NADH‐ubiquinone reductase, FADH2‐ubiquinone reductase, ubiquinol‐cytochrome c reductase, and cytochrome c oxidase increase in Mb‐overexpressing cells (Fig. 2 D). However, CS activity decreases significantly. mtDNA copy numbers also do not change in Mb‐overexpressing myotubes (means ± SD of raw data for mtDNA copy number are represented as follows; Mb‐Flag::GFP, (30.7 × 10³) ± (5.1 × 10³); Mock, (38.4 × 10³) ± (16.3 × 10³)) (Fig. 2 B and C).
These data indicate that Mb overexpression enhances mitochondrial respiratory capacity per mitochondria, and then decreases the substrate supply for mitochondrial respiration via the TCA cycle. This observation suggests that the efficiency of ADP to ATP conversion per energy substrate has improved in Mb‐overexpressing myotubes. Moreover, the enhanced mitochondrial respiratory complex activities do not correlate with any increase in the quantity of respiratory chain complexes (Fig. 3), which remain stable in these experiments (means ± SD of raw data for immunoblotting (protein of interest/actin) are represented as follows; NDUFB8: Mb‐Flag::GFP, 0.52 ± 0.17; Mock, 0.52 ± 0.17; SDHB: Mb‐Flag::GFP, 1.10 ± 0.26; Mock, 0.84 ± 0.19; UQCRC2: Mb‐Flag::GFP, 0.57 ± 0.16; Mock, 0.61 ± 0.20; COXIV: Mb‐Flag::GFP, 1.27 ± 0.21; Mock, 1.56 ± 0.39; ATP5A: Mb‐Flag::GFP, 1.18 ± 0.27; Mock, 1.22 ± 0.27). In summary, Mb overexpression appears to improve the efficiency of ATP production in skeletal muscle cells and suggests that Mb contributes to enhancing an effective mitochondrial respiratory capacity.
Characterization of transient Mb expression in myoblasts
Experiments in myotubes stably overexpressing Mb can show adaptation effects during the proliferation and/or differentiation of muscle cells. Thus, to exclude these adaptive factors from the investigations of Mb molecular function in mitochondrial respiration, transient gene modifications were performed in C2C12 myoblasts.
Transient modification of Mb gene expression in myoblasts was achieved by transfection with an Mb‐Flag vector, a control siRNA and an Mb siRNA. Mb‐Flag expression was confirmed in genetically modified myoblasts using immunoblotting with anti‐Flag antibody.
The left panel of Fig. 4 A shows four lanes from an immunoblot for Flag, VDAC and β‐actin in Mb‐Flag transfected cells under the following conditions: (1) without any siRNA, (2) with control siRNA: si‐Con, (3) with Mb siRNA; si‐Mb. The right panel shows cells transfected with GFP vector without any siRNA, with si‐Con and with si‐Mb. The left panel shows that Mb siRNA transfection suppresses Mb‐Flag expression. GFP with or without siRNAs transfected myoblasts showed no blot of Mb‐Flag. VDAC and β‐actin protein expression were used as loading controls. Gene modifications do not effect either VDAC or β‐actin protein, even in GFP vector‐transfected myoblasts. Transient expression of Mb‐Flag was detected in mitochondrial fractions, indicating the mitochondrial localization of Mb in myoblasts (Fig. 4 B). Endogenous Mb does not express in WT C2C12 at all (data not shown). Accordingly, it was possible for us to observe the exogenous Mb‐Flag effect specifically with the gene‐modified myoblasts that we constructed. The CS activity does not change significantly in myoblasts with a Mb vector transfection with and without si‐Con and si‐Mb (Fig. 4 C).
Mitochondrial respiratory capacity in myoblasts of each genotype
O2 consumption was determined to assess mitochondrial respiratory capacity in myoblasts with transient Mb gene modifications. In these experiments, Mb overexpression increased state 4 mitochondrial O2 consumption by a factor of 2. Mb vector‐transfected myoblasts showed an accelerated state 3 O2 consumption compared with that shown by GFP vector‐transfected myoblasts (P = 0.075) (mean ± SD of raw data for O2 consumption/CS activity of myoblasts transfected with Mb‐Flag::GFP or GFP are represented as follows; state 4 respiration of Mb‐Flag::GFP, 0.27 ± 0.14; GFP, 0.14 ± 0.05; state 3 respiration of Mb‐Flag::GFP, 0.48 ± 0.19; GFP, 0.33 ± 0.12; complex 2‐3‐4, Mb‐Flag::GFP, 0.09 ± 0.06; GFP, 0.05 ± 0.04; complex 4, Mb‐Flag::GFP, 0.92 ± 0.27; GFP, 0.88 ± 0.12).
Control siRNA‐transfected myoblasts do not alter the effect of increased Mb expression. State 3, 4 still shows the similar Mb induced VO2 enhancement. Complex IV‐dependent O2 consumption also increases (mean ± SD of raw data for O2 consumption / CS activity of myoblasts transfected with Mb‐Flag::GFP + control siRNA or GFP + control siRNA are represented as following; state 4 respiration of Mb‐Flag::GFP: 0.31 ± 0.10, GFP: 0.19 ± 0.06, state 3 respiration of Mb‐Flag::GFP: 0.44 ± 0.06, GFP: 0.31 ± 0.08, complex 2‐3‐4, Mb‐Flag::GFP: 0.08 ± 0.04, GFP: 0.06 ± 0.02, complex 4, Mb‐Flag::GFP: 0.79 ± 0.09, GFP: 0.55 ± 0.16).
However, Mb siRNA abolishes the Mb induced VO2 enhancement (mean ± SD of raw data for O2 consumption / CS activity of myoblasts transfected with Mb‐Flag::GFP + Mb siRNA or GFP + Mb siRNA are represented as following; state 4 respiration of Mb‐Flag::GFP: 0.24 ± 0.09, GFP: 0.20 ± 0.03, state 3 respiration of Mb‐Flag::GFP: 0.45 ± 0.14, GFP: 0.45 ± 0.11, complex 2‐3‐4, Mb‐Flag::GFP: 0.11 ± 0.05, GFP: 0.10 ± 0.03, complex 4, Mb‐Flag::GFP: 0.90 ± 0.18, GFP: 0.78 ± 0.04) (Fig. 5). These data indicate that mitochondrial respiratory capacity is regulated by Mb concentration, suggesting that Mb is a key modulator of skeletal muscle O2 consumption.
Enzymatic activity in myoblasts of each genotype
Because muscle mitochondrial respiration increased with transient Mb overexpression, we determined the activities of respiratory chain complexes in each cell type to test the hypothesis that respiratory enzyme activity was affected by these genetic modifications. Transient Mb overexpression does not affect key respiratory chain enzymes in complex I to III (NADH ubiquinone reductase, FADH2 ubiquinone reductase, and Ubiquinol cytochrome c reductase) but markedly increased complex IV activity (Fig 6 A‐D). Moreover, Mb vector and control siRNA‐transfected myoblasts had significantly higher complex IV activity than that of GFP vector and control siRNA‐transfected cells. Myoblasts that were transfected only with the Mb vector also showed slight increases in complex IV activity compared with that in GFP vector‐transfected myoblasts. Specifically, the simultaneous transfection of Mb vector and Mb‐specific siRNA abolished the effect of Mb overexpression on complex IV activity, indicating the direct regulation of complex IV by Mb concentrations (Fig. 6 D).
In summary, these data indicate that Mito–Mb modulates complex IV activity. Moreover, because transient gene modifications did not alter the protein quantities of any respiratory complexes in myoblasts (Fig. 7 and Table 1), the activation of complex IV can be attributed to the direct functional effects of Mb on complex IV. Since our data that stated in graphs were relative value, raw data for each experiment were summarized in Table 2.
Table 1.
Amount of mitochondrial subunits in each genotype (myoblasts)
| Vector | Mb‐Flag::GFP | GFP | Mb‐Flag::GFP | GFP | Mb‐Flag::GFP | GFP |
|---|---|---|---|---|---|---|
| siRNA | — | — | Control | Control | Mb | Mb |
| Protein/actin | ||||||
| NDUFB8 | 0.86 ± 0.31 | 0.94 ± 0.20 | 0.99 ± 0.42 | 0.92 ± 0.23 | 1.01 ± 0.43 | 1.10 ± 0.30 |
| SDHB | 1.30 ± 0.51 | 1.50 ± 0.26 | 1.38 ± 0.45 | 1.63 ± 0.46 | 1.32 ± 0.36 | 1.41 ± 0.57 |
| UQCRC2 | 0.89 ± 0.15 | 1.01 ± 0.47 | 1.01 ± 0.21 | 1.13 ± 0.52 | 0.99 ± 0.26 | 0.98 ± 0.39 |
| COXIV | 1.04 ± 0.39 | 1.06 ± 0.30 | 1.12 ± 0.30 | 1.29 ± 0.42 | 0.90 ± 0.38 | 1.32 ± 0.22 |
| ATP5A | 1.36 ± 0.51 | 1.34 ± 0.33 | 1.38 ± 0.35 | 1.50 ± 0.47 | 1.40 ± 0.44 | 1.53 ± 0.43 |
Values are means ± SD (n = 5 and 6); units are arbitrary units (AU); 6 genotypes – Mb‐Flag::GFP, GFP, Mb‐Flag::GFP + control‐siRNA, GFP + control‐siRNA, Mb‐Flag::GFP + Mb‐siRNA and GFP + Mb‐siRNA – are assessed by immunoblotting. Amount of protein expression of mitochondrial respiratory complexes NUDF8 (= complex I), SDHB (= complex II), UQCRC2 (= complex III), COXIV (= complex IV) and ATP5A (= complex V) was determined, and was not found to differ significantly (ANOVA). Therefore, the amount of protein expression was not altered in the respiratory complexes that were subjected to gene modification in this study.
Table 2.
List of raw data of the present study
| Myotubes | Myoblasts | |||||||||
|---|---|---|---|---|---|---|---|---|---|---|
| Mb‐Flag::GFP | Mock | Vector | Mb‐Flag::GFP | GFP | Mb‐Flag::GFP | GFP | Mb‐Flag::GFP | GFP | ||
| si‐RNA | — | — | control | control | Mb | Mb | ||||
| O2 consumption/CS activity | ||||||||||
| Complex 1‐3‐4 | State4 | 0.07 ± 0.01 | 0.04 ± 0.01 | 0.27 ± 0.14 | 0.14 ± 0.05 | 0.31 ± 0.10 | 0.19 ± 0.06 | 0.24 ± 0.09 | 0.20 ± 0.03 | |
| State3 | 0.26 ± 0.09 | 0.16 ± 0.05 | 0.48 ± 0.19 | 0.33 ± 0.12 | 0.44 ± 0.06 | 0.31 ± 0.08 | 0.45 ± 0.14 | 0.45 ± 0.11 | ||
| Complex 2‐3‐4 | 0.23 ± 0.07 | 0.15 ± 0.05 | 0.09 ± 0.06 | 0.05 ± 0.04 | 0.08 ± 0.04 | 0.06 ± 0.02 | 0.11 ± 0.05 | 0.10 ± 0.03 | ||
| Complex 4 | 0.60 ± 0.09 | 0.32 ± 0.04 | 0.92 ± 0.27 | 0.88 ± 0.12 | 0.79 ± 0.09 | 0.55 ± 0.16 | 0.90 ± 0.18 | 0.78 ± 0.04 | ||
| mtDNA/nucDNA | 30.7* 103 | 38.4*103 | – | – | – | – | – | – | ||
| ± 5.1*103 | ± 16.3*103 | |||||||||
| Protein/actin | ||||||||||
| NDUFB8 | 0.52 ± 0.17 | 0.52 ± 0.17 | – | – | – | – | – | – | ||
| SDHB | 1.10 ± 0.26 | 0.84 ± 0.19 | – | – | – | – | – | – | ||
| UQCRC2 | 0.57 ± 0.16 | 0.61 ± 0.20 | – | – | – | – | – | – | ||
| COXIV | 1.27 ± 0.21 | 1.56 ± 0.39 | – | – | – | – | – | – | ||
| ATP5A | 1.18 ± 0.27 | 1.22 ± 0.27 | – | – | – | – | – | – | ||
Discussion
In this study, we showed that mitochondrial respiration is regulated by the muscle‐specific protein Mb in skeletal muscle cells. Specifically, Mb overexpression in myotubes led to enhanced respiratory capacities of muscle mitochondria. Moreover, Mb‐overexpressing myotubes consumed O2 faster, and they had increased respiratory complex activities (complexes I to IV). However, CS activity decreases in these myotubes, indicating that mitochondria in Mb‐overexpressing myotubes produce less substrate for respiration (NADH and FADH2). However, the increased O2 consumption relative to CS activity suggests an enhanced respiratory capacity, consistent with more H+ was pumped into the inter membrane space and a more efficient ATP production. These data support the interpretation that mitochondrial Mb enhances mitochondrial respiratory capacity during the differentiation of skeletal muscle cells.
In a previous study, the improved mitochondrial respiratory capacity in differentiating‐C2C12 cells led to a shift in energy dependence from anaerobic glycolysis to mitochondrial ATP production (Leary et al. 1998). The observed increase in the expression of nuclear encoded mitochondrial genes correlates with Mb enhancement both in mRNA and protein levels (Kim et al. 1995; Garry et al. 1996; Yan et al. 2001). Moreover, the onset of Mb expression also correlates with the start of differentiation (Kanatous & Mammen, 2010; Singh et al. 2014), suggesting that Mb is required to improve mitochondrial respiration during the differentiation of muscle cells. (In the present study, however, we confirmed Mb‐Flag expression in myoblasts of stable cell lines (data not shown). Thus, our stable cell line model have distinct expression pattern of Mb from WT C2C12. For this reason, several adaptations were observed in this model, which is discussed below.
Traditionally, Mb has been considered an O2 binding protein that is localized in the cytosol and releases O2 under hypoxic conditions. On the other hand, the present data indicate that Mb is localized in the mitochondria where it interacts directly with complex IV and plays a distinct role in the regulation of mitochondrial O2 consumption. Our previous study also have unveiled that Mb binds to COXIV and not other mitochondrial components e.g. cytochrome c, in rodent skeletal muscle tissue (Yamada et al. 2013), suggesting that the role of Mb in skeletal muscle mitochondria would interacts specifically with complex IV. In transiently Mb gene modified myoblasts, Mb activation of the complex IV activity correlates that is due to the functional acceleration of complex IV. Mb has been shown to participate in electron transfers with other haeme‐containing proteins (Yamazaki et al. 1964; Wu et al. 1972; Livingston et al. 1985).
It is worth noting that myotubes and myoblasts resulted in different consequences of respiratory enzymatic activities. Whereas complex IV activity was improved distinctively in myoblasts that transiently expressed Mb, enzymatic activity of 4 respiratory complexes were upregulated and CS activity was compromised in differentiated stable cell lines. These differences reflect the effects of long‐term incubation for differentiation and the times of Mb expression. Previous study revealed that Sirt1 down‐regulation in C2C12 myotubes induced decrease of PGC1 alpha gene expression, and meanwhile CS activity also decreased in the myotubes (Gerhart‐Hines et al. 2007). On the contrary, muscle specific PGC1‐α transgenic mice revealed up‐regulation of CS activity (Calvo et al. 2008). These evidences suggest that regulation of CS activity might be dependent upon PGC1‐α expression. Decrease of CS activity in Mb‐overexpressing myotubes might be caused by down‐regulation of PGC1‐α. However, the number of mitochondrial respiratory subunits was not altered in any gene modified models (Figs 3 and 7), which means mitochondrial biogenesis was not affected by Mb gene modification. Given our present data of transient Mb expression model, mitochondria could consume O2 faster than WT in myoblasts of stable cell lines, which may have induced excessive consumption of energy substrates (lipids and carbohydrates). This accelerated energy expenditure would have caused the situation that was close to starvation, which can induce macroautophagy (He & Klionsky, 2009; Mizushima & Komatsu, 2011). Accordingly, damaged mitochondria may have been culled, and highly functional mitochondria that showed accelerated complex activity (complex I‐IV) would have been selected in myotubes during differentiating periods. In addition, increase of mitophagy flux induces loss of CS activity (Gegg et al. 2010; Su et al. 2015). That might be the reason why stable cell lines have revealed improved complex activities and decreased CS activity. It would be intriguing to investigate whether Mb overexpression induces mitophagy.
We conclude that Mb that is highly abundant in myocytes specifically regulated the activity of complex IV in skeletal muscles. These data indicate that Mb is a central modulator of skeletal muscle mitochondrial respiration and skeletal muscle oxidative capacity.
Additional information
Competing interests
None of the authors has any conflict of interest.
Author contribution
T.Y., K.M. and T.J. contributed to the conception and design of this experiment. T.Y., H.T., T.H., Y.K., N.I. and K.M. contributed to the data collection and analysis. T.Y., H.T., Y.F., and K.M. contributed to the data interpretation. T.Y., H.T., T.J., T.K., R.I., Y.F., Y.K., N.I. and K.M. contributed to the drafting and critical revision of the article. All authors have approved the final version of the manuscript and agree to be accountable for all aspects of the work. All persons designated as authors qualify for authorship, and all those who qualify for authorship are listed.
Funding
This research was supported by a Grant‐in‐Aid for Scientific Research from the Japanese Ministry of Education, Science, Sports and Culture (26282183, 25560336, K.M.), a Grant‐in‐Aid for JSPS Fellows (12J06321, T.Y.), and the international collaboration for the Promotion of Science, Bilateral Programs from the Japan Society for the Promotion of Science (7301001471, K.M.).
Acknowledgements
We very appreciate Dr. Ronald D. R. Hamidie's assistance with the experiments.
References
- Adams PL, Lightowlers RN & Turnbull DM (1997). Molecular analysis of cytochrome c oxidase deficiency in Leigh's syndrome. Ann Neurol 41, 268–270. [DOI] [PubMed] [Google Scholar]
- Calvo JA, Daniels TG, Wang X, Paul A, Lin J, Spiegelman BM, Stevenson SC & Rangwala SM (2008). Muscle‐specific expression of PPARγ coactivator‐1α improves exercise performance and increases peak oxygen uptake. J Appl Physiol 104, 1304–1312. [DOI] [PubMed] [Google Scholar]
- Chung Y, Mole PA, Sailasuta N, Tran TK, Hurd R & Jue T (2005). Control of respiration and bioenergetics during muscle contraction. Am J Physiol Cell Physiol 288, C730–C738. [DOI] [PubMed] [Google Scholar]
- DiMauro S, Mendell JR, Sahenk Z, Bachman D, Scarpa A, Scofield RM & Reiner C (1980). Fatal infantile mitochondrial myopathy and renal dysfunction due to cytochrome‐c‐oxidase deficiency. Neurology 30, 795–804. [DOI] [PubMed] [Google Scholar]
- DiMauro S, Nicholson JF, Hays AP, Eastwood AB, Papadimitriou A, Koenigsberger R & DeVivo DC (1983). Benign infantile mitochondrial myopathy due to reversible cytochrome c oxidase deficiency. Ann Neurol 14, 226–234. [DOI] [PubMed] [Google Scholar]
- Flogel U, Merx MW, Godecke A, Decking UKM & Schrader J (2001) Myoglobin: A scavenger of bioactive NO. Proc Natl Acad Sci USA 98, 735–740. [DOI] [PMC free article] [PubMed] [Google Scholar]
- Garry DJ, Bassel‐Duby RS, Richardson JA, Grayson J, Neufer PD & Williams RS (1996). Postnatal development and plasticity of specialized muscle fiber characteristics in the hindlimb. Dev Genet 19, 146–156. [DOI] [PubMed] [Google Scholar]
- Garry DJ, Ordway GA, Lorenz LN, Radford NB, Chin ER, Grange RW, Bassel‐Duby R & Williams RS (1998). Mice without myoglobin. Nature 395, 905–908. [DOI] [PubMed] [Google Scholar]
- Gegg ME, Cooper JM, Chau KY, Rojo M, Schapira AH & Taanman JW (2010). Mitofusin 1 and mitofusin 2 are ubiquitinated in a PINK1/parkin‐dependent manner upon induction of mitophagy. Hum Mol Genet 19, 4861–4870. [DOI] [PMC free article] [PubMed] [Google Scholar]
- Gerhart‐Hines Z, Rogers JT, Bare O, Lerin C, Kim SH, Mostoslavsky R, Alt FW, Wu Z & Puigserver P (2007). Metabolic control of muscle mitochondrial function and fatty acid oxidation through SIRT1/PGC‐1α;. EMBO J 26, 1913–1923. [DOI] [PMC free article] [PubMed] [Google Scholar]
- Grange RW, Meeson A, Chin E, Lau KS, Stull JT, Shelton JM, Williams RS & Garry DJ (2001). Functional and molecular adaptations in skeletal muscle of myoglobin‐mutant mice. Am J Physiol Cell Physiol 281, C1487–C1494. [DOI] [PubMed] [Google Scholar]
- Gros G, Wittenberg BA & Jue T (2010). Myoglobin's old and new clothes: from molecular structure to function in living cells. J Exp Biol 213, 2713–2725. [DOI] [PMC free article] [PubMed] [Google Scholar]
- He C & Klionsky DJ (2009). Regulation mechanisms and signaling pathways of autophagy. Annu Rev Genet 43, 67–93. [DOI] [PMC free article] [PubMed] [Google Scholar]
- Kanatous SB & Mammen PPA (2010). Regulation of myoglobin expression. J Exp Biol 213, 2741–2747. [DOI] [PMC free article] [PubMed] [Google Scholar]
- Kim K, Lecordier A & Bowman LH (1995). Both nuclear and mitochondrial cytochrome c oxidase messenger RNA levels increase dramatically during mouse postnatal development. Biochem J 306, 353–358. [DOI] [PMC free article] [PubMed] [Google Scholar]
- Kuznetsov AV, Veksler V, Gellerich FN, Saks V, Margreiter R & Kunz WS (2008). Analysis of mitochondrial function in situ in permeabilized muscle fibers, tissues and cells. Nat Protoc 3, 965–976. [DOI] [PubMed] [Google Scholar]
- Leary SC, Battersby BJ, Hansford RG & Moyes CD (1998). Interactions between bioenergetics and mitochondrial biogenesis. Biochim Biophys Acta 1365, 522–530. [DOI] [PubMed] [Google Scholar]
- Livingston DJ, McLachlan SJ, La Mar GN & Brown WD (1985). Myoglobin: cytochrome b5 interactions and the kinetic mechanism of metmyoglobin reductase. J Biol Chem 260, 15699–15707. [PubMed] [Google Scholar]
- Lombes A, Nakase H, Tritschler HJ, Kadenbach B, Bonilla E, DeVivo DC, Schon EA & DiMauro S (1991). Biochemical and molecular analysis of cytochrome c oxidase deficiency in Leigh's syndrome. Neurology 41, 491–498. [DOI] [PubMed] [Google Scholar]
- Meeson AP, Radford N, Shelton JM, Mammen PPA, DiMaio JM, Hutcheson K, Kong Y, Elterman J, Williams RS & Garry DJ (2001). Adaptive mechanisms that preserve cardiac function in mice without myoglobin. Circ Res 88, 713–720. [DOI] [PubMed] [Google Scholar]
- Mizushima N & Komatsu M (2011). Autophagy: renovation of cells and tissues. Cell 147, 728–741. [DOI] [PubMed] [Google Scholar]
- Molé PA, Chung Y, Tran TK, Sailasuta N, Hurd R & Jue T (1999). Myoglobin desaturation with exercise intensity in human gastrocnemius muscle. Am J Physiol Regul Integr Comp Physiol, 277, R173–R180. [DOI] [PubMed] [Google Scholar]
- Papadopoulou LC, Sue CM, Davidson MM, Tanji K, Nishino I, Sadlock JE, Krishna S, Walker W, Selby J, Glerum DM, Van Coster R, Lyon G, Scalais E, Lebel R, Kaplan P, Shanske S, De Vivo DC, Bonilla E, Hirano M, DiMauro S & Schon EA (1999). Fatal infantile cardioencephalomyopathy with COX deficiency and mutations in SCO2, a COX assembly gene. Nat Genet 23, 333–337. [DOI] [PubMed] [Google Scholar]
- Philp A, Belew MY, Evans A, Pham D, Sivia I, Chen A, Schenk S & Baar K (2011). The PGC‐1alpha‐related coactivator promotes mitochondrial and myogenic adaptations in C2C12 myotubes. Am J Physiol Regul Integr Comp Physiol 301, R864–R872. [DOI] [PMC free article] [PubMed] [Google Scholar]
- Ponganis PJ, Kreutzer U, Stockard TK, Lin PC, Sailasuta N, Tran TK, Hurd R & Jue T. Blood flow and metabolic regulation in seal muscle during apnea (2008) J Exp Biol 211, 3323–3332. [DOI] [PubMed] [Google Scholar]
- Postnikova GB, Tselikova SV & Shekhovtsova EA (2009). Myoglobin and mitochondria: Oxymyoglobin interacts with mitochondrial membrane during deoxygenation. Biochemistry (Mosc) 74, 1211–1218. [DOI] [PubMed] [Google Scholar]
- Rossignol R, Malgat M, Mazat JP & Letellier T (1999). Threshold effect and tissue specificity – Implication for mitochondrial cytopathies. J Biol Chem 274, 33426–33432. [DOI] [PubMed] [Google Scholar]
- Singh S, Canseco DC, Manda SM, Shelton JM, Chirumamilla RR, Goetsch SC, Ye Q, Gerard RD, Schneider JW, Richardson JA, Rothermel BA & Mammen PP (2014). Cytoglobin modulates myogenic progenitor cell viability and muscle regeneration. Proc Natl Acad Sci USA 111, E129–138. [DOI] [PMC free article] [PubMed] [Google Scholar]
- Shih L, Chung Y, Shiriram R & Jue T (2014). Palmitate interaction with physiological states of myoglobin. Biochim Biophys Act 1840, 656–666. [DOI] [PMC free article] [PubMed] [Google Scholar]
- Spinazzi M, Casarin A, Pertegato V, Salviati L & Angelini C (2012). Assessment of mitochondrial respiratory chain enzymatic activities on tissues and cultured cells. Nat Protoc 7, 1235–1246. [DOI] [PubMed] [Google Scholar]
- Su YC, Guo X & Qi X (2015). Threonine 56 phosphorylation of Bcl‐2 is required for LRRK2 G2019S‐induced mitochondrial depolarization and autophagy. Biochim Biophys Acta 1852, 12–21. [DOI] [PMC free article] [PubMed] [Google Scholar]
- Takakura H, Masuda K, Hashimoto T, Iwase S & Jue T (2010). Quantification of myoglobin deoxygenation and intracellular partial pressure of O2 during muscle contraction during haemoglobin‐free medium perfusion. Exp Physiol 95, 630–640. [DOI] [PubMed] [Google Scholar]
- Wu CS, Duffy P & Brown WD (1972). Interaction of myoglobin and cytochrome C. J Biol Chem 247, 1899–1903. [PubMed] [Google Scholar]
- Yamada T, Furuichi Y, Takakura H, Hashimoto T, Hanai Y, Jue T & Masuda K (2013). Interaction between myoglobin and mitochondria in rat skeletal muscle. J Appl Physiol 114, 490–497. [DOI] [PubMed] [Google Scholar]
- Yamazaki I, Yokota KN & Shikama K (1964). Preparation of crystalline oxymyoglobin from horse heart. J Biol Chem 239, 4151–4153. [PubMed] [Google Scholar]
- Yan Z, Serrano AL, Schiaffino S, Bassel‐Duby R & Williams RS (2001). Regulatory elements governing transcription in specialized myofiber subtypes. J Biol Chem 276, 17361–17366. [DOI] [PubMed] [Google Scholar]
- Zhu Z, Yao J, Johns T, Fu K, De Bie I, Macmillan C, Cuthbert AP, Newbold RF, Wang J, Chevrette M, Brown GK, Brown RM & Shoubridge EA (1998). SURF1, encoding a factor involved in the biogenesis of cytochrome c oxidase, is mutated in Leigh syndrome. Nat Genet 20, 337–343. [DOI] [PubMed] [Google Scholar]