

Abstract
N-MYC downstream-regulated gene-1 (NDRG1) is a potent growth and metastasis suppressor that acts through its inhibitory effects on a wide variety of cellular signaling pathways, including the TGF-β pathway, protein kinase B (AKT)/PI3K pathway, RAS, etc. To investigate the hypothesis that its multiple effects could be regulated by a common upstream effector, the role of NDRG1 on the epidermal growth factor receptor (EGFR) and other members of the ErbB family, namely human epidermal growth factor receptor 2 (HER2) and human epidermal growth factor receptor 3 (HER3), was examined. We demonstrate that NDRG1 markedly decreased the expression and activation of EGFR, HER2, and HER3 in response to the epidermal growth factor (EGF) ligand, while also inhibiting formation of the EGFR/HER2 and HER2/HER3 heterodimers. In addition, NDRG1 also decreased activation of the downstream MAPKK in response to EGF. Moreover, novel anti-tumor agents of the di-2-pyridylketone class of thiosemicarbazones, namely di-2-pyridylketone 4,4-dimethyl-3-thiosemicarbazone and di-2-pyridylketone 4-cyclohexyl-4-methyl-3-thiosemicarbazone, which markedly up-regulate NDRG1, were found to inhibit EGFR, HER2, and HER3 expression and phosphorylation in cancer cells. However, the mechanism involved appeared dependent on NDRG1 for di-2-pyridylketone 4,4-dimethyl-3-thiosemicarbazone, but was independent of this metastasis suppressor for di-2-pyridylketone 4-cyclohexyl-4-methyl-3-thiosemicarbazone. This observation demonstrates that small structural changes in thiosemicarbazones result in marked alterations in molecular targeting. Collectively, these results reveal a mechanism for the extensive downstream effects on cellular signaling attributed to NDRG1. Furthermore, this study identifies a novel approach for the treatment of tumors resistant to traditional EGFR inhibitors.
Keywords: anticancer drug, cancer therapy, molecular pharmacology, pharmacology, tumor cell biology, Dp44mT, NDRG1, metastasis suppressor, pharmaceutics, thiosemicarbazones
Introduction
N-MYC downstream-regulated gene 1 (NDRG1) is a potent, iron-regulated (1–4) growth and metastasis suppressor that was found to be negatively correlated with cancer progression in a number of tumors, including prostate, pancreatic, breast, and colon cancers (2, 4–12). In fact, studies examining the prognosis of patients with these latter neoplasms demonstrated that those with higher NDRG1 levels had a significantly better outcome when compared with those with low NDRG1 levels (5, 11–13). Hence, NDRG1 is a promising prognostic indicator and molecular target for these cancers (14), which represent some of the most common and fatal neoplastic conditions.
The molecular functions of NDRG1 have been the subject of increasing interest in recent years, with studies demonstrating that this metastasis suppressor is involved in numerous signaling pathways that regulate cancer cell proliferation, invasion, angiogenesis, and migration (7, 9, 14, 15). Specifically, NDRG1 inhibited the oncogenic RAS, c-Src, phosphatidylinositol 3-kinase (PI3K), WNT, ROCK1/pMLC2, and nuclear factor κ-light chain enhancer of activated B cell (NF-κB) pathways, while promoting expression of key tumor-suppressive molecules such as phosphatase and tensin homolog, E-cadherin, and mothers against decapentaplegic homolog 4 (SMAD4) (4, 6, 8, 16–20). Through its effects on E-cadherin and β-catenin, which form the adherens junction and promote cell adhesion, NDRG1 was also demonstrated to inhibit the epithelial to mesenchymal transition, an initial key step in metastasis (4, 17).
Considering the widely reported anti-metastatic effects of NDRG1, this molecule has become a viable and promising molecular target for chemotherapeutics. In fact, we and others recently demonstrated that NDRG1 can be markedly up-regulated by a novel class of anti-cancer agents, namely the di-2-pyridylketone class of thiosemicarbazones, such as di-2-pyridylketone 4,4-dimethyl-3-thiosemicarbazone (Dp44mT)8 and di-2-pyridylketone 4-cyclohexyl-4-methyl-3-thiosemicarbazone (DpC; Fig. 1A) (1, 3, 18, 21–23).
FIGURE 1.

A, line drawings of the chemical structures of Dp44mT, DpC, Dp2mT, and DFO. B and C, NDRG1 expression decreases the membrane expression of EGFR and its response to EGF, in both PANC-1 and HT-29 cells. D and E, NDRG1 silencing in CFPAC-1 cells increased EGFR membrane expression. Immunofluorescence microscopy examining EGFR staining was performed as follows: B, PANC-1; C, HT-29 vector control (VC) or NDRG1-overexpressing cells (NDRG1) following treatment either without EGF (panel i) or with EGF (panel ii) (10 ng/ml; 10 min/37 °C). D, CFPAC-1 cells were transiently transfected with NDRG1 siRNA (siNDRG1) or nonspecific control siRNA (siControl) as described under the “Experimental Procedures” and examined for NDRG1 and EGFR protein expression. β-Actin was used as a loading control. Western blots are typical of three independent experiments, with densitometric analysis representing mean ± S.D. (three experiments). Relative to siControl cells, **, p < 0.01; ***, p < 0.001. E, CFPAC-1 cells transiently transfected with siNDRG1 or siControl were examined via immunofluorescence for EGFR expression and localization. Individual and merged images were taken to show staining of EGFR (red) with the cell nucleus (blue) as stained by DAPI. The scale bar in the bottom right corner of the first image represents 50 μm and is the same across all images. Results are typical of three independent experiments.
This class of agents up-regulated NDRG1 in a hypoxia-inducible factor-1α (HIF-1α)-dependent and -independent manner after they sequestered cellular iron (1, 24). Moreover, these thiosemicarbazones possessed potent and selective anti-cancer activity against a range of tumors both in vitro and in vivo (1, 3, 21–23, 25). The potential of these novel compounds is underscored by their marked ability to inhibit tumor cell metastasis in vivo (18) and overcome cancer cell multidrug resistance mediated by P-glycoprotein in vitro and in vivo (23, 26). Interestingly, the anti-metastatic effects of these agents were demonstrated to be dependent on their ability to up-regulate NDRG1 in vitro and in vivo (4, 18, 20), further establishing this metastasis suppressor as an important molecular target for the treatment of cancer.
These latter observations have advanced our understanding of NDRG1 function and how this molecule can be targeted by novel therapeutics. However, with respect to the wide spectrum of pathways that are affected by NDRG1, it remains to be established exactly how one molecule is able to achieve such broad effects. Considering this, the current investigation has focused on a crucial upstream regulator of multiple signaling pathways in cancer cells, namely the epidermal growth factor receptor (EGFR) (27, 28).
EGFR belongs to the ErbB family of receptor tyrosine kinases that consist of EGFR (ErbB1), HER2 (ErbB2), HER3 (ErbB3), and HER4 (ErbB4) (27, 28). EGFR, HER2, and HER3 are well characterized and play important roles in the activation and regulation of multiple cell responses, including cell proliferation, differentiation, apoptosis, migration, and adhesion (27, 28), with each of these latter molecules being associated with carcinogenesis (28–32). However, the function of HER4 remains to be established, with some studies reporting an oncogenic role for this protein (33), whereas others suggest that HER4 may function as a tumor suppressor (34).
Each ErbB receptor possesses an extracellular ligand-binding domain, a single membrane spanning domain, as well as a cytoplasmic tyrosine kinase domain (27, 28). Upon ligand binding, dimerization of ErbB receptors, either as homo- or heterodimers, leads to auto-phosphorylation of their cytoplasmic domains and subsequently results in the activation of downstream pathways (27, 28). The pathways targeted by the ErbB receptors are dictated by the dimer partners, as each member of this receptor family has distinct biochemical properties and binding partners (27, 28). Some of the downstream pathways affected by the EGFR, HER2, and HER3 receptors include the PI3K, RAS, MAPK, WNT, TGF-β, NF-κB, and c-Src pathways (28, 35), many of which have been previously shown to be modulated by NDRG1 expression (2, 6, 8, 11, 14, 17–19). Hence, we hypothesized that NDRG1 may potentially affect a wide array of pathways by targeting the ErbB family members.
Here, for the first time, the effects of NDRG1 on EGFR and other members of the ErbB family, namely HER2 and HER3, were examined. These data demonstrate that NDRG1 markedly inhibited the levels, membrane localization, and activation of EGFR, while also reducing activation of the downstream mitogen-activated protein kinase kinase (MAPKK). Moreover, NDRG1 also inhibited the activation of HER2 and HER3 in response to the EGF ligand and further decreased the formation of the EGFR/HER2 and HER2/HER3 heterodimers. Finally, the novel anti-cancer agents, Dp44mT and DpC, that up-regulate NDRG1 also inhibited EGFR, HER2, and HER3 levels and phosphorylation in cancer cells both in vitro and in vivo. Moreover, these thiosemicarbazones demonstrated markedly and significantly greater anti-proliferative activity than the clinically used EGFR inhibitor, erlotinib, in cell types resistant to this latter agent. Together, these results reveal the following: 1) the origin of at least some of the extensive downstream inhibitory effects on oncogenic signaling pathways attributed to NDRG1; and 2) identify a novel approach to the treatment of tumors that are resistant to traditional EGFR inhibitors.
Experimental Procedures
Cell Lines
The human pancreatic cancer cell types, namely PANC-1, MIAPaCa-2, and CFPAC-1, and the human colon cancer cells, HT-29 and HCT-116, were purchased from the American Type Culture Collection (Manassas, VA). These cell types were authenticated based on viability, recovery, growth, morphology, and also cytogenetic analysis (i.e. antigen expression, DNA profile, and iso-enzymology) by the provider.
The cells were maintained in Dulbecco's modified Eagle's medium (DMEM; Life Technologies, Inc., Victoria, Australia) and McCoy's 5A medium (Life Technologies. Inc.) with 10% fetal calf serum (Life Technologies, Inc.) and cultured by standard procedures (4) for less than 3 months after resuscitation. PANC-1 and HT-29 cells were stably transfected to overexpress NDRG1 and compared with an empty vector-transfected control, as described previously (4, 8). The transfected PANC-1 and HT-29 cells were maintained in DMEM and McCoy's 5A medium containing G418 (500 μg/ml; Sigma), respectively.
Cell Treatments
Epidermal growth factor (EGF; Cell Signaling; catalog no. 8916) was used at 10 ng/ml diluted in 1% FCS-containing media and incubated with cells for 10 min at 37 °C. This concentration and incubation period was implemented based on preliminary studies examining the efficacy of the agent in vitro and following that used by previous studies (19, 36). Prior to treatment with EGF, cells were serum-starved in media containing 1% FCS for 24 h at 37 °C (37). Desferrioxamine (DFO; Fig. 1A) was purchased from Sigma. Erlotinib was purchased from Sapphire Biosciences (Australia). The thiosemicarbazones, Dp44mT and DpC, and the negative control compound di-2-pyridylketone 2-methyl-3-thiosemicarbazone (Dp2mT) were synthesized and characterized using standard methods (21, 22, 38). Dp2mT, Dp44mT, and DpC were freshly dissolved in dimethyl sulfoxide (DMSO) as 10 mm stock solutions and then diluted in culture media (final [DMSO], ≤0.1%).
Protein Extractions, Western Blot, and Antibodies
Total protein was extracted using standard procedures in our laboratory (4). Western analysis was performed as described previously (39). The primary antibody used against human NDRG1 was from Abcam Inc. (catalog no. ab37897; goat; 1:2000 dilution). The following primary antibodies used at a 1:1000 dilution were obtained from Cell Signaling (Danvers, MA): EGFR (catalog no. 2085); pEGFR (Tyr-1068; catalog no. 3777); pEGFR (Tyr-1086; catalog no. 2220); pEGFR (Tyr-1148; catalog no. 4404); HER2 (catalog no. 4290); pHER2 (Tyr-1221/1222; Tyr-12243); HER3 (catalog no. 12708); pHER3 (Tyr-1289; Tyr-12842); HER4 (catalog no. 4795); pHER4 (Tyr-1284; catalog no. 4757); MEK1 (catalog no. 9124); MEK2 (catalog no. 9125); pMEK1/2 (catalog no. 9121); and mouse anti-β-actin (catalog no. A5441; 1:5000), which was used as a protein-loading control, was from Sigma.
The secondary antibodies implemented were anti-goat, anti-rabbit, and anti-mouse (Sigma), each at a dilution of 1:10,000. All antibody dilutions were performed according to the manufacturer's instructions.
Densitometry
Densitometry was performed using Quantity One software (Bio-Rad; CA) and normalized using the relative β-actin loading control for protein and mRNA.
Immunofluorescence
Immunofluorescence was performed as described (4). Images were captured using a Zeiss LSM 510 Meta Spectral Confocal Microscope (×63; Zeiss, Jena, Germany). Raw images were analyzed using AxioVision software (Carl Zeiss, Australia).
Gene Silencing by Small Interfering RNA (siRNA)
siRNA specific for NDRG1 (siNDRG1; Life Technologies, Inc.) was compared with non-targeting negative control siRNA (siControl;Life Technologies, Inc.). The siRNA was transiently transfected into CFPAC-1, PANC-1, and HT-29 cells using Lipofectamine 2000 (Life Technologies, Inc.) following the manufacturer's instructions and incubated for 72 h at 37 °C. Western blotting was then performed, as described below.
Quantitative Real Time PCR
Total RNA was extracted from cells and tissues using TRIzol (Life Technologies, Inc.) according to the manufacturer's protocol. Total RNA (0.5 μg) from each sample was used for first-strand cDNA synthesis using the High Capacity RNA-to-cDNA kit (catalog no. 4387406, Life Technologies, Inc.). The qRT-PCR was performed using cDNA as a template and Universal PCR Master Mix (Applied Biosystems, Carlsbad, CA) on an Applied Biosystems 7900HT sequence detection system (Applied Biosystems). Primers used for qRT-PCR analysis were as follows: EGFR (TaqMan® Gene Expression primer set, catalog no. 4331182; Life Technologies, Inc.) and β-actin, CCCGCCGCCAGCTCACCATGG (forward) and AAGGTCTCAAACATGATCTGGGTC (reverse). The relative amount of mRNA was normalized using β-actin.
Chemical Cross-linking to Detect EGFR Dimers
Chemical cross-linking was performed as described previously (40). Briefly, following a 10-min at 37 °C incubation with EGF (10 ng/ml; see under “Cell Treatments”), PANC-1 and HT-29 cells were washed three times with PBS followed by an incubation with 3,3′-dithiobis-(sulfosuccinimidylpropionate) (Pierce; 1 mm) at 4 °C for 30 min. The cells were then washed three times with PBS and three times with TBS prior to lysis using the IP Lysis Buffer, following the manufacturer's instructions (Pierce). The protein lysates (400 μg) were incubated with EGFR antibody (1:100, catalog no. 2085; Cell Signaling) for 4 h at 4 °C followed by the addition of Dynabeads Protein G (Life Technologies, Inc.) and incubation on a rotating platform at 4 °C overnight. The Dynabeads were then washed with lysis buffer and PBS, and samples were eluted with LDS Loading Buffer (Life Technologies, Inc.) without reducing agents. The samples were boiled for 5 min before being loaded onto a 6% SDS-polyacrylamide gel. Western blotting was performed as described above using the EGFR antibody (1:100, catalog no. 2085; Cell Signaling) to detect EGFR.
Co-immunoprecipitation
Co-immunoprecipitation was performed using Dynabeads Protein G (Life Technologies, Inc.) following the manufacturer's instructions. Briefly, cells were washed with ice-cold PBS and lysed using the IP Lysis buffer (Pierce) containing protease inhibitors (Roche Diagnostics, Basel, Switzerland). Protein (400 μg) was incubated with either monoclonal EGFR antibody (1:50, catalog no. 2256; Cell Signaling) or HER2 antibody (catalog no. 4290; Cell Signaling) overnight at 4 °C. This mixture was added to 30 μl of Dynabeads Protein G and incubated for 3 h at 4 °C. The beads were then washed three times with ice-cold PBS, and the protein was eluted using the LDS-loading buffer containing Sample Reducing Agent (Life Technologies, Inc.). Samples were then heated at 70 °C for 10 min and placed on a magnet, and equal amounts of supernatant were loaded and separated on an 8% Bistris gel. HER2, HER3, and EGFR were then detected by Western blot.
MTT Assays
PANC-1, MIAPaCa-2, HT-29, and HCT-116 cancer cells were seeded on 96-well plates and allowed to attach overnight. The next day, cells were incubated with either Dp2mT, DFO, Dp44mT, DpC, or erlotinib at a range of concentrations (0–80 μm) and incubated for a further 72 h at 37 °C. Cellular proliferation was examined using the MTT (Sigma) assay using standard methods (41). As shown previously, MTT color formation was directly proportional to the number of viable cells (41), validating its use in these studies.
Preparation of Tumor Xenografts in Nude Mice
The following in vivo study was approved by the Sydney University Animal Ethics Committee. Tumor xenografts were established in 8-week-old female nude mice (BALB/c nu/nu), which were routinely fed basal rodent chow, watered ad libitum, and housed under a 12-h light/dark cycle. Briefly, 2 × 10⁶ PANC-1 cells grown in culture were harvested and suspended in Matrigel (BD Biosciences) and injected subcutaneously into the right flank of each mouse. Tumor size and volume were monitored daily, and treatments began when tumors reached an average size of 90 mm3.
The Dp44mT and DpC (as DpC·HCl) treatments were prepared by dissolving each of the compounds in 30% propylene glycol, 0.9% saline, although the vehicle control treatment consisted of 30% propylene glycol, 0.9% saline only (3, 21, 23). Mice were randomly separated into three groups (n = 6), with each group receiving either Dp44mT (0.4 mg/kg), DpC (5 mg/kg) or the vehicle control intravenously via tail vein injection 5 days/week (Monday to Friday). This therapeutic regimen was established based on our previous studies demonstrating that this treatment schedule was well tolerated and showed high anti-tumor efficacy (3, 21, 23). Tumor size was measured by Vernier calipers, and tumor volume was calculated as described previously (23). After 23 days of treatment, mice were euthanized, and tumors were harvested, fixed in 10% neutral buffered formalin for 24 h at 20 °C, and then processed to paraffin wax.
Immunohistochemistry
PANC-1 tumors in nude mice were well circumscribed, pale, non-capsulated masses that were bisected in some cases and fixed for 24 h in 10% neutral buffered formalin before being tissue-processed to paraffin wax. Sections were cut at 5 μm and placed on Superfrost Plus slides (Menzel-Glasser) and stained with hematoxylin and eosin for morphological analysis. Sections for immunohistochemistry were de-paraffinized in xylene and re-hydrated through graded ethanol, before being washed in distilled water. Sections were then heat-retrieved in a commercial pH 9.0, Tris/EDTA buffer (Dako; Carpinteria, CA) at 100 °C for 30 min in a water bath, before being gently cooled, and then thoroughly washed in distilled water. Endogenous peroxidase activity was quenched in 3% hydrogen peroxide for 5 min, before being washed in Tris-buffered saline with 0.5% Tween (TBST) buffer.
The primary antibodies, namely rabbit monoclonal anti-EGFR (catalog no. 2085), anti-HER2 (catalog no. 4290), and anti-HER3 (catalog no. 12708) were obtained from Cell Signaling and used at a 1:250 dilution and incubated for 30 min at room temperature, before vigorous washes with TBST. To detect the antibody-antigen complex, the slides were incubated with Envision+ rabbit (Dako) for 30 min at room temperature, before vigorous washes with TBST. The slides were then incubated with the colorimetric solution, 3,3′-diaminobenzidine, for 10 min at room temperature, thoroughly washed in water, counterstained in Harris hematoxylin, dehydrated through graded ethanol, cleared in xylene, and mounted. The assay was performed manually.
Evaluation of Immunohistochemical Staining
EGFR, HER2, and HER3 immunohistochemical staining was quantified using the program ImmunoMembrane (Institute of Biomedical Technology, Finland), which classified images into three categories, 0/1+, 2+, or 3+, based on the membrane staining completeness and intensity (42). This classification took into account segments of 3,3′-diaminobenzidine-stained membrane, and a score was calculated by averaging images of three random fields for each sample.
Statistics
Data are mean ± S.D. (number of experiments) and were compared using Student's t test. Results were considered significant when p < 0.05.
Results
NDRG1 Down-regulates the Expression of EGFR in PANC-1 and HT-29 Cells
Considering that multiple cell signaling pathways are markedly affected by the metastasis suppressor, NDRG1, in both PANC-1 pancreatic and HT-29 colon cancer cells (4, 8, 17, 20), these latter cell types were utilized to examine whether NDRG1 affected EGFR expression and activation. This was important to establish, as EGFR is a key regulator of numerous oncogenic downstream signaling pathways (31, 43) that were previously found to be inhibited by NDRG1 (4, 6, 8, 17–19). Considering the differences between tumors regarding their genetic background, all studies were conducted with both cell lines, to gain insight into NDRG1 function and gauge common functions between cell types.
The intracellular distribution of EGFR was initially investigated via immunofluorescence in both PANC-1 and HT-29 cells (Fig. 1, B, panel i, and C, panel i). With both cell types, the VC cells showed strong expression of EGFR at the cell membrane, with small amounts also being detected in the cytoplasm and nucleus (Fig. 1, B, panel i, and C, panel i). However, upon NDRG1 overexpression in these cells, the levels of EGFR were markedly decreased at the cell membrane and in intracellular compartments (Fig. 1 B, panel i, and C, panel i).
Next, to examine the effect of the EGF ligand on EGFR expression, PANC-1 and HT-29 cells were also incubated with EGF (10 ng/ml; 10 min), and EGFR expression was examined via immunofluorescence (Fig. 1 B, panel ii, and C, panel ii). As shown in Fig. 1B, the expression pattern of EGFR was markedly altered upon incubation with EGF in PANC-1 cells, changing from predominantly membrane staining (Fig. 1B, panel i) to a very intense punctate pattern (Fig. 1B, panel ii), although this alteration was less evident in HT-29 cells (Fig. 1C, panel i cf. panel ii). Again, NDRG1 overexpression was able to markedly reduce this effect, resulting in a pronounced decrease in EGFR levels in both cell types (Fig. 1 B, panel ii, and C, panel ii).
To further assess the effect of NDRG1 on EGFR expression in another cell line, CFPAC-1 pancreatic cancer cells were also examined (Fig. 1, D and E). These cells were specifically used as they have high endogenous NDRG1 (8), enabling a marked and significant (p < 0.01) reduction of NDRG1 (siNDRG1) when compared with the siRNA control (siControl; Fig. 1D). Examining the EGFR expression in these cells, NDRG1 silencing resulted in a marked and significant (p < 0.001) increase in EGFR levels (Fig. 1D). Interestingly, although the siControl cells showed relatively low levels of EGFR at the cell membrane, the siNDRG1 cells expressed markedly higher levels of EGFR, which was predominantly found at the cell membrane (Fig. 1E).
Together, these results in Fig. 1 demonstrate that NDRG1 inhibits EGFR expression at the cell membrane and intracellularly in three different cell types. NDRG1 was also able to inhibit the effects of EGF on EGFR localization in PANC-1 and HT-29 cells. In all studies, multiple clones of each cell type were utilized to rule out clonal variation, supporting the effect of this metastasis suppressor on decreasing EGFR expression.
NDRG1 Does Not Affect EGFR mRNA Levels
Considering our results above showing that NDRG1 significantly decreased EGFR expression in PANC-1 and HT-29 cells, further studies were conducted to elucidate whether this effect was occurring at the mRNA level. Hence, EGFR mRNA levels were examined in response to NDRG1 in both cell types using qRT-PCR. In comparison to the control, there was no significant (p > 0.05) change of EGFR mRNA upon EGF treatment in the presence or absence of NDRG1 overexpression in either PANC-1 or HT-29 cells (data not shown). These results suggest that the effect of NDRG1 on EGFR levels is not occurring at the mRNA level but instead may be explained by post-transcriptional alterations, which are examined below.
NDRG1 Markedly Inhibits EGF-induced Phosphorylation of EGFR at Tyr-1068, Tyr-1086, and Tyr-1148
As demonstrated above (Fig. 1), NDRG1 markedly decreased membrane EGFR expression. Further studies then focused on examining the effect of NDRG1 on EGFR activation following treatment with EGF. Upon binding EGF, EGFR dimerizes and undergoes auto-phosphorylation at its cytoplasmic domain (27). There are ∼20 sites at which EGFR can be phosphorylated, and these dictate the downstream pathways that are targeted (27). In this study, EGFR phosphorylation at Tyr-1068, Tyr-1086, and Tyr-1148 was examined in response to NDRG1 overexpression in both PANC-1 and HT-29 cells (Fig. 2). These sites are directly involved in activating the RAS, MAPK, PI3K, and c-Src pathways (27, 47, 48) and indirectly lead to activation of WNT, NF-κB, and TGF-β signaling via these former pathways. Hence, these particular phosphorylation sites were examined as they activate pathways previously found to be inhibited by NDRG1 in these cells (4, 6, 8, 17–19).
FIGURE 2.

NDRG1 expression decreases total EGFR, EGFR phosphorylation, and EGFR dimerization in response to EGF in PANC-1 and HT-29 cells. PANC-1 (A) and HT-29 (B) vector control (VC) or NDRG1 overexpressing (NDRG1) cells were incubated with control media (Ctrl) or media containing EGF (EGF; 10 ng/ml; 10 min/37 °C), and the levels of total EGFR as well as EGFR phosphorylated at Tyr-1068, Tyr-1086, and Tyr-1148 were examined by Western blot. β-Actin was used as a loading control. C, EGFR dimerization was examined in PANC-1 (panel i) and HT-29 (panel ii) cells by cross-linking with 3,3′-dithiobis-(sulfosuccinimidylpropionate) (see “Experimental Procedures”) and immunoprecipitating EGFR. D, EGFR dimerization was examined in PANC-1 VC and NDRG1 cells using EGF incubation times of 2, 5, and 10 min at 37 °C. Western blots are typical of three independent experiments, with densitometric analysis representing mean ± S.D. (three experiments). Relative to untreated vector control cells: *, p < 0.05; **, p < 0.01; ***, p < 0.001. Relative to EGF-treated vector control cells: #, p < 0.05; ##, p < 0.01; ###, p < 0.01. Relative to untreated NDRG1 overexpressing cells: †, p < 0.05; ††, p < 0.01.
The PANC-1 and HT-29 VC- and NDRG1-overexpressing cells were incubated with or without EGF (10 ng/ml; 10 min/37 °C) and probed for NDRG1, total EGFR, as well as pEGFR (Tyr-1068, Tyr-1086, and Tyr-1148; Fig. 2, A and B). In both cell types, EGF did not significantly (p > 0.05) affect NDRG1 expression in either VC- or NDRG1-overexpressing cells compared with their corresponding controls (Fig. 2, A, panel i, and B, panel i). As shown in Fig. 1, B and C, NDRG1 overexpression significantly (p < 0.05) decreased total EGFR levels in both PANC-1- and HT-29-untreated control cells relative to the VC cells (Fig. 2, A, panel i, and B, panel i). Moreover, upon EGF treatment, the NDRG1-overexpressing cells had significantly (p < 0.01) lower EGFR levels when compared with the EGF-incubated VC cells (Fig. 2, A, panel i, and B, panel i).
Examining phosphorylation of EGFR in PANC-1 and HT-29 VC cells, pEGFR levels at Tyr-1068, Tyr-1086, and Tyr-1148 were significantly (p < 0.001–0.05) increased upon EGF treatment when compared with untreated VC cells (Fig. 2, A, panel i, and B, panel i). NDRG1 overexpression in control PANC-1 and HT-29 (i.e. in the absence of EGF) cells did not significantly (p > 0.05) affect pEGFR levels at Tyr-1068, Tyr-1086, and Tyr-1148 relative to the VC cells (Fig. 2, A, panel i, and B, panel i). Upon incubation of NDRG1-overexpressing PANC-1 and HT-29 cells with EGF, there was still a significant (p < 0.01–0.05) increase in pEGFR levels at Tyr-1068, Tyr-1086, and Tyr-1148 when compared with NDRG1 control cells. However, this EGF-dependent increase in pEGFR was markedly and significantly (p < 0.01–0.05) lower than that observed for the VC cells that had been incubated with EGF (Fig. 2, A, panel i, and B, panel i). Hence, NDRG1 had an inhibitory effect on the levels of pEGFR occurring in response to EGF in both cell types examined.
Additionally, the ratio of pEGFR to EGFR was determined in both PANC-1 and HT-29 VC cells (Fig 2, A, panel ii, and B, panel ii, respectively). Interestingly, upon EGF treatment, the ratios of pEGFR/EGFR at Tyr-1068, -1086, and -1148 were not significantly changed in PANC-1 (Fig. 2A, panel ii) or HT-29 NDRG1 cells (Fig. 2B, panel ii), compared with VC EGF. Taken together, these data suggest that NDRG1 acts to decrease the levels of pEGFR by reducing total levels of EGFR, rather than acting to specifically decrease EGFR phosphorylation.
Together, the results in Fig. 2, A and B, demonstrate that both PANC-1 and HT-29 cells respond to EGF treatment by significantly increasing pEGFR levels (Tyr-1068, Tyr-1086, and Tyr-1148) and NDRG1 markedly reduces this response to EGF in both cell types.
NDRG1 Inhibits EGFR Dimerization
As demonstrated above, NDRG1 markedly decreased pEGFR levels in response to EGF. Considering that EGFR phosphorylation is achieved by dimerization of this receptor (27), we further examined whether NDRG1 affected the ability of EGFR to form a homodimer in PANC-1 and HT-29 cells in the presence and absence of EGF (Fig. 2C).
Examining the untreated control in PANC-1 and HT-29 VC cells, EGFR was detected as both a monomer (175 kDa) and a dimer (350 kDa; Fig. 2C, panels i and ii) using chemical cross-linking (see “Experimental Procedures”). Notably, for the VC control in both cell types, the abundance of the monomer was significantly (p < 0.01–0.05) greater than the dimer (Fig. 2C, panels i and ii). However, upon treatment of PANC-1 or HT-29 VC cells with EGF (10 ng/ml; 10 min), the levels of the monomer and dimer were either slightly (p > 0.05) decreased in terms of PANC-1 cells (Fig. 2C, panel i) or slightly increased (p > 0.05) in HT-29 cells (Fig. 2C, panel ii), relative to the control.
In the NDRG1-overexpressing PANC-1 cells in the absence of EGF, both the EGFR monomer and dimer were markedly and significantly (p < 0.001–0.01) decreased relative to the VC cells (Fig. 2C, panel i). A very similar effect of NDRG1 in the absence of EGF was also observed in HT-29 cells, except that the reduction in the expression of the EGFR monomer was only slightly decreased (p > 0.05) (Fig. 2C, panel ii). The EGFR dimer was significantly (p < 0.05) reduced in the NDRG1 EGF-treated PANC-1 cells when compared with the VC EGF cells (Fig. 2C, panel i). In addition, both the EGFR monomer and dimer were significantly (p < 0.01) reduced in the NDRG1-overexpressing EGF-treated HT-29 cells when compared with the VC EGF-treated cells (Fig. 2C, panel ii).
As described above, the EGFR dimer levels did not significantly (p > 0.05) increase in response to EGF treatment in either cell line at the 10-min time point examined, which was unexpected. However, EGFR phosphorylation, which follows dimer formation (49), had already occurred at this time point (Fig. 2, A and B). Hence, it is likely that receptor internalization and subsequent degradation of the EGFR dimer had already begun (49). This would account for the slightly reduced levels of the EGFR dimer that are already evident in PANC-1 cells in the presence of EGF (Fig. 2C, panel i).
To assess this hypothesis, we performed additional studies with PANC-1 cells examining EGFR monomer and dimer levels following 2-, 5-, and 10-min incubations with EGF (Fig. 2D). As hypothesized, the levels of the EGFR dimer were markedly and significantly (p < 0.01) increased in response to EGF after 2 and 5 min relative to the control, demonstrating that EGF was inducing dimerization and EGFR activation (Fig. 2D). However, following a 10-min incubation with EGF, the EGFR monomer and dimer were significantly (p < 0.01–0.05) reduced relative to the control (Fig. 2D). These data are in agreement with the results presented in Fig. 2C, panel i, and suggest that internalization and subsequent degradation of EGFR was already occurring at this time point.
Interestingly, in PANC-1 cells overexpressing NDRG1, there was no marked increase in EGFR dimer levels regardless of the shorter 2- and 5-min EGF incubation times, suggesting NDRG1 inhibited EGFR dimerization in response to EGF (Fig. 2D). In fact, after 5 min of EGF incubation, the EGFR monomer and dimer were already significantly (p < 0.01) reduced in the PANC-1 NDRG1 cells when compared with untreated controls, with their levels being almost completely diminished after a 10-min incubation with EGF (Fig. 2D). These data indicate NDRG1 accelerates EGFR degradation following incubation with EGF.
Overall, these results in Fig. 2, C and D, are in agreement with our studies showing that NDRG1 decreased pEGFR levels in PANC-1 and HT-29 cells (Fig. 2, A and B). Moreover, these data indicate that EGFR dimerization, which precedes its auto-phosphorylation (28, 40), was also inhibited by NDRG1.
NDRG1 Inhibits Phosphorylation and Activation of Other Members of the EGFR Family, HER2 and HER3
To further examine the effect of NDRG1 on the dynamics of EGFR activation, other members of the ErbB family were also examined (Fig. 4). This was crucial to perform, as upon EGF binding, EGFR forms a dimer either with itself or with other members of the ErbB family (i.e. HER2, HER3, and HER4) (27). Moreover, HER2, HER3, and HER4 can also dimerize with each other to activate downstream signaling pathways similar to those activated by EGFR (27). The different dimer combinations of EGFR with other members of this family also dictate which downstream pathways are activated (27). Therefore, these other ErbB family members are vital to examine in the context of the effect of NDRG1.
FIGURE 4.

NDRG1 expression inhibits heterodimer formation between EGFR, HER2, and HER3. PANC-1 and HT-29 vector control (VC) or NDRG1-overexpressing cells were incubated with control media (Ctrl) or media containing EGF (10 ng/ml; 10 min/37 °C) and examined via co-immunoprecipitation, as described under “Experimental Procedures.” HER2 (A) or EGFR (B) was immunoprecipitated from the following: PANC-1 (panel i) or HT-29 (panel ii) cells with Western blotting performed to detect HER2, HER3, and EGFR expression. Input lysates of the total protein were included for comparison with the immunoprecipitated lysates for each sample. Western blots are typical of three independent experiments, with densitometric analysis representing mean ± S.D. (three experiments). Relative to untreated vector control cells: *, p < 0.05; **, p < 0.01; ***, p < 0.001. Relative to EGF-treated vector control cells: #, p < 0.05; ##, p < 0.01; ###, p < 0.001.
Initially, we examined the total levels of HER2 and HER3 in PANC-1 and HT-29 cells following treatment with or without EGF (10 ng/ml; 10 min/37 °C; Fig. 3, A, panel i, and B, panel i). Moreover, the activation via phosphorylation of each of these molecules was also examined, namely pHER2 (Tyr-1221/1222) and pHER3 (Tyr-1289), which are involved in activating downstream signaling pathways, namely RAS and PI3K (30, 50–52), that are also inhibited by NDRG1 (4, 6, 8, 17–19). HER4 levels were also assessed in both cell types, although despite exhaustive attempts, this latter protein was not clearly detected in PANC-1 and HT-29 cells (data not shown). Considering these results and the unclear role of HER4 in oncogenesis (53, 54), it was not further assessed herein.
FIGURE 3.

NDRG1 expression inhibits the phosphorylation of HER2 and HER3 in response to EGF. PANC-1 (A) and HT-29 (B) vector control (VC) or NDRG1 overexpressing (NDRG1) cells were incubated with control media (Ctrl) or media containing EGF (EGF; 10 ng/ml; 10 min/37 °C), and the levels of HER2, pHER2, HER3, pHER3, and NDRG1 were examined by Western blot. β-Actin was used as a loading control. Western blots are typical of three independent experiments, with the densitometric analysis representing mean ± S.D. (three experiments). Relative to untreated vector control cells: *, p < 0.05; **, p < 0.01; ***, p < 0.001. Relative to EGF-treated vector control cells: #, p < 0.05; ##, p < 0.01. Relative to untreated NDRG1 overexpressing cells: †, p < 0.05.
Using PANC-1 VC cells, incubation with EGF significantly (p < 0.001–0.01) increased the levels of HER2, pHER2, and pHER3 relative to the control, while having no significant (p > 0.05) effect on HER3 (Fig. 3A, panel i). Interestingly, NDRG1 overexpression in PANC-1 cells markedly (p < 0.01) inhibited the EGF-mediated increase in HER2, pHER2, and pHER3 levels when compared with EGF-treated VC cells (Fig. 3A, panel i). Furthermore, NDRG1 overexpression resulted in a significant (p < 0.01–0.05) reduction of total HER3 levels in the absence and presence of EGF, when compared with the untreated and EGF-treated VC cells, respectively (Fig. 3A, panel i).
Examining HT-29 cells, the total levels of HER2 and HER3 did not significantly (p > 0.05) change in response to either EGF treatment or NDRG1 overexpression (Fig. 3B, panel i). However, pHER2 and pHER3 did respond to EGF treatment in VC cells, where a significant (p < 0.01) increase in expression was observed compared with the control VC cells. In addition, EGF was also able to significantly (p < 0.05) increase pHER3 levels in NDRG1-overexpressing HT-29 cells, when compared with untreated NDRG1 cells. However, the levels of pHER2 and pHER3 were significantly (p < 0.01–0.05) lower in the EGF-treated NDRG1-overexpressing HT-29 cells when compared with the EGF-treated VC cells (Fig. 3B, panel i).
In addition, the ratios of phosphorylated to total protein levels were calculated for HER2 and HER3 in PANC-1 and HT-29 cells (Fig. 3, A, panel ii, and B, panel ii). Similarly to the results obtained for EGFR in Fig. 2, A, panel ii, and B, panel ii, the ratios of pHER2/HER2 and pHER3/HER3 in PANC-1 cells were not significantly (p > 0.05) affected by NDRG1 overexpression in the presence of EGF relative to VC cells. This suggests that NDRG1 is primarily acting to suppress total HER2 and HER3 levels, rather than directly acting to decrease its phosphorylation in PANC-1 cells (Fig. 3A, panel ii). In contrast, in HT-29 VC cells it was observed that the ratios of both pHER2/HER2 and pHER3/HER3 were significantly (p < 0.05) reduced relative to cells overexpressing NDRG1 in the presence of EGF (Fig. 3B, panel ii). Thus, unlike PANC-1 cells, it appears that phosphorylation of HER2 and HER3 can be reduced by NDRG1 without a decrease in total EGFR in HT-29 cells.
Overall, in both cell types, it is evident that although EGF promotes phosphorylation and activation of HER2 and HER3, NDRG1 is able to markedly reduce this effect. In terms of the mechanism involved, assessment of the ratio of phosphorylated to total HER2 and HER3 demonstrated that in PANC-1 cells the decrease in phosphorylation was due to a marked suppression in total protein levels. In contrast, in HT-29 cells, NDRG1 suppressed phosphorylation status without affecting total HER2 or HER3 levels. In both cases, the net effect was a decrease in the active (phosphorylated) forms of HER2 and HER3.
In the Presence of EGF, NDRG1 Inhibits Formation of the EGFR/HER2 Heterodimer and Highly Oncogenic HER2/HER3 Heterodimer
Our results examining HER2 and HER3 demonstrate that NDRG1 is able to reduce the activation of these proteins in response to EGF in both PANC-1 and HT-29 cells (Fig. 3, A and B). To further characterize how NDRG1 affects the activity of these latter proteins, as well as their interaction with EGFR, subsequent studies focused on examining the heterodimers that form between EGFR, HER2, and HER3 (Fig. 4). This was important to assess, as the EGFR/HER2, EGFR/HER3, and in particular the HER2/HER3 heterodimers are potent activators of a number of oncogenic downstream signaling pathways (30, 55–60). Considering the ability of NDRG1 to inhibit multiple oncogenic signaling pathways in both PANC-1 and HT-29 cells (4, 6, 8, 17, 20), we examined whether NDRG1 overexpression in these cells was able to modulate the formation of the EGFR/HER2, EGFR/HER3, and HER2/HER3 heterodimers using co-immunoprecipitation.
To examine the formation of the HER2/HER3 and EGFR/HER2 heterodimers in these cells, PANC-1 and HT-29 lysates were co-immunoprecipitated with HER2 antibody, and then EGFR, HER2 and HER3 levels were examined via Western blot (Fig. 4A, panels i and ii). The EGFR/HER2 heterodimer was significantly (p < 0.01–0.05) decreased by NDRG1 in the presence of EGF in both PANC-1 and HT-29 cells relative to the VC cells incubated with EGF. In addition, the EGFR/HER2 heterodimer was also markedly and significantly (p < 0.01) reduced by NDRG1 in the absence of EGF in PANC-1 cells alone relative to the VC control without EGF (Fig. 4A, panel i).
It is important to note that there was greater enrichment of HER3 than EGFR in the HER2 immunoprecipitate for both PANC-1 and HT-29 cells (Fig. 4A). This observation suggests that marked levels of the HER2/HER3 heterodimer were present in these cells and hence may play a vital oncogenic role. Interestingly, neither EGF treatment nor NDRG1 overexpression alone significantly (p > 0.05) affected the formation of the HER2/HER3 heterodimer in both cell types (Fig. 4A, panels i and ii). However, PANC-1 and HT-29 cells overexpressing NDRG1 that were also incubated with EGF demonstrated a significant (p < 0.05) reduction in HER2/HER3 heterodimer levels when compared with the VC cells treated with EGF (Fig. 4A, panels i and ii).
To complement the studies above, and to examine the EGFR/HER3 heterodimer, immunoprecipitation was also performed with the EGFR antibody for both PANC-1 and HT-29 cells, and levels of HER2 and HER3 were examined by Western analysis (Fig. 4B, panels i and ii). In PANC-1 lysates, neither the EGFR/HER2 nor EGFR/HER3 heterodimers were detected despite exhaustive attempts and appreciable immunoprecipitation of EGFR (Fig. 4B, panel i). However, when PANC-1 lysates were co-immunoprecipitated with the HER2 antibody, as described above (see Fig. 4A, panel i), and the presence of EGFR was examined, the EGFR/HER2 heterodimer was detected, suggesting this former approach was more sensitive.
Examining HT-29 lysates that were co-immunoprecipitated with the EGFR antibody (Fig. 4B, panel ii), we detected low HER2 levels in the VC samples, suggesting limited formation of the EGFR/HER2 heterodimer. Neither EGF treatment nor NDRG1 overexpression alone significantly (p > 0.05) affected the formation of the EGFR/HER2 heterodimer (Fig. 4B, panel ii). However, NDRG1 overexpression in the presence of EGF resulted in a significant (p < 0.01) reduction in the formation of the EGFR/HER2 heterodimer in HT-29 cells (Fig. 4B, panel ii), which is in agreement with the results obtained from the immunoprecipitation of HER2 in (Fig. 4A, panel ii).
The EGFR/HER3 heterodimer was detected in HT-29 cells after co-immunoprecipitation of EGFR and assessment of the lysates for HER3 expression (Fig. 4B, panel ii). However, the EGFR/HER3 heterodimer was not significantly (p > 0.05) affected by NDRG1 expression nor by EGF treatment in HT-29 cells (Fig. 4B, panel ii).
As observed with the EGFR homodimers (Fig. 2C), EGF treatment of both PANC-1 and HT-29 cells did not markedly alter the levels of the EGFR/HER2, EGFR/HER3, or HER2/HER3 heterodimers in VC cells relative to untreated VC cells (Fig. 4). However, phosphorylation of EGFR, HER2, and HER3 in response to EGF was clearly evident in both cell types at the 10-min time point assessed (Figs. 2, A and B, and 3). These results suggest that at this time point, the effect of EGF on the formation of the dimers had already reached its peak and had returned to baseline, as was demonstrated with the EGFR homodimers (Fig. 2D). This is a well known occurrence with receptor tyrosine kinase signaling, whereby rapid endocytic degradation occurs following receptor activation (49).
Collectively, these studies in Fig. 4 demonstrate that NDRG1, in the presence of EGF, is able to inhibit the formation of the EGFR/HER2 heterodimer, as well as the highly oncogenic and more prominent HER2/HER3 heterodimer (59). It is important to note that NDRG1 reduced the protein levels and/or phosphorylation of EGFR, HER2, and HER3 to different extents in the cells examined (Figs. 2 and 3). Hence, the reduced formation of the EGFR/HER2 and HER2/HER3 heterodimers in these cells is likely to result from a combination of reduced protein levels and inhibition of dimerization. Overall, these effects are likely to result in decreased downstream signaling of these important protein complexes.
NDRG1 Inhibits Downstream Targets of EGFR Signaling, MAPKK Kinases
Considering the involvement of EGFR in the activation of multiple oncogenic pathways, this investigation further examined the effect of NDRG1 on a key downstream signaling pathway that is activated by EGFR, namely the rapidly accelerated fibrosarcoma (RAF)/MEK/ERK signaling cascade (61). This was crucial to examine, as our current studies showed that NDRG1 markedly inhibits EGFR receptor levels and activation (Figs. 1–4). In addition, we have previously demonstrated that NDRG1 inhibits extracellular signal-regulated kinase (ERK) activation in pancreatic cancer cells (6, 8). However, the effect of NDRG1 on the molecules that act as signaling conduits between the EGFR receptor and ERK, namely the MAPKK protein kinases MEK1 and MEK2 (61), have not been previously assessed and were examined herein (Fig. 5).
FIGURE 5.

NDRG1 expression inhibits MAPKK kinases that are downstream of EGFR signaling. PANC-1 (A) and HT-29 (B) vector control (VC) or NDRG1-overexpressing (NDRG1) cells were incubated with control media (Ctrl) or media containing EGF (10 ng/ml; 10 min/37 °C) and levels of MEK1, MEK2, pMEK1/2, and NDRG were examined by Western blot. β-Actin was used as a loading control. Western blots are typical of three independent experiments, with densitometric analysis representing mean ± S.D. (three experiments). Relative to untreated vector control cells: *, p < 0.05; **, p < 0.01; ***, p < 0.001. Relative to EGF-treated vector control cells: #, p < 0.05; ##, p < 0.01. Relative to untreated NDRG1 overexpressing cells: †, p < 0.05; ††, p < 0.01.
The MAPKK protein kinases such as MEK1 and MEK2 function in the mitogen-activated protein kinase cascade and are activated by their phosphorylation at Ser-217 and Ser-221 by rapidly accelerated fibrosarcoma, which is directly activated by EGFR (62). This leads to the activation of the MAPK protein kinases, namely ERK1 and ERK2, which are able to activate numerous growth and proliferation signals (61).
To determine the effect of NDRG1 on MAPKK kinases, PANC-1 and HT-29 cells were examined for the levels of MEK1, MEK2, as well as pMEK1/2 (Ser-217/221) in the presence or absence of EGF (10 ng/ml; 10 min/37 °C). Examining PANC-1 cells, neither EGF nor NDRG1 had any significant (p > 0.05) effect on MEK1 expression versus the relative controls (Fig. 5A). In contrast, in NDRG1-overexpressing HT-29 cells, both the presence or absence of EGF led to a significant (p < 0.01–0.05) reduction in MEK1 levels versus the respective VC cells (Fig. 5B). However, MEK2 levels were significantly (p < 0.01–0.05) decreased by NDRG1 expression in both PANC-1 and HT-29 cells without EGF treatment versus the respective VC control (Fig. 5, A and B). Notably, MEK2 was also significantly (p < 0.05) reduced in NDRG1-overexpressing HT-29 cells by EGF relative to the EGF-treated VC control (Fig. 5B), although only a slight (p > 0.05) decrease was observed under comparable conditions using PANC-1 cells (Fig. 5A). Interestingly, EGF alone also significantly (p < 0.01) decreased MEK2 levels in PANC-1 VC cells versus the VC control (Fig. 5A), while having no significant (p > 0.05) effect on MEK2 levels in HT-29 VC cells (Fig. 5B).
The activated form of MEK1 and MEK2, namely pMEK1/2, was significantly (p < 0.001) up-regulated in response to EGF treatment in both PANC-1 and HT-29 cells (Fig. 5, A and B), which is consistent with this kinase being downstream of the EGFR pathway (61). Furthermore, NDRG1 overexpression resulted in a significant (p < 0.05) reduction in the basal levels of pMEK1/2 in untreated control cells when compared with untreated VC cells in both PANC-1 and HT-29 cells. Importantly, although EGF treatment still induced a significant (p < 0.01–0.05) increase in pMEK1/2 levels in NDRG1-overexpressing PANC-1 and HT-29 cells, this increase was markedly (p < 0.01–0.05) lower when compared with VC cells incubated with EGF (Fig. 5, A and B). Together, these results suggest that the effect of NDRG1 on inhibiting the expression and activation of EGFR in response to EGF stimulation (Figs. 1 and 2) leads to downstream effects on the MAPKK kinases, whose activation is also decreased by NDRG1 in both PANC-1 and HT-29 cells.
Novel Thiosemicarbazones, Dp44mT and DpC, Down-regulate EGFR Expression in Cancer Cells
Here, we show for the first time that the metastasis suppressor, NDRG1, was able to markedly inhibit EGFR expression and activation. We also previously demonstrated that NDRG1 inhibits a number of EGFR downstream pathways, including PI3K, RAS, etc. (6, 8, 17–19), leading to inhibition of cell migration and invasion (4, 20). Together, these results indicate that NDRG1 is a highly promising therapeutic target in cancer cells.
Notably, novel thiosemicarbazone anti-cancer agents, namely Dp44mT and DpC (Fig. 1A), that demonstrate marked and selective anti-tumor and anti-metastatic activity (3, 4, 18, 20–23, 25, 63), can markedly up-regulate NDRG1 expression (1). This occurs due to the ability of these ligands to bind and sequester intracellular iron leading to activation of HIF1α-dependent and -independent mechanisms (1, 24). Furthermore, this response to these agents has been shown to occur in both PANC-1 and HT-29 cells (3, 4, 20). These agents were also demonstrated to broadly inhibit a number of oncogenic pathways via NDRG1-dependent mechanisms, including TGF-β, WNT, PI3K, etc. (4, 6, 18, 25).
Here, for the first time, the effect of Dp44mT (10 μm) and DpC (10 μm) was examined on the expression, activation, and localization of EGFR in PANC-1 and HT-29 cells (Fig. 6). In addition to these agents, we also utilized DFO (250 μm) as a positive control as it is a well characterized iron chelator (64). Furthermore, Dp2mT (10 μm) was implemented as a negative control, because this agent is an analog of both Dp44mT and DpC, which has been specifically designed and shown not to bind metal ions (4, 20, 22). As per our previous studies (4, 65), DFO was implemented at a 25-fold higher concentration (250 μm) than either Dp44mT (10 μm) or DpC (10 μm) due to its much greater hydrophilicity, and thus lower membrane permeability and intracellular iron chelation efficacy (22, 66). Both Dp44mT and DpC were utilized at lower concentrations because these lipophilic agents (Fig. 1A) show far higher membrane permeability and demonstrate marked iron chelation efficacy (3, 21, 22).
FIGURE 6.

Novel thiosemicarbazones, Dp44mT and DpC, decrease EGFR expression at the cell membrane. PANC-1 (A) and HT-29 (B) cells were incubated for 24 h at 37 °C with control media (Ctrl) or media containing the following: Dp2mT (10 μm), DFO (250 μm), Dp44mT (10 μm), or DpC (10 μm), and levels of NDRG1 and EGFR were examined by Western blot. β-Actin was used as a loading control. Western blots are typical of three independent experiments, with densitometric analysis representing mean ± S.D. (three experiments). Relative to untreated control cells: *, p < 0.05; **, p < 0.01; ***, p < 0.001. Relative to DFO-treated cells: #, p < 0.05. EGFR localization was examined via immunofluorescence in PANC-1 (C) and HT-29 (D) cells that were incubated for 24 h at 37 °C with either control media or media containing Dp2mT (10 μm), DFO (250 μm), Dp44mT (10 μm), or DpC (10 μm). The scale bar in the bottom right corner of the first image represents 50 μm and is the same across all images. Results are typical of three independent experiments.
As demonstrated previously (3, 4), DFO, Dp44mT, and DpC were able to significantly (p < 0.001–0.05) up-regulate NDRG1 expression in both PANC-1 (Fig. 6A) and HT-29 (Fig. 6B) cells. Notably, the top NDRG1 band at ∼44 kDa, which was increased by these agents in both cell lines, has been reported to be involved in its anti-metastatic activity (67, 68). Moreover, the negative control compound, Dp2mT, had no significant (p > 0.05) effect on NDRG1 expression in either cell line (Fig. 6, A and B). Despite the far higher concentration of DFO used (250 μm) in these studies, its efficacy at up-regulating NDRG1 was significantly (p < 0.05) less than that of Dp44mT (10 μm), probably due to its lower membrane permeability (22, 66).
Both Dp44mT and DpC also caused a significant (p < 0.01–0.05) decrease in EGFR protein levels in both PANC-1 and HT-29 cells (Fig. 6, A and B). Interestingly, DFO did not significantly (p > 0.05) affect EGFR expression in PANC-1 cells (Fig. 6A), although in HT-29 cells, this ligand was also able to significantly (p < 0.05) reduce EGFR levels (Fig. 6B). Again, the negative control compound, Dp2mT had no significant (p > 0.05) effect on EGFR levels in both cell types (Fig. 6, A and B), suggesting that the chelation efficacy of these compounds was crucial for their effect on decreasing EGFR expression.
Although DpC caused a significant (p < 0.01–0.05) decrease in EGFR expression in both PANC-1 and HT-29 cells, its up-regulation of NDRG1, particularly in PANC-1 cells, was not as pronounced when compared with Dp44mT and DFO (Fig. 6, A and B). This finding suggests that the up-regulation of NDRG1 may not be the sole contributor to the decreased EGFR expression caused by DpC, with possible alternative mechanisms being involved (examined further below in Fig. 9).
FIGURE 9.

Effect of DpC on inhibiting EGFR expression and activation occurs independently of NDRG1 in the presence of the EGF ligand. PANC-1 (A) and HT-29 (B) cells were transiently transfected with nonspecific control siRNA (siControl) or NDRG1 siRNA (siNDRG1) for 72 h at 37 °C, followed by treatment with Dp2mT (10 μm), DFO (250 μm), Dp44mT (10 μm), or DpC (10 μm) for 24 h at 37 °C with EGF (10 ng/ml) added for the last 10 min of the 24-h incubation. NDRG1, EGFR, and pEGFR(Tyr-1068) levels were then examined by Western blot, with β-actin used as a loading control. Western blots are typical of three independent experiments, with densitometric analysis representing mean ± S.D. (three experiments). Relative to untreated control cells: *, p < 0.05; **, p < 0.01; ***, p < 0.001. Relative to the correspondingly treated siControl cells: #, p < 0.05.
Further studies examining the localization of EGFR via immunofluorescence revealed that Dp44mT and DpC caused a pronounced reduction in EGFR levels at the membrane, as well as nuclear and cytoplasmic compartments of both PANC-1 (Fig. 6C) and HT-29 (Fig. 6D) cells. Again, the negative control, Dp2mT, had no marked effect compared with the untreated control cells. Collectively, these results demonstrate that the novel anti-cancer agents, Dp44mT and DpC, not only up-regulate NDRG1 expression in PANC-1 and HT-29 cells, but also decrease EGFR levels in both cell types. These observations suggest that the down-regulation of EGFR may occur, at least in part, via the effect of these agents on NDRG1. Hence, this could be a mechanism by which Dp44mT and DpC are able to exert their anti-cancer activity.
To additionally evaluate the effect of these novel agents on EGFR activation, we also examined pEGFR (Tyr-1068, Tyr-1086, and Tyr-1148) levels. Importantly, considering that EGFR is phosphorylated in response to the EGF ligand (27), all these experiments assessing phosphorylation of ErbB family members in the presence of the agents (Figs. 7–9) were conducted after incubation with EGF. In these studies, PANC-1 and HT-29 cells were incubated with Dp2mT (10 μm), DFO (250 μm), Dp44mT (10 μm), or DpC (10 μm) for 24 h at 37 °C, followed by EGF treatment (10 ng/ml) for the last 10 min of the 24-h incubation. Similarly to the results in Fig. 6, A and B, Dp44mT and DpC significantly (p < 0.05) decreased EGFR in PANC-1 cells (Fig. 7A), although DFO, Dp44mT, and DpC significantly (p < 0.001–0.01) decreased EGFR in HT-29 cells relative to the control (Fig. 7B). In contrast, the negative control compound, Dp2mT, had no significant (p > 0.05) effect in either cell type (Fig. 7).
FIGURE 7.

Novel thiosemicarbazones, Dp44mT and DpC, decrease EGFR, HER2, and HER3 phosphorylation in the presence of the EGF ligand. PANC-1 (A) and HT-29 (B) cells were incubated for 24 h at 37 °C with control media (Ctrl) or media containing Dp2mT (10 μm), DFO (250 μm), Dp44mT (10 μm), or DpC (10 μm) followed by treatment with EGF (10 ng/ml) in the last 10 min at 37 °C of the 24-h incubation. The levels of NDRG1, pEGFR (Tyr-1068, Tyr-1086, and Tyr-1148), HER2, pHER2, HER3, and pHER3 were examined by Western blot. β-Actin was used as a loading control. Western blots are typical of three independent experiments, with the densitometric analysis being the mean ± S.D. (three experiments). Relative to untreated control cells: *, p < 0.05; **, p < 0.01; ***, p < 0.001.
FIGURE 8.

Iron- or copper-binding by DpC reduces EGFR expression and activation in the presence of the EGF ligand. PANC-1 (A) and HT-29 (B) cells were incubated with control media or media containing: Dp2mT (10 μm), DpC (10 μm), DpC-iron (2:1; 10 μm), iron (5 μm) (panel i) or Dp2mT (1 μm), DpC (1 μm), DpC-copper (1:1; 1 μm), or copper (1 μm) (panel ii) for 24 h at 37 °C followed by treatment with EGF (10 ng/ml) in the last 10 min of the 24-h incubation. The levels of NDRG1, EGFR, and pEGFR (Tyr-1068) were examined by Western blot. β-Actin was used as a loading control. Western blots are typical of three independent experiments, with densitometric analysis representing mean ± S.D. (three experiments). Relative to untreated control cells: *, p < 0.05; **, p < 0.01.
Examining EGFR phosphorylation at Tyr-1068, Tyr-1086, and Tyr-1148, Dp2mT and DFO had no significant (p > 0.05) effect on pEGFR levels in either cell line versus the untreated control cells (Fig. 7, A and B). On the other hand, Dp44mT was more effective and significantly (p < 0.05) decreased pEGFR (Tyr-1086) in PANC-1 cells (Fig. 7A), and pEGFR (Tyr-1148) in HT-29 cells (Fig. 7B), relative to the respective control cells. Importantly, DpC was the most active agent assessed and significantly (p < 0.001–0.05) reduced pEGFR (Tyr-1068, Tyr-1086 and Tyr-1148) in both PANC-1 and HT-29 cells when compared with untreated control cells (Fig. 7, A and B).
The effect of these novel agents was also examined on other members of the ErbB family, namely HER2, pHER2, HER3, and pHER3 (Fig. 7, A and B). This was important to establish as NDRG1 was demonstrated to markedly inhibit both HER2 and HER3 activation in the presence of EGF (Fig. 3). Again, the negative control, Dp2mT, had no significant (p > 0.05) effect on all ErbB family members relative to the control (Fig. 7, A and B). Although DFO did not significantly (p > 0.05) affect HER2, pHER2, HER3, and pHER3 levels in PANC-1 cells versus the control (Fig. 7A), it did significantly (p < 0.01–0.05) reduce HER2, pHER2, HER3, and pHER3 levels relative to the control in HT-29 cells (Fig. 7B). Dp44mT was also shown to significantly (p < 0.05) decrease HER2 and HER3 levels in PANC-1, while having no significant (p > 0.05) effect on their phosphorylation (Fig. 7A). Furthermore, Dp44mT significantly (p < 0.01–0.05) decreased HER2, pHER2, HER3, and pHER3 in HT-29 cells (Fig. 7B). Of note, DpC was the most effective of these ligands, as it was able to significantly (p < 0.001–0.05) decrease HER2, pHER2, HER3, and pHER3 in both PANC-1 and HT-29 cells relative to the control (Fig. 7, A and B).
Furthermore, in addition to these findings, the ratios of pEGFR/EGFR (−Tyr-1068, −Tyr-1086, and −Tyr-1148), pHER2/HER2, and pHER3/HER3 were calculated for PANC-1 and HT-29 cells (Fig. 7, A, panel ii, and B, panel ii, respectively). These ratios were not changed significantly (p > 0.05) in cells incubated with any of the agents relative to the control in the presence of EGF. This observation suggests the mechanism by which these agents act to decrease phosphorylated EGFR, HER2, and HER3 is via the decrease in their total protein levels, rather than by acting to specifically decrease their phosphorylation.
Collectively, these results in Fig. 7 indicate that DpC is highly potent in terms of its inhibitory effects on EGFR, HER2, and HER3 activation in both cell types. This finding is consistent with the potent anti-tumor activity that this compound displays against pancreatic and colonic cancer cells in vitro and in vivo (3, 19, 20).
Iron and Copper Complexes of DpC Reduce EGFR Expression and Activation
Considering that the thiosemicarbazone DpC was the most effective agent at reducing the activation and expression of EGFR, HER2, and HER3 (Fig. 7, A and B), it was also important to investigate the role of metal binding on the activity of this ligand (21). In this study, DpC was compared with its respective iron complexes at a ligand/metal ratio of 2:1 (DpC-Fe; Fig. 8, A, panel i, and B, panel i). Additionally, as DpC also binds copper, which contributes to its anti-cancer activity (21), the effect of the DpC copper complex in a 1:1 ligand/iron molar ratio (DpC-Cu; Fig 8, A, panel ii, and B, panel ii) was also investigated. The stoichiometries of ligand to metal used represent the Fe(III) and Cu(II) complexes observed with thiosemicarbazones of this class (21, 38). It is notable that a DpC-copper complex concentration of 1 μm was used, rather than the 10 μm that was implemented for the DpC-iron complex, due to the high anti-proliferative activity of the copper complexes of this class of thiosemicarbazones (69). The metal ions, Fe(III) (as FeCl3) and Cu(II) (as CuCl2), were also implemented as relevant controls in these studies, as they were used to prepare the metal complexes. In these studies, PANC-1 or HT-29 cells were incubated with the agents for 24 h at 37 °C with EGF (10 ng/ml) being added in the last 10 min of the incubation.
First, assessing the effect of the agents and their complexes on NDRG1 expression, it is notable that the negative control for DpC, namely Dp2mT, which does not bind metal ions (22), had no significant (p > 0.05) effect on NDRG1 levels relative to the control in PANC-1 (Fig. 8A, panels i and ii) or HT-29 cells (Fig. 8B, panels i and ii). In fact, Dp2mT had no significant (p > 0.05) effect on EGFR or pEGFR (Tyr-1068) levels relative to the control. However, DpC, and to a lesser extent, the DpC-iron complex (2:1 ratio), led to a significant (p < 0.01–0.05) increase in NDRG1 expression in both cell types relative to the control (Fig 8, A, panel i, and B, panel i). In contrast, the DpC-copper (1:1 ratio) complex (Fig. 8, A, panel ii, and B, panel ii), or the iron and copper controls (Fig. 8, A and B), had no significant (p > 0.05) effect on NDRG1 levels relative to the control (Fig. 8, A and B).
In terms of EGFR expression and activation, in PANC-1 (Fig. 8A, panel i) or HT-29 (Fig. 8B, panel i) cells, there was a significant (p < 0.01–0.05) decrease in EGFR and pEGFR(Tyr-1068) upon incubation with DpC, in comparison with the control. Moreover, DpC-iron also significantly (p < 0.01–0.05) inhibited pEGFR(Tyr-1068) in both PANC-1 and HT-29 cells, while significantly (p < 0.01) reducing total EGFR levels in the HT-29 cells only. In contrast, iron alone had no significant (p > 0.05) effect on either EGFR or pEGFR(Tyr-1068). In PANC-1 cells (Fig. 8A, panel ii), the DpC-copper complex or copper had no significant (p > 0.05) effect on either EGFR or pEGFR(Tyr-1068), although in HT-29 cells (Fig. 8B, panel ii), DpC and the DpC-copper complex caused a significant (p < 0.01–0.05) decrease to both.
These studies demonstrate that, depending on the cell-type assessed, the iron and copper complexes of DpC played a role in its reduction of EGFR activation and phosphorylation. The most consistent effect of the iron and copper complexes between the cell types was the activity of the DpC-iron complex to decrease EGFR phosphorylation at Tyr-1068.
Novel Thiosemicarbazone, DpC, Exerts Its Activity by a Mechanism Independent of NDRG1
Thus far, it has been demonstrated that DpC is the most effective agent in reducing EGFR and pEGFR in both PANC-1 and HT-29 cells (Figs. 6–8). However, in comparison with DFO and Dp44mT, it is evident that its ability to up-regulate NDRG1 is not as marked (Figs. 6 and 7). Considering this, it was important to investigate the effect of DpC in the absence of NDRG1. To address this, siRNA-mediated silencing of NDRG1 was performed in PANC-1 and HT-29 cells followed by incubation with Dp2mT, DFO, Dp44mT, or DpC for 24 h at 37 °C with EGF (10 ng/ml) being added in the last 10 min of the incubation (Fig. 9).
Effective silencing was shown by a significant (p < 0.001–0.05) reduction in NDRG1 protein levels in siNDRG1 cells, in comparison with the negative control siRNA (siControl; Fig. 9, A and B). Notably, NDRG1 was almost completely silenced in PANC-1 cells and remained suppressed (Fig. 9A), even in the presence of DFO, Dp44mT, and DpC, which are known to up-regulate this protein (Fig. 6A) (1–4). However, very low NDRG1 levels were still present in HT-29 cells even in the presence of siNDRG1 (Fig. 9B). The expression of NDRG1 in HT-29 cells in the presence of NDRG1 siRNA was increased with DFO, Dp44mT, and DpC relative to the control, although to a significantly (p < 0.05) lesser degree when compared with the siControl cells (Fig. 9B).
In PANC-1 and HT-29 siControl cells, DpC caused a marked (p < 0.001–0.05) reduction of both EGFR and pEGFR(Tyr-1068) levels in comparison with the control (Fig. 9, A and B). Interestingly, in both cell types that were transfected with the NDRG1 siRNA, DpC was still able to significantly (p < 0.01–0.05) reduce the expression of EGFR and pEGFR(Tyr-1068) in comparison with the siControl cells. This observation suggests that DpC can exert its effect on EGFR expression and activation via a mechanism that is independent of NDRG1.
Interestingly, examining the effects of Dp44mT on EGFR expression in these cells demonstrated that this latter agent was also able to significantly (p < 0.05) reduce total EGFR levels in both PANC-1 and HT-29 siControl cells (Fig. 9, A and B), as was shown in Fig. 7, A and B. However, upon NDRG1 silencing, although Dp44mT still slightly, but not significantly (p > 0.05), reduced EGFR levels in HT-29 cells, it had no significant effect on EGFR in PANC-1 cells when compared with control cells incubated with NDRG1 siRNA (Fig. 9, A and B). Hence, in contrast to the effects of DpC, the inhibitory effects of Dp44mT on EGFR levels were NDRG1-dependent.
Dp44mT and DpC Are More Effective at Inhibiting Cancer Cell Proliferation When Compared with the EGFR Inhibitor Erlotinib
Currently, EGFR inhibitors are widely used clinically for the treatment of a variety of cancers (28, 31, 70). However, this class of drugs has significant limitations due to the following: 1) the development of resistance in some cancers, and 2) the numerous mutations of EGFR in individual cancers that render these agents ineffective (28, 31, 70). Hence, a novel strategy to inhibit this important oncogene is essential.
Here, we demonstrated that Dp44mT and DpC markedly up-regulated NDRG1 expression, which was accompanied by a significant reduction in EGFR levels (Fig. 6) and activation in response to EGF (Fig. 7) in both PANC-1 and HT-29 cells. These agents have also shown marked anti-cancer and anti-metastatic activity against a range of belligerent neoplasms, including pancreatic and colon cancers in vitro and in vivo (3, 4, 18, 21–23). Hence, we next examined how Dp44mT and DpC compare with a clinically used EGFR inhibitor, namely erlotinib (70). To investigate this, we performed proliferation assays using the pancreatic cancer cell types, PANC-1 and MIAPaCa-2, as well as the colon cancer cells, HT-29 and HCT-116. All of these cell types have been previously shown to be resistant to erlotinib (71). Hence, it was important to determine whether Dp44mT or DpC could overcome this property. These cells were incubated with the following: 1) the negative control compound, Dp2mT, for both Dp44mT or DpC; 2) the classical iron sequestering agent DFO; 3) Dp44mT or DpC, or 4) the clinically used EGFR inhibitor erlotinib (4, 70) for 72 h at 37 °C, and cell proliferation was examined using MTT assays.
Examining the negative control Dp2mT, we demonstrated that this agent did not induce any inhibition (IC50 > 20 μm; Table 1) of proliferation in all cells examined (Fig. 10, A–D). Moreover, erlotinib was found to have a very limited ability to inhibit the proliferation of these cells, with the IC50 value not being reached (IC50 >80 μm; Table 1) in the PANC-1, HT-29, and MIAPaCa-2 cells. In HCT-116 cells, erlotinib was demonstrated to have an IC50 value of 9.23 ± 0.10 μm, making it the least effective agent examined (Fig. 10, A–D; Table 1).
TABLE 1.
IC50 values (μm) of PANC-1, HT-29, MIAPaCa-2, and HCT-116 cells following a 72-h at 37 °C incubation with either Dp2mT, DFO, Dp44mT, DpC, or erlotinib
Results are mean ± S.D. of three experiments. Relative to erlotinib, * is p < 0.05 and *** is p < 0.001.
| Cell type | Dp2mT | Erlotinib | DFO | Dp44mT | DpC |
|---|---|---|---|---|---|
| μm | μm | μm | μm | μm | |
| PANC-1 | >20 | >80 | 4.38 ± 0.30 | 0.04 ± 0.10 | 0.04 ± 0.03 |
| HT-29 | >20 | >80 | 0.19 ± 0.40 | 0.02 ± 0.02 | 0.03 ± 0.10 |
| MIAPaCa-2 | >20 | >80 | 5.10 ± 0.70 | 0.04 ± 0.60 | 0.04 ± 0.20 |
| HCT-116 | >20 | 9.23 ± 0.10 | 0.20 ± 0.20* | 0.02 ± 0.05*** | 0.03 ± 0.02*** |
FIGURE 10.

Dp44mT and DpC overcome resistance to the clinically used EGFR inhibitor, erlotinib. PANC-1 (A), HT-29 (B), MIAPaCa-2 (C), and HCT-116 (D) cancer cells were incubated with either Dp2mT, DFO, Dp44mT, DpC, or the EGFR inhibitor erlotinib for 72 h/37 °C at a range of concentrations (0–80 μm), and cell proliferation was examined via an MTT assay (see “Experimental Procedures”). Data are presented are mean ± S.D. of three experiments.
DFO displayed moderate anti-proliferative activity in each of the cell types examined, with IC50 values ranging from 0.19 to 5.10 μm (Fig. 10, A–D; Table 1). However, both Dp44mT and DpC were found to have the most potent anti-proliferative activity in each of the cell types examined, with IC50 values ranging from 0.02 to 0.04 μm, which were significantly (p < 0.001) lower than those for erlotinib and DFO (Table 1). These results clearly demonstrate the highly potent anti-proliferative activity of Dp44mT and DpC and also their marked ability to overcome resistance to Erlotinib.
Dp44mT and DpC Markedly Reduce EGFR, HER2, and HER3 Expression in Human Tumor Xenografts in Vivo
Considering the marked effect of Dp44mT and particularly DpC on reducing activation of EGFR, HER2, and HER3 levels in PANC-1 and HT-29 cells (Fig. 7), further investigations examined this effect in vivo (Fig. 11). In these studies, PANC-1 cells were injected subcutaneously into the right flank of BALB/c nu/nu mice to establish tumor xenografts. Once the tumors reached an approximate size of 90 mm3, the animals were treated with either vehicle control, Dp44mT (0.4 mg/kg), or DpC (5 mg/kg) intravenously 5 days/week for 23 days. These doses were specifically chosen based on optimization of the treatment schedules with these agents in previous investigations (3, 21, 23). In fact, the doses chosen were optimal for maximum activity and minimum toxicity. In this study, Dp44mT and DpC significantly (p < 0.001–0.01) decreased PANC-1 tumor growth to 29.9 ± 8.8% (n = 6) and 19.3 ± 1.4% (n = 6) of the control, respectively, after 23 days (Fig. 11A). Notably, DpC had totally inhibited tumor growth after this treatment period, with no significant (p > 0.05) difference observed in tumor size between days 0 and 23.
FIGURE 11.

Dp44mT and DpC markedly inhibit PANC-1 tumor xenograft growth in nude mice and cause a pronounced decrease in EGFR, HER2, and HER3 levels in the tumor in vivo. PANC-1 tumor xenografts were grown subcutaneously in nude mice that were separated into three groups (n = 6/group), with each group receiving either Dp44mT (0.4 mg/kg), DpC (5 mg/kg), or the vehicle control intravenously (tail vein; 5 days/week; Monday through Friday) for up to 23 days, as described in detail under “Experimental Procedures.” A, both Dp44mT and DpC markedly inhibit PANC-1 tumor growth. Immunohistochemistry was then performed on formalin-fixed tumor tissue sections to examine EGFR (B); HER2 (C), or HER3 (D) protein expression. Scale bar represents 1 mm. Quantitation of EGFR, HER2, and HER3 staining was performed as described under “Experimental Procedures.” Results in A are shown as mean ± S.E. (n = 6), and the data in B–D are the analysis of EGFR, HER2, and HER3 staining, which represents the mean ± S.D. (n = 18; six tumor samples/treatment group, with an average taken from three random images/sample). Relative to the control: **, p < 0.01; ***, p < 0.001.
Tumor tissues were then examined by immunohistochemistry for the expression of EGFR, HER2, and HER3 (Fig. 11, B–D). EGFR, HER2, and HER3 were found to be highly expressed in the PANC-1 tumor xenografts from control animals treated with the vehicle alone (Fig. 11, B–D). These vehicle control-treated animals had tumors expressing EGFR, HER2, and HER3 with an ImmunoMembrane Classification score of 3 ± 0.01. However, animals treated with Dp44mT or DpC showed significantly (p < 0.001) lower levels of EGFR in tumors when compared with the vehicle control, with an ImmunoMembrane Classification score of 0.5 ± 0.015 for each (Fig. 11B). Moreover, HER2 expression was also significantly (p < 0.01) decreased in PANC-1 tumors from Dp44mT- and DpC-treated animals relative to the control. This led to an ImmunoMembrane Classification score of 1.5 ± 0.6 and 2 ± 0.2, respectively (Fig. 11C). The expression of HER3 was also significantly (p < 0.001–0.01) decreased in tumors from animals treated with Dp44mT or DpC resulting in an ImmunoMembrane Classification score of 1.3 ± 0.5 and 0.7 ± 0.2, respectively (Fig. 11D). These results in vivo are in good agreement with our in vitro data using PANC-1 cells demonstrating the inhibitory effect of Dp44mT and DpC on EGFR, HER2, and HER3 expression (Fig. 7A).
Discussion
The metastasis suppressor NDRG1 has demonstrated marked anti-oncogenic activity in multiple neoplasms, being associated with decreased cell proliferation, migration, invasion, and angiogenesis (2, 4–12, 16). In addition, NDRG1 was found to be negatively correlated with tumor progression, while being positively correlated with better patient prognosis for a range of cancers, including those of the prostate, breast, colon, and pancreas (5, 11–13, 16).
Considering the potential therapeutic implications of utilizing NDRG1 as a molecular target for the treatment of cancer, the molecular mechanisms by which NDRG1 is able to exert its anti-cancer effects have recently become the subject of intense research. As a result, a number of oncogenic signaling pathways that contribute to cancer progression and development were found to be negatively regulated by NDRG1, including the TGF-β, PI3K, RAS (6, 8), WNT (17, 18), NF-κB (16), c-Src (19), and ROCK/pMLC2 (20) pathways.
Although these recent studies have provided insight into the function of NDRG1 in cancer cells, the mechanism of how NDRG1 affects so many different signaling pathways remains to be established. Considering that, this study focused on examining the effects of NDRG1 on a crucial family of receptor tyrosine kinases, namely EGFR, HER2, and HER3, all of which act to activate a wide array of downstream oncogenic signaling pathways (28–32, 43, 72).
For the first time we demonstrate that NDRG1 is able to markedly and significantly inhibit both the levels and membrane localization of the EGFR in PANC-1 and CFPAC-1 pancreatic and HT-29 colon cancer cells. The effect of NDRG1 on EGFR was found to be post-transcriptional, there being no effect on EGFR mRNA levels. Moreover, NDRG1 also markedly inhibited the dimerization and activation of EGFR in response to its ligand EGF, leading to decreased phosphorylation and activation of the downstream MAPKK kinase, MEK1/2.
Apart from the MAPKK kinases, a number of other important oncogenic signaling pathways are also directly activated by EGFR, namely PI3K, RAS, and c-Src, which then integrate into other oncogenic pathways, including NF-κB, TGF-β, and WNT (28–32, 43, 72). In fact, EGF-mediated activation of EGFR and subsequent EGFR phosphorylation at Tyr-1068, Tyr-1086, and Tyr-1148 is directly required for the ability of this receptor to bind to and activate these oncogenic pathways (28–32, 43, 72). Considering this, our results demonstrating that NDRG1 decreased the phosphorylation of EGFR at Tyr-1068, Tyr-1086, and Tyr-1148 in response to EGF provides, for the first time, a mechanism by which this metastasis suppressor is able to inhibit the PI3K, RAS, WNT, TGF-β, c-Src, and NF-κB signaling pathways (Fig. 12) (6, 8, 16–19).
FIGURE 12.
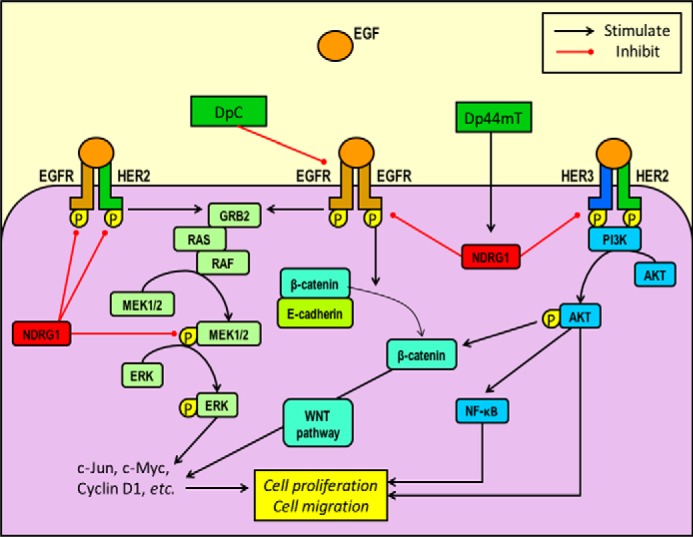
Schematic diagram demonstrating the differential inhibitory effect of the novel thiosemicarbazones, Dp44mT and DpC, on their molecular targets, namely NDRG1, EGFR, HER2, and HER3 and their downstream pathways. Dp44mT up-regulates NDRG1 in cancer cells, leading to inhibition of EGFR/EGFR, EGFR/HER2, and HER2/HER3 dimer formation and activation in response to EGF ligand stimulation. In contrast, although DpC up-regulates NDRG1 (although to a lesser extent than Dp44mT), it inhibits EGFR levels and phosphorylation independently of NDRG1. Some of the downstream pathways affected by the EGFR, HER2, and HER3 receptors, include the PI3K, NF-κB, RAS, MAPK, and WNT pathways (28), many of which have been demonstrated to be inhibited by NDRG1 expression, leading to marked suppression of the epithelial to mesenchymal transition, invasion, migration, and tumorigenesis (1–4, 6, 8, 11, 14, 17–19).
Notably, as evident from the pEGFR/EGFR ratio (Fig. 2, A, panel ii, and B, panel ii), the effect of NDRG1 on the suppression of total EGFR levels was more pronounced compared with its effect on phosphorylated forms. This suggests the suppressive mechanism by which NDRG1 decreases activated EGFR involves the down-regulation of EGFR protein levels, rather than a direct effect on its phosphorylation.
In addition to EGFR, this study also assessed the effect of NDRG1 on two additional ErbB family members, namely HER2 and HER3. This was important to examine as both HER2 and HER3 can activate similar downstream pathways as EGFR and can form heterodimers with EGFR and with each other (28–32, 43, 72). Our results demonstrate that NDRG1 also markedly inhibited the activation of both HER2 and HER3 in PANC-1 and HT-29 cells in response to EGF stimulation (Fig. 3). Interestingly, the effect of NDRG1 on reducing pHER2 and pHER3 levels was found to be due to a reduction in total HER2 and HER3 in the PANC-1 cells. In contrast for HT-29 cells, NDRG1 appeared to directly affect HER2 and HER3 phosphorylation, with no effect on their total levels in this cell type. In addition, the formation of the EGFR/HER2, and in particular, the highly expressed and potently oncogenic HER2/HER3 heterodimer, was also decreased by NDRG1 in both PANC-1 and HT-29 cells (Fig. 4). Moreover, the EGFR/HER3 heterodimer was not affected by this metastasis suppressor (Fig. 4).
Interestingly, heterodimers containing HER2 have been reported to be more potent due to their slow rate of ligand dissociation, as well as the reduced rate of receptor internalization (55, 56) Hence, signaling by HER2 containing heterodimers is prolonged and leads to enhanced activation of downstream pathways (55, 56). In fact, the EGFR/HER2 and HER2/HER3 heterodimers, the latter of which was found to be the most potent of all ErbB heterodimers, are able to activate key oncogenic downstream pathways, namely PI3K/AKT and RAS (55, 56). These subsequently integrate into other pathways such as NF-κB, WNT, TGF-β, etc., that promote cellular proliferation, survival, metabolism, and invasion (57–60). Hence, the ability of NDRG1 to prevent the formation of these latter heterodimers provides yet another mechanism by which it is able to potently inhibit such a wide array of downstream signaling pathways (Fig. 12).
The ability of NDRG1 to reduce total EGFR levels in PANC-1 and HT-29 cells appears crucial to inhibiting its downstream activation and oncogenic functions. However, the mechanism underlying this effect remains to be fully elucidated. As shown in this study, NDRG1 affects the protein levels of EGFR rather than its mRNA expression. Hence, it is likely that NDRG1 influences EGFR protein degradation in the cells examined. Interestingly, previous studies have shown that NDRG1 is highly expressed in the endosome and plays an important role in endosomal dynamics (73), with this latter protein being found to promote endosomal degradation of the low density lipoprotein receptor (LDLR) (74). Moreover, NDRG1 depletion was found to result in abnormal endosomal sequestration of LDLR, suggesting that NDRG1 function is required for endosomal maturation (74). Similarly to LDLR, membrane EGFR is also degraded after internalization by receptor-mediated endocytosis (44). This observation suggests that the loss of NDRG1 in cancer cells might contribute to impaired EGFR degradation and a subsequent increase in EGFR activity. Conversely, the overexpression of NDRG1 could promote internalization and receptor-mediated degradation of EGFR, leading to reduced EGFR levels and activation, as demonstrated in this study.
Considering the marked anti-oncogenic effects of NDRG1 reported in this study and by others (2, 4–12, 16, 18), novel therapeutics that can target this latter molecule would clearly have a marked impact on cancer treatment. As such, our studies were extended to examining a novel class of anti-cancer agents, namely the di-2-pyridyl thiosemicarbazones, Dp44mT and DpC, which have been shown to up-regulate NDRG1 expression in both PANC-1, HT-29, and a variety of other cancer cells (1, 3, 4, 18, 20, 23).
For the first time, we demonstrate that Dp44mT and DpC significantly decrease EGFR levels, particularly at the cell membrane (Fig. 6, C and D), and were also able to inhibit the activation of EGFR in response to EGF (Fig. 7). Moreover, DpC also inhibited the levels and activation of both HER2 and HER3 in PANC-1 and HT-29 cells (Fig. 8). Finally, an in vivo analysis of these agents using PANC-1 xenografts (Fig. 11) also revealed that Dp44mT and DpC both markedly decreased the levels of EGFR, HER2, and HER3 in tumor tissues, which is in good agreement with the in vitro data (Fig. 7A).
Intriguingly, DpC was found to be the most potent agent in terms of its inhibitory effect on EGFR, pEGFR (Tyr-1068, Tyr-1086, and Tyr-1148), HER2, pHER2, HER3, and pHER3 in both PANC-1 and HT-29 cells in vitro (Figs. 6 and 7) when compared with Dp44mT. However, although DpC also increased NDRG1 expression in these cells, this effect was not as marked as that observed with Dp44mT and DFO (Figs. 6 and 7). Hence, apart from its ability to target NDRG1, there is likely another mechanism by which DpC inhibits the expression and activation of EGFR, HER2, and HER3. In fact, this study demonstrated that the ability of DpC to form complexes with iron and copper (21) may also contribute to its ability to inhibit EGFR activation. This was particularly notable for the iron complex in terms of reducing EGFR phosphorylation at Tyr-1068. Such an effect could be related to the ability of the lipophilic iron complex to easily penetrate the cell membrane and then transmetallate iron intracellularly, leading to the release of some of the free ligand (Fig. 8, A, panel i, and B, panel i). This suggestion is supported by the fact that the DpC-iron complex could up-regulate NDRG1, but not to the same extent as the free ligand. Hence, the process of transmetallation by the DpC-iron complex, which is known to occur for di-2-pyridylketone thiosemicarbazone complexes (45), could be an important factor in terms of inhibiting EGFR phosphorylation at Tyr-1068.
Together, the findings in this study further support the growing body of evidence indicating the highly potent and selective activity of the novel di-2-pyridylketone class of thiosemicarbazones (3, 18, 21–23), of which DpC is set to enter clinical trials later in 2015. In fact, we recently demonstrated the marked ability of DpC to potently inhibit the growth of a highly aggressive lung cancer in vivo, with this agent also being orally active and well tolerated (3, 21).
Moreover, a recent study also showed the marked effect of Dp44mT on inhibiting breast cancer metastasis in vivo, further demonstrating the important anti-metastatic properties of this class of chemotherapeutics (18). This latter investigation demonstrated that the effect of Dp44mT on up-regulating NDRG1 expression was crucial for this anti-cancer effect (18). This is in agreement with this study, which also showed that NDRG1 was crucial for the EGFR inhibitory effect of Dp44mT and further highlights the importance of NDRG1 as a molecular target for this agent. It is of interest that despite the marked up-regulation of NDRG1 by both Dp44mT and DpC that the down-regulation of EGFR mediated by both these agents was only NDRG1-dependent for Dp44mT. This indicates that despite the close structural similarity of these two agents, DpC acts to inhibit EGFR by other mechanisms that are yet to be identified.
The development of more effective and potent agents for the treatment of cancer is of particular importance considering the widespread problem of resistance to many anti-cancer agents used currently in the clinics, including EGFR inhibitors (28, 29, 43). In fact, although EGFR inhibitors have shown promise for the treatment of some tumors, their effects are inconsistent and largely affected by the many different mutations and alterations of EGFR encountered in cancer patients (46). In contrast, the thiosemicarbazone, Dp44mT, was found to overcome resistance to many anti-tumor agents (23, 69). Moreover, in this study, we demonstrate that the pancreatic PANC-1 and MIAPaCa-2 as well as the colon HT-29 and HCT-116 cells were far more sensitive to Dp44mT and DpC when compared with the clinically used EGFR inhibitor, erlotinib (28, 70). All the cell types used to assess erlotinib were found to be resistant to this agent (59, 71). Hence, the ability of Dp44mT and DpC to target NDRG1 and EGFR, as well as to overcome resistance to erlotinib, contributes to their marked potential as an innovative approach for cancer treatment.
In summary, the fact that NDRG1 is able to regulate such a vast number of signaling pathways suggested that it plays an important central role in cell signaling. In this study, we demonstrate that NDRG1 inhibits the activation of key regulators of multiple oncogenic signaling pathways, namely the ErbB family members EGFR, HER2, and HER3. These findings reveal a mechanism behind the tremendously broad downstream effects of NDRG1 in cancer cells. In addition, we have demonstrated that promising new anti-cancer agents, namely Dp44mT and DpC, which can induce NDRG1, are also able to inhibit the expression and activation of EGFR, HER2, and HER3 both in vitro and in vivo. Together, these findings contribute a new perspective on NDRG1 function and provide a novel therapeutic strategy of targeting this important molecule with agents to prevent cancer metastasis, which is a major killer.
Author Contributions
Z. K. and S. V. M. designed experiments, performed the majority of the experiments, analyzed results, and wrote the manuscript. S. S., D. H. B., and D J. R. L. performed the experiments shown in Fig. 8. D. S. K., S. S., and D. J. R. L. wrote the manuscript. D. R. R. designed the experiments, analyzed results, and wrote the manuscript.
This work was supported in part by National Health and Medical Research Council Australia Senior Principal Research Fellowship APP1062607 (to D. R. R.), National Health and Medical Research Council Australia Peter Doherty Early Career Fellowship APP1037323, and National Health and Medical Research Council Australia Project Grant APP1060482 (to D. R. R., Z. K., and D. S. K.). D.R.R. is a stakeholder in the companies, Oncochel Therapeutics LLC and Oncochel Therapeutics Pty Ltd., that are developing the dipyridyl thiosemicarbazone, DpC, for the treatment of cancer. D.R.R. also consults for Oncochel Therapeutics LLC and Pty Ltd.
- Dp44mT
- di-2-pyridylketone 4,4-dimethyl-3-thiosemicarbazone
- DFO
- desferrioxamine
- Dp2mT
- di-2-pyridylketone 2-methyl-3-thiosemicarbazone
- DpC
- di-2-pyridylketone-4-cyclohexyl-4-methyl-3-thiosemicarbazone
- EGFR
- epidermal growth factor receptor
- MAPKK
- mitogen-activated protein kinase kinase
- MTT
- 3–4,5-dimethylthiazol-2-yl-2,5-diphenyl tetrazolium
- Bistris
- 2-[bis(2-hydroxyethyl)amino]-2-(hydroxymethyl)propane-1,3-diol
- VC
- vector control.
References
- 1.Le N. T., and Richardson D. R. (2004) Iron chelators with high antiproliferative activity up-regulate the expression of a growth inhibitory and metastasis suppressor gene: a link between iron metabolism and proliferation. Blood 104, 2967–2975 [DOI] [PubMed] [Google Scholar]
- 2.Kovacevic Z., Fu D., and Richardson D. R. (2008) The iron-regulated metastasis suppressor, Ndrg-1: Identification of novel molecular targets. Biochim. Biophys. Acta 1783, 1981–1992 [DOI] [PubMed] [Google Scholar]
- 3.Kovacevic Z., Chikhani S., Lovejoy D. B., and Richardson D. R. (2011) Novel thiosemicarbazone iron chelators induce up-regulation and phosphorylation of the metastasis suppressor N-myc down-stream regulated gene 1: a new strategy for the treatment of pancreatic cancer. Mol. Pharmacol. 80, 598–609 [DOI] [PubMed] [Google Scholar]
- 4.Chen Z., Zhang D., Yue F., Zheng M., Kovacevic Z., and Richardson D. R. (2012) The iron chelators Dp44mT and DFO inhibit TGF-β-induced epithelial-mesenchymal transition via up-regulation of N-Myc downstream-regulated gene 1 (NDRG1). J. Biol. Chem. 287, 17016–17028 [DOI] [PMC free article] [PubMed] [Google Scholar]
- 5.Bandyopadhyay S., Pai S. K., Gross S. C., Hirota S., Hosobe S., Miura K., Saito K., Commes T., Hayashi S., Watabe M., and Watabe K. (2003) The Drg-1 gene suppresses tumor metastasis in prostate cancer. Cancer Res. 63, 1731–1736 [PubMed] [Google Scholar]
- 6.Dixon K. M., Lui G. Y., Kovacevic Z., Zhang D., Yao M., Chen Z., Dong Q., Assinder S. J., and Richardson D. R. (2013) Dp44mT targets the AKT, TGF-β and ERK pathways via the metastasis suppressor NDRG1 in normal prostate epithelial cells and prostate cancer cells. Br. J. Cancer 108, 409–419 [DOI] [PMC free article] [PubMed] [Google Scholar]
- 7.Ellen T. P., Ke Q., Zhang P., and Costa M. (2008) NDRG1, a growth and cancer related gene: regulation of gene expression and function in normal and disease states. Carcinogenesis 29, 2–8 [DOI] [PubMed] [Google Scholar]
- 8.Kovacevic Z., Chikhani S., Lui G. Y., Sivagurunathan S., and Richardson D. R. (2013) The iron-regulated metastasis suppressor NDRG1 targets NEDD4L, PTEN, and SMAD4 and inhibits the PI3K and Ras signaling pathways. Antioxid. Redox Signal. 18, 874–887 [DOI] [PubMed] [Google Scholar]
- 9.Kovacevic Z., and Richardson D. R. (2006) The metastasis suppressor, Ndrg-1: a new ally in the fight against cancer. Carcinogenesis 27, 2355–2366 [DOI] [PubMed] [Google Scholar]
- 10.Kovacevic Z., Sivagurunathan S., Mangs H., Chikhani S., Zhang D., and Richardson D. R. (2011) The metastasis suppressor, N-myc downstream regulated gene 1 (NDRG1), upregulates p21 via p53-independent mechanisms. Carcinogenesis 32, 732–740 [DOI] [PubMed] [Google Scholar]
- 11.Maruyama Y., Ono M., Kawahara A., Yokoyama T., Basaki Y., Kage M., Aoyagi S., Kinoshita H., and Kuwano M. (2006) Tumor growth suppression in pancreatic cancer by a putative metastasis suppressor gene Cap43/NDRG1/Drg-1 through modulation of angiogenesis. Cancer Res. 66, 6233–6242 [DOI] [PubMed] [Google Scholar]
- 12.Bandyopadhyay S., Pai S. K., Hirota S., Hosobe S., Takano Y., Saito K., Piquemal D., Commes T., Watabe M., Gross S. C., Wang Y., Ran S., and Watabe K. (2004) Role of the putative tumor metastasis suppressor gene Drg-1 in breast cancer progression. Oncogene 23, 5675–5681 [DOI] [PubMed] [Google Scholar]
- 13.Strzelczyk B., Szulc A., Rzepko R., Kitowska A., Skokowski J., Szutowicz A., and Pawelczyk T. (2009) Identification of high-risk stage II colorectal tumors by combined analysis of the NDRG1 gene expression and the depth of tumor invasion. Ann. Surg. Oncol. 16, 1287–1294 [DOI] [PubMed] [Google Scholar]
- 14.Fang B. A., Kovačević Ž., Park K. C., Kalinowski D. S., Jansson P. J., Lane D. J., Sahni S., and Richardson D. R. (2014) Molecular functions of the iron-regulated metastasis suppressor, NDRG1, and its potential as a molecular target for cancer therapy. Biochim. Biophys. Acta 1845, 1–19 [DOI] [PubMed] [Google Scholar]
- 15.Sun J., Zhang D., Bae D. H., Sahni S., Jansson P., Zheng Y., Zhao Q., Yue F., Zheng M., Kovacevic Z., and Richardson D. R. (2013) Metastasis suppressor, NDRG1, mediates its activity through signaling pathways and molecular motors. Carcinogenesis 34, 1943–1954 [DOI] [PubMed] [Google Scholar]
- 16.Hosoi F., Izumi H., Kawahara A., Murakami Y., Kinoshita H., Kage M., Nishio K., Kohno K., Kuwano M., and Ono M. (2009) N-myc downstream regulated gene 1/Cap43 suppresses tumor growth and angiogenesis of pancreatic cancer through attenuation of inhibitor of κB kinase β expression. Cancer Res. 69, 4983–4991 [DOI] [PubMed] [Google Scholar]
- 17.Jin R., Liu W., Menezes S., Yue F., Zheng M., Kovacevic Z., and Richardson D. R. (2014) The metastasis suppressor, NDRG1, modulates β-catenin phosphorylation and nuclear translocation by mechanisms involving FRAT1 and PAK4. J. Cell Sci. 127, 3116–3130 [DOI] [PubMed] [Google Scholar]
- 18.Liu W., Xing F., Iiizumi-Gairani M., Okuda H., Watabe M., Pai S. K., Pandey P. R., Hirota S., Kobayashi A., Mo Y. Y., Fukuda K., Li Y., and Watabe K. (2012) N-myc downstream regulated gene 1 modulates Wnt-β-catenin signalling and pleiotropically suppresses metastasis. EMBO Mol. Med. 4, 93–108 [DOI] [PMC free article] [PubMed] [Google Scholar]
- 19.Liu W., Yue F., Zheng M., Merlot A., Bae D. H., Huang M., Lane D., Jansson P., Lui G. Y., Richardson V., Sahni S., Kalinowski D., Kovacevic Z., and Richardson D. R. (2015) The proto-oncogene c-Src and it downstream signaling pathways are inhibited by the metastasis suppressor, NDRG1. Oncotarget 6, 8851–8874 [DOI] [PMC free article] [PubMed] [Google Scholar]
- 20.Sun J., Zhang D., Zheng Y., Zhao Q., Zheng M., Kovacevic Z., and Richardson D. R. (2013) Targeting the metastasis suppressor, NDRG1, using novel iron chelators: regulation of stress fiber-mediated tumor cell migration via modulation of the ROCK1/pMLC2 signaling pathway. Mol. Pharmacol. 83, 454–469 [DOI] [PubMed] [Google Scholar]
- 21.Lovejoy D. B., Sharp D. M., Seebacher N., Obeidy P., Prichard T., Stefani C., Basha M. T., Sharpe P. C., Jansson P. J., Kalinowski D. S., Bernhardt P. V., and Richardson D. R. (2012) Novel second-generation di-2-pyridylketone thiosemicarbazones show synergism with standard chemotherapeutics and demonstrate potent activity against lung cancer xenografts after oral and intravenous administration in vivo. J. Med. Chem. 55, 7230–7244 [DOI] [PubMed] [Google Scholar]
- 22.Yuan J., Lovejoy D. B., and Richardson D. R. (2004) Novel di-2-pyridyl-derived iron chelators with marked and selective antitumor activity: in vitro and in vivo assessment. Blood 104, 1450–1458 [DOI] [PubMed] [Google Scholar]
- 23.Whitnall M., Howard J., Ponka P., and Richardson D. R. (2006) A class of iron chelators with a wide spectrum of potent antitumor activity that overcomes resistance to chemotherapeutics. Proc. Natl. Acad. Sci. U.S.A. 103, 14901–14906 [DOI] [PMC free article] [PubMed] [Google Scholar]
- 24.Lane D. J., Saletta F., Suryo Rahmanto Y., Kovacevic Z., and Richardson D. R. (2013) N-myc downstream regulated 1 (NDRG1) is regulated by eukaryotic initiation factor 3a (eIF3a) during cellular stress caused by iron depletion. PLoS ONE 8, e57273. [DOI] [PMC free article] [PubMed] [Google Scholar]
- 25.Wang J., Yin D., Xie C., Zheng T., Liang Y., Hong X., Lu Z., Song X., Song R., Yang H., Sun B., Bhatta N., Meng X., Pan S., Jiang H., and Liu L. (2014) The iron chelator Dp44mT inhibits hepatocellular carcinoma metastasis via N-Myc downstream-regulated gene 2 (NDRG2)/gp130/STAT3 pathway. Oncotarget 5, 8478–8491 [DOI] [PMC free article] [PubMed] [Google Scholar]
- 26.Jansson P. J., Yamagishi T., Arvind A., Seebacher N., Gutierrez E., Stacy A., Maleki S., Sharp D., Sahni S., and Richardson D. R. (2015) Di-2-pyridylketone 4,4-dimethyl-3-thiosemicarbazone (Dp44mT) overcomes multidrug resistance by a novel mechanism involving the hijacking of lysosomal P-glycoprotein (Pgp). J. Biol. Chem. 290, 9588–9603 [DOI] [PMC free article] [PubMed] [Google Scholar]
- 27.Morandell S., Stasyk T., Skvortsov S., Ascher S., and Huber L. A. (2008) Quantitative proteomics and phosphoproteomics reveal novel insights into complexity and dynamics of the EGFR signaling network. Proteomics 8, 4383–4401 [DOI] [PubMed] [Google Scholar]
- 28.Arteaga C. L., and Engelman J. A. (2014) ERBB receptors: from oncogene discovery to basic science to mechanism-based cancer therapeutics. Cancer Cell 25, 282–303 [DOI] [PMC free article] [PubMed] [Google Scholar]
- 29.Chang Z. G., Wei J. M., Qin C. F., Hao K., Tian X. D., Xie K., Xie X. H., and Yang Y. M. (2012) Suppression of the epidermal growth factor receptor inhibits epithelial-mesenchymal transition in human pancreatic cancer PANC-1 cells. Dig. Dis. Sci. 57, 1181–1189 [DOI] [PubMed] [Google Scholar]
- 30.Soltoff S. P., Carraway K. L. 3rd, Prigent S. A., Gullick W. G., and Cantley L. C. (1994) ErbB3 is involved in activation of phosphatidylinositol 3-kinase by epidermal growth factor. Mol. Cell. Biol. 14, 3550–3558 [DOI] [PMC free article] [PubMed] [Google Scholar]
- 31.Troiani T., Martinelli E., Capasso A., Morgillo F., Orditura M., De Vita F., and Ciardiello F. (2012) Targeting EGFR in pancreatic cancer treatment. Curr. Drug Targets 13, 802–810 [DOI] [PubMed] [Google Scholar]
- 32.Moasser M. M. (2007) The oncogene HER2: its signaling and transforming functions and its role in human cancer pathogenesis. Oncogene 26, 6469–6487 [DOI] [PMC free article] [PubMed] [Google Scholar]
- 33.Mendoza-Naranjo A., El-Naggar A., Wai D. H., Mistry P., Lazic N., Ayala F. R., da Cunha I. W., Rodriguez-Viciana P., Cheng H., Tavares Guerreiro Fregnani J. H., Reynolds P., Arceci R. J., Nicholson A., Triche T. J., Soares F. A., et al. (2013) ERBB4 confers metastatic capacity in Ewing sarcoma. EMBO Mol. Med. 5, 1019–1034 [DOI] [PMC free article] [PubMed] [Google Scholar]
- 34.Carpenter G. (2003) ErbB-4: mechanism of action and biology. Exp. Cell Res. 284, 66–77 [DOI] [PubMed] [Google Scholar]
- 35.Hu T., and Li C. (2010) Convergence between Wnt-β-catenin and EGFR signaling in cancer. Mol. Cancer 9, 236. [DOI] [PMC free article] [PubMed] [Google Scholar]
- 36.Accornero P., Miretti S., Starvaggi Cucuzza L., Martignani E., and Baratta M. (2010) Epidermal growth factor and hepatocyte growth factor cooperate to enhance cell proliferation, scatter, and invasion in murine mammary epithelial cells. J. Mol. Endocrinol. 44, 115–125 [DOI] [PubMed] [Google Scholar]
- 37.Krall J. A., Beyer E. M., and MacBeath G. (2011) High- and low-affinity epidermal growth factor receptor-ligand interactions activate distinct signaling pathways. PLoS ONE 6, e15945. [DOI] [PMC free article] [PubMed] [Google Scholar]
- 38.Richardson D. R., Sharpe P. C., Lovejoy D. B., Senaratne D., Kalinowski D. S., Islam M., and Bernhardt P. V. (2006) Dipyridyl thiosemicarbazone chelators with potent and selective antitumor activity form iron complexes with redox activity. J. Med. Chem. 49, 6510–6521 [DOI] [PubMed] [Google Scholar]
- 39.Gao J., and Richardson D. R. (2001) The potential of iron chelators of the pyridoxal isonicotinoyl hydrazone class as effective antiproliferative agents, IV: the mechanisms involved in inhibiting cell-cycle progression. Blood 98, 842–850 [DOI] [PubMed] [Google Scholar]
- 40.Yu X., Sharma K. D., Takahashi T., Iwamoto R., and Mekada E. (2002) Ligand-independent dimer formation of epidermal growth factor receptor (EGFR) is a step separable from ligand-induced EGFR signaling. Mol. Biol. Cell 13, 2547–2557 [DOI] [PMC free article] [PubMed] [Google Scholar]
- 41.Richardson D. R., Tran E. H., and Ponka P. (1995) The potential of iron chelators of the pyridoxal isonicotinoyl hydrazone class as effective antiproliferative agents. Blood 86, 4295–4306 [PubMed] [Google Scholar]
- 42.Tuominen V. J., Tolonen T. T., and Isola J. (2012) ImmunoMembrane: a publicly available web application for digital image analysis of HER2 immunohistochemistry. Histopathology 60, 758–767 [DOI] [PubMed] [Google Scholar]
- 43.Ciardiello F., and Tortora G. (2008) EGFR antagonists in cancer treatment. N. Engl. J. Med. 358, 1160–1174 [DOI] [PubMed] [Google Scholar]
- 44.Authier F., Métioui M., Bell A. W., and Mort J. S. (1999) Negative regulation of epidermal growth factor signaling by selective proteolytic mechanisms in the endosome mediated by cathepsin B. J. Biol. Chem. 274, 33723–33731 [DOI] [PubMed] [Google Scholar]
- 45.Richardson D. R., Kalinowski D. S., Richardson V., Sharpe P. C., Lovejoy D. B., Islam M., and Bernhardt P. V. (2009) 2-Acetylpyridine thiosemicarbazones are potent iron chelators and antiproliferative agents: redox activity, iron complexation and characterization of their antitumor activity. J. Med. Chem. 52, 1459–1470 [DOI] [PubMed] [Google Scholar]
- 46.Zhang Q., Dai H. H., Dong H. Y., Sun C. T., Yang Z., and Han J. Q. (2014) EGFR mutations and clinical outcomes of chemotherapy for advanced non-small cell lung cancer: A meta-analysis. Lung Cancer 85, 339–345 [DOI] [PubMed] [Google Scholar]
- 47.Paul I., Bhattacharya S., Chatterjee A., and Ghosh M. K. (2013) Current understanding on EGFR and Wnt/β-Catenin signaling in glioma and their possible crosstalk. Genes Cancer 4, 427–446 [DOI] [PMC free article] [PubMed] [Google Scholar]
- 48.Chen J., Chen J. K., Nagai K., Plieth D., Tan M., Lee T. C., Threadgill D. W., Neilson E. G., and Harris R. C. (2012) EGFR signaling promotes TGFβ-dependent renal fibrosis. J. Am. Soc. Nephrol. 23, 215–224 [DOI] [PMC free article] [PubMed] [Google Scholar]
- 49.Wiley H. S., and Burke P. M. (2001) Regulation of receptor tyrosine kinase signaling by endocytic trafficking. Traffic 2, 12–18 [DOI] [PubMed] [Google Scholar]
- 50.Baulida J., Kraus M. H., Alimandi M., Di Fiore P. P., and Carpenter G. (1996) All ErbB receptors other than the epidermal growth factor receptor are endocytosis impaired. J. Biol. Chem. 271, 5251–5257 [DOI] [PubMed] [Google Scholar]
- 51.Muthuswamy S. K., Gilman M., and Brugge J. S. (1999) Controlled dimerization of ErbB receptors provides evidence for differential signaling by homo- and heterodimers. Mol. Cell. Biol. 19, 6845–6857 [DOI] [PMC free article] [PubMed] [Google Scholar]
- 52.Kim H. H., Sierke S. L., and Koland J. G. (1994) Epidermal growth factor-dependent association of phosphatidylinositol 3-kinase with the erbB3 gene product. J. Biol. Chem. 269, 24747–24755 [PubMed] [Google Scholar]
- 53.Witton C. J., Reeves J. R., Going J. J., Cooke T. G., and Bartlett J. M. (2003) Expression of the HER1–4 family of receptor tyrosine kinases in breast cancer. J. Pathol. 200, 290–297 [DOI] [PubMed] [Google Scholar]
- 54.Tovey S. M., Witton C. J., Bartlett J. M., Stanton P. D., Reeves J. R., and Cooke T. G. (2004) Outcome and human epidermal growth factor receptor (HER) 1–4 status in invasive breast carcinomas with proliferation indices evaluated by bromodeoxyuridine labelling. Breast Cancer Res. 6, R246–R251 [DOI] [PMC free article] [PubMed] [Google Scholar]
- 55.Graus-Porta D., Beerli R. R., Daly J. M., and Hynes N. E. (1997) ErbB-2, the preferred heterodimerization partner of all ErbB receptors, is a mediator of lateral signaling. EMBO J. 16, 1647–1655 [DOI] [PMC free article] [PubMed] [Google Scholar]
- 56.Tzahar E., Pinkas-Kramarski R., Moyer J. D., Klapper L. N., Alroy I., Levkowitz G., Shelly M., Henis S., Eisenstein M., Ratzkin B. J., Sela M., Andrews G. C., and Yarden Y. (1997) Bivalence of EGF-like ligands drives the ErbB signaling network. EMBO J. 16, 4938–4950 [DOI] [PMC free article] [PubMed] [Google Scholar]
- 57.Lenferink A. E., Pinkas-Kramarski R., van de Poll M. L., van Vugt M. J., Klapper L. N., Tzahar E., Waterman H., Sela M., van Zoelen E. J., and Yarden Y. (1998) Differential endocytic routing of homo- and hetero-dimeric ErbB tyrosine kinases confers signaling superiority to receptor heterodimers. EMBO J. 17, 3385–3397 [DOI] [PMC free article] [PubMed] [Google Scholar]
- 58.Yao E., Zhou W., Lee-Hoeflich S. T., Truong T., Haverty P. M., Eastham-Anderson J., Lewin-Koh N., Gunter B., Belvin M., Murray L. J., Friedman L. S., Sliwkowski M. X., and Hoeflich K. P. (2009) Suppression of HER2/HER3-mediated growth of breast cancer cells with combinations of GDC-0941 PI3K inhibitor, trastuzumab, and pertuzumab. Clin. Cancer Res. 15, 4147–4156 [DOI] [PubMed] [Google Scholar]
- 59.Vijapurkar U., Kim M. S., and Koland J. G. (2003) Roles of mitogen-activated protein kinase and phosphoinositide 3′-kinase in ErbB2/ErbB3 coreceptor-mediated heregulin signaling. Exp. Cell Res. 284, 291–302 [DOI] [PubMed] [Google Scholar]
- 60.Zaczek A., Brandt B., and Bielawski K. P. (2005) The diverse signaling network of EGFR, HER2, HER3 and HER4 tyrosine kinase receptors and the consequences for therapeutic approaches. Histol. Histopathol. 20, 1005–1015 [DOI] [PubMed] [Google Scholar]
- 61.Roberts P. J., and Der C. J. (2007) Targeting the Raf-MEK-ERK mitogen-activated protein kinase cascade for the treatment of cancer. Oncogene 26, 3291–3310 [DOI] [PubMed] [Google Scholar]
- 62.Alessi D. R., Saito Y., Campbell D. G., Cohen P., Sithanandam G., Rapp U., Ashworth A., Marshall C. J., and Cowley S. (1994) Identification of the sites in MAP kinase kinase-1 phosphorylated by p74raf-1. EMBO J. 13, 1610–1619 [DOI] [PMC free article] [PubMed] [Google Scholar]
- 63.Merlot A. M., Kalinowski D. S., and Richardson D. R. (2013) Novel chelators for cancer treatment: where are we now? Antioxid. Redox Signal. 18, 973–1006 [DOI] [PubMed] [Google Scholar]
- 64.Kalinowski D. S., and Richardson D. R. (2005) The evolution of iron chelators for the treatment of iron overload disease and cancer. Pharmacol. Rev. 57, 547–583 [DOI] [PubMed] [Google Scholar]
- 65.Sahni S., Bae D. H., Lane D. J., Kovacevic Z., Kalinowski D. S., Jansson P. J., and Richardson D. R. (2014) The metastasis suppressor, N-myc downstream-regulated gene 1 (NDRG1), inhibits stress-induced autophagy in cancer cells. J. Biol. Chem. 289, 9692–9709 [DOI] [PMC free article] [PubMed] [Google Scholar]
- 66.Richardson D., Ponka P., and Baker E. (1994) The effect of the iron(III) chelator, desferrioxamine, on iron and transferrin uptake by the human malignant melanoma cell. Cancer Res. 54, 685–689 [PubMed] [Google Scholar]
- 67.Murakami Y., Hosoi F., Izumi H., Maruyama Y., Ureshino H., Watari K., Kohno K., Kuwano M., and Ono M. (2010) Identification of sites subjected to serine/threonine phosphorylation by SGK1 affecting N-myc downstream-regulated gene 1 (NDRG1)/Cap43-dependent suppression of angiogenic CXC chemokine expression in human pancreatic cancer cells. Biochem. Biophys. Res. Commun. 396, 376–381 [DOI] [PubMed] [Google Scholar]
- 68.Murray J. T., Campbell D. G., Morrice N., Auld G. C., Shpiro N., Marquez R., Peggie M., Bain J., Bloomberg G. B., Grahammer F., Lang F., Wulff P., Kuhl D., and Cohen P. (2004) Exploitation of KESTREL to identify NDRG family members as physiological substrates for SGK1 and GSK3. Biochem. J. 384, 477–488 [DOI] [PMC free article] [PubMed] [Google Scholar]
- 69.Lovejoy D. B., Jansson P. J., Brunk U. T., Wong J., Ponka P., and Richardson D. R. (2011) Antitumor activity of metal-chelating compound Dp44mT is mediated by formation of a redox-active copper complex that accumulates in lysosomes. Cancer Res. 71, 5871–5880 [DOI] [PubMed] [Google Scholar]
- 70.Frolov A., Schuller K., Tzeng C. W., Cannon E. E., Ku B. C., Howard J. H., Vickers S. M., Heslin M. J., Buchsbaum D. J., and Arnoletti J. P. (2007) ErbB3 expression and dimerization with EGFR influence pancreatic cancer cell sensitivity to erlotinib. Cancer Biol. Ther. 6, 548–554 [DOI] [PubMed] [Google Scholar]
- 71.Buck E., Eyzaguirre A., Brown E., Petti F., McCormack S., Haley J. D., Iwata K. K., Gibson N. W., and Griffin G. (2006) Rapamycin synergizes with the epidermal growth factor receptor inhibitor erlotinib in non-small-cell lung, pancreatic, colon, and breast tumors. Mol. Cancer Ther. 5, 2676–2684 [DOI] [PubMed] [Google Scholar]
- 72.Cheng J. C., Chang H. M., and Leung P. C. (2012) Epidermal growth factor induces human oviductal epithelial cell invasion by down-regulating E-cadherin expression. J. Clin. Endocrinol. Metab. 97, E1380–1389 [DOI] [PubMed] [Google Scholar]
- 73.Kachhap S. K., Faith D., Qian D. Z., Shabbeer S., Galloway N. L., Pili R., Denmeade S. R., DeMarzo A. M., and Carducci M. A. (2007) The N-Myc down regulated Gene1 (NDRG1) Is a Rab4a effector involved in vesicular recycling of E-cadherin. PLoS ONE 2, e844. [DOI] [PMC free article] [PubMed] [Google Scholar]
- 74.Pietiäinen V., Vassilev B., Blom T., Wang W., Nelson J., Bittman R., Bäck N., Zelcer N., and Ikonen E. (2013) NDRG1 functions in LDL receptor trafficking by regulating endosomal recycling and degradation. J. Cell Sci. 126, 3961–3971 [DOI] [PubMed] [Google Scholar]