Abstract
Advanced glycation end products (AGE) accumulate in diabetic patients and aging people because of high amounts of three- or four-carbon sugars derived from glucose, thereby causing multiple consequences, including inflammation, apoptosis, obesity, and age-related disorders. It is important to understand the mechanism of AGE-mediated signaling leading to the activation of autophagy (self-eating) that might result in obesity. We detected AGE as one of the potent inducers of autophagy compared with doxorubicin and TNF. AGE-mediated autophagy is inhibited by suppression of PI3K and potentiated by the autophagosome maturation blocker bafilomycin. It increases autophagy in different cell types, and that correlates with the expression of its receptor, receptor for AGE. LC3B, the marker for autophagosomes, is shown to increase upon AGE stimulation. AGE-mediated autophagy is partially suppressed by inhibitor of NF-κB, PKC, or ERK alone and significantly in combination. AGE increases sterol regulatory element binding protein activity, which leads to an increase in lipogenesis. Although AGE-mediated lipogenesis is affected by autophagy inhibitors, AGE-mediated autophagy is not influenced by lipogenesis inhibitors, suggesting that the turnover of lipid droplets overcomes the autophagic clearance. For the first time, we provide data showing that AGE induces several cell signaling cascades, like NF-κB, PKC, ERK, and MAPK, that are involved in autophagy and simultaneously help with the accumulation of lipid droplets that are not cleared effectively by autophagy, therefore causing obesity.
Keywords: autophagy, diabetes, lipid droplet, NF-κB transcription factor, obesity, signal transduction
Introduction
Because of non-enzymatic glycosylation (glycation) of cellular proteins, advanced glycation end products (AGE)2 are formed by reducing sugars or their reactive carbonyl metabolites, such as methylglyoxal (MGO) and glycolaldehyde. Accumulation of AGE in the aging tissues leads to several pathological consequences (1–3). The subsequent increase in AGE leads to oxidant stress and tissue damage (4). AGE are known to interact with their specific receptors, RAGE (receptors for AGE), which results in cell signaling that induces various ailments like retinopathy, neuropathy, nephropathy, and atherosclerosis (5, 6). Chronic inflammation affects the tissue environment, especially in age-related diseases like diabetes, atherosclerosis, cancer, etc. (7). Diabetic patients are often prone to obesity because of the activation of lipogenesis.
The inability of peripheral tissues to take up glucose in insulin resistance leads to altered metabolic conditions associated with obesity, type 2 diabetes, and cardiovascular diseases. High amounts of glucose increase lipogenesis and autophagy (8, 9). Lipid accumulation is a marker for nutrient excess in cells. Autophagy/autophagocytosis is an intracellular degradation system that delivers cytoplasmic constituents to the lysosome and regulates intracellular energy homeostasis and metabolism (10–12). Although autophagy is a simple process, it plays an important role and has physiological and pathophysiological consequences. TNF, a monokine, has been reported previously to be one of the major immune regulators of macroautophagy in skeletal muscles (13). On the other hand, doxorubicin, a potent anti-cancer drug, has been shown to increase autophagy flux in cardiomyocytes (14). Half of the autophagy genes (Atg), discovered in yeast, have mammalian counterparts, such as Beclin1 and DNA-damage regulated autophagy modulator 1 (DRAM1). These genes are required for the activation of autophagy and are under the control of different transcription factors. Mammalian microtubular light chain protein 3 (LC3B), the counterpart of yeast Atg8, has been shown to be cleaved, modified, and attached to the autophagosome membrane (15). p62, a signaling multidomain scaffold protein, binds to LC3B and is accumulated, followed by degradation in autophagosomes (16). LAMP2 encodes three variants, LAMP-2A, LAMP-2B, and LAMP-2C. These are lysosomal membrane proteins implicated in the measurement of autophagy turnover (17). AGE have been shown to increase NF-κB activation upon interaction with their receptor, RAGE, and induce inflammatory responses (18, 19). Recruitment of the molecules in the cytoplasmic milieu upon this AGE-RAGE interaction is still unknown. Many molecules involved in autophagy are dependent on NF-κB (20–22). Although autophagy is regulated by activation of the Ras-Raf kinase-MAPK pathway (23, 24), the AGE-mediated induction of these molecules is still unknown. There might be a correlation between the activation of the NF-κB and Ras pathways for AGE-mediated autophagy. Diminished metabolic activities often lead to an increase in sugar level and, later on, lipogenesis, especially in aged persons and diabetic patients. High sugar levels increase AGE under these conditions. In this study, we clearly show that the increased amount of AGE leads to lipid accumulation in cells. Sterol regulatory element binding protein (SREBP) is a basic helix-loop-helix transcription factor that expresses several genes involved in cholesterol, fatty acids, phospholipids, and triglycerides synthesis (25, 26). The statin group of compounds is known to block lipogenesis by inhibiting the HMG-CoA pathway (27). Because AGE increase lipogenesis via activation of SREBP on one hand and autophagy on the other, there might be a correlation between AGE-mediated autophagy and lipogenesis.
Autophagy is beneficial to cells and individuals. However, AGE mediate several deleterious effects, and lipogenesis is one of them. To nullify this effect, autophagy might start immediately upon AGE stimulation. Clearance of these lipids is ideal for autophagy. Surprisingly, we found that AGE-mediated autophagy is unable to clear the lipids. For the first time, we provide data showing that AGE-mediated autophagy is unable to reduce the lipid load in cells that arises because of a high amount of AGE in cells. Obesity has typical adverse effects in these scenarios. This study will help to design therapeutics that will help to reduce obesity by targeting the signaling cascade that helps to reduce lipogenesis in addition to the classical therapeutic medicines like the statin group of compounds or peroxisome proliferator-activated receptor analogs, which are used as anti-diabetes drugs and often have obesity as a side effect.
Experimental Procedures
Reagent and Cell Culture
Unless noted otherwise, all chemicals and anti-tubulin antibody were obtained from Sigma-Aldrich (St. Louis, MO). TRIzol was purchased from Invitrogen. DMEM, FBS, and Lipofectamine transfection reagent were obtained from Life Technologies. DAPI was purchase from Molecular Probes (Eugene, OR). Novastatin was obtained from Lupin Laboratories Ltd. (Mumbai, India). Anti-RAGE antibody was from Santa Cruz Biotechnology (Santa Cruz, CA). All other antibodies were from Cell Signaling Technology (Beverly, MA). The LC3B-GFP clone was a gift from Dr. Noboru Mizushima (University of Tokyo, Japan). Dr. Annapurni Rangarajan (Indian Institute of Science) provided Atg7 and Atg12 shRNA.
The human cell lines used in this study were HepG2 (hepatocellular carcinoma), HeLa (epithelial adenocarcinoma), U-87 (glioblastoma), A-431 (epidermoid adenocarcinoma), U-937 (histiocytic lymphoma), HCT116 (colorectal carcinoma), HaCaT (keratinocyte), Hep3B (hepatocellular carcinoma), MDA-MB-231 (breast adenocarcinoma), and Saos-2 (osteosarcoma) and were obtained from the ATCC. The PC3 (prostatic adenocarcinoma) cell line was obtained from the National Centre for Cell Science (Pune, India).
Preparation of AGE and Assay for Measuring Their Concentration
Human serum albumin (HSA) was dissolved in saline solution (4 mg/ml) and incubated with MGO for 7 days under sterile conditions at 37 °C. HSA was glycated nonenzymatically by MGO. The mixture was dialyzed and the concentration of glycated HSA was measured by the Periodate method as described earlier (28). The amount of glycated HSA was 4 nmol/mg of HSA (equivalent to 0.3 mol/mol of HSA). This MGO-incorporated HSA was considered AGE and used further in this study.
MDC Staining
Cells were washed three times with PBS (pH 7.4) and stained with MDC for 10 min at 37 °C after their respective treatments. Thereafter, intracellular MDC was measured by fluorescence photometry/fluorimetry (excitation at 380 nm and emission at 525 nm) as described previously (29). Similarly, treated cells were used for fluorescence microscopy for qualitative analysis of autophagy. Autophagy was measured by determining the increased intensity of fluorescence in MDC-stained autophagosomes. The amount of autophagy is represented as -fold increase per relative fluorescence units.
RT-PCR
The TRIzol method was used to isolate total RNA from treated cells. 1 μg of total RNA (quantified by absorbance at 260 nm) was reverse-transcribed into cDNA by the ONE-Step-Access RT-PCR kit (Promega, Madison, WI), followed by amplification of the gene of interest using gene-specific primers for Beclin-1, DRAM1, and tubulin. PCR was performed by inactivating avian myeloblastosis virus and RNA primer denaturation for 4 min at 94 °C and by repeating the cycles at 94, 55, and 72 °C. Amplified products were separated on agarose gel by gel electrophoresis (2%) and visualized by ethidium bromide staining.
Transfection with GFP-LC3B
To visualize AGE-mediated autophagosome formation/induction, HepG2 cells were transiently transfected with vector control GFP and GFP-LC3B constructs using the Lipofectamine reagent kit according to the instructions. After 5 h, cells were incubated in rich DMEM for the next 12 h. Cells were used further to determine the amount of LC3B by fluorescence microscopy or Western blot by analyzing whole-cell extracts.
EMSA
The DNA binding activity of NF-κB and SREBP was determined by EMSA as described before (30). Briefly, nuclear extract proteins (10 μg) were incubated with 32P end-labeled, double-stranded oligonucleotides, and the DNA-protein complexes were separated from free oligonucleotides on 7.5% native polyacrylamide gel and visualized in an image reader using Multi-Gauge software 3.0 (Fuji, Japan).
Immunofluorescence Staining
Treated cells were washed gently three times and fixed by 4% paraformaldehyde for 15 min at 37 °C, followed by 0.1% Triton-mediated permeabilization at 30 °C for 15 min. This was followed by gentle washing with PBS three times, followed by blocking using 1% BSA at room temperature for 30 min and incubation with primary antibody for 90 min at 4 °C. This procedure was followed by washing three times with PBS and incubation with secondary antibody in the dark for 90 min. After washing and air-drying the slide, DAPI was applied, and a coverslip was placed gently to avoid bubbles.
Oil Red Staining
Oil Red O staining was carried out to determine lipogenesis in cells (31). Cells were first fixed in 4% formaldehyde for 30 min and washed with PBS three times, followed by staining with freshly diluted Oil Red O stain (6:1 in water) from 0.5% stock solution in isopropanol for 15 min. After gentle washing with PBS three times, cells were observed under a microscope. For subsequent quantification of lipid droplets, Oil Red O-stained cells were dissolved in isopropanol, and absorbance was recorded at 500 nm.
Western Blot Analysis
After various treatments, whole-cell extracts (WCEs) were prepared, and 50 μg of protein was used for this procedure. The same gel was stripped and used to detect tubulin.
Statistical Analysis
The data were plotted as mean ± S.D. from one experiment of triplicate samples. Statistically significant differences were determined by unpaired Student's t test or one-way analysis of variance followed by the appropriate post hoc test (Tukey's multiple comparison test) using GraphPad Prism5. p < 0.05 was considered to be significant.
Results
HSA coupled with methylglyoxal was used as the AGE for this study. Various reagents, especially inhibitors, used for this study did not show any cytolysis as determined by lactate dehydrogenase release by the treated cells (data not shown).
AGE Induces Autophagy
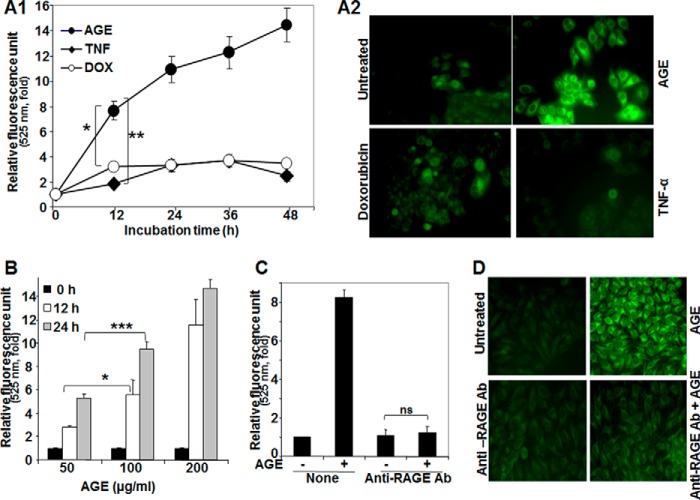
To understand the effect of AGE on autophagy, HepG2 cells were incubated with TNF (1 nm), doxorubicin (1 μm), or AGE (100 μg/ml) for different times. Cells were then stained with MDC, and the fluorescence intensity was measured and indicated in -fold of induction from three independent experiments (Fig. 1A1). All three inducers increased MDC fluorescence kinetically, but AGE-mediated enhancement was more compared with doxorubicin and TNF. MDC-stained HepG2 cells consistently showed increased fluorescence intensity as a result of autophagosome formation by AGE (Fig. 1A2). These data suggest that AGE potently increase autophagy. Furthermore, AGE-mediated autophagy was assessed by fluorescence photometry in a dose-dependent manner (Fig. 1B). AGE are known to bind RAGE and initiate downstream signaling cascades. To confirm this, HepG2 cells were blocked by anti-RAGE antibody, and then the status of autophagy upon AGE treatment was examined by fluorescence photometry and microscopy. Interestingly, these experiments showed that recruitment of RAGE is essential in AGE-mediated autophagy (Fig. 1, C and D).
FIGURE 1.
The effect of AGE on induction of autophagy. A1, HepG2 cells were stimulated with AGE (100 μg/ml), TNF-α (1 nm), or doxorubicin (DOX, 1 μm) for different times in triplicate. After treatments, cells were fixed with paraformaldehyde (4%), washed three times with PBS, stained with MDC (50 μm) for 15 min, and washed three more times with PBS. Cells were collected, and fluorescence was measured and indicated as –fold, considering the unstimulated cell value as 1-fold from three independent experiments. A2, cells were stimulated with AGE, doxorubicin, or TNF for 12 h and stained with MDC. The fluorescence of stained cells was visualized under a fluorescence microscope. B, cells were stimulated with different concentrations of AGE for 0, 12, and 24 h in triplicate, and data are represented as -fold of induction, as determined from two independent experiments. C, cells were pretreated with anti-RAGE antibody (Ab) for 6 h and then stimulated with AGE for 12 h. The autophagy index was measured by fluorescence photometry, and data extrapolated from three independent experiments are represented as induction in mean -fold. D, representative images are shown for the level of autophagy induction in cells pretreated without or with anti-RAGE antibody, followed by AGE for 6 and 12 h, respectively (D). Error bars represent mean ± S.E. (Student's t test). ns, not significant; *, p < 0.05; **, p < 0.01; ***, p < 0.001.
AGE Induces Autophagy Irrespective of Cell Type
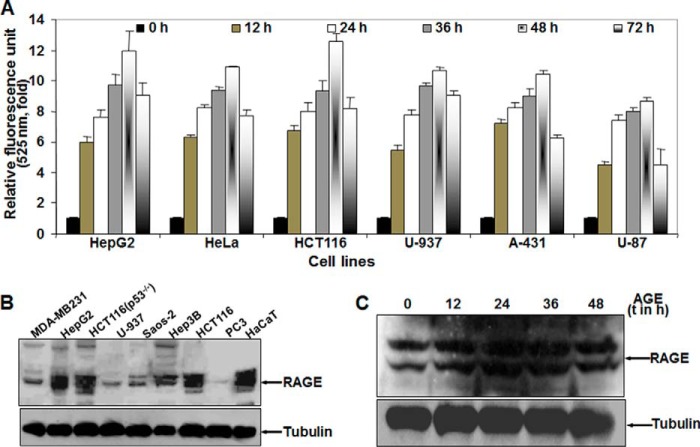
AGE treatment in HepG2 cells resulted in an increase in autophagy in a time- and concentration-dependent manner, but this effect may be cell type-specific. By fluorescence photometry, AGE was found to exemplify autophagy in different cell lines, following a similar pattern as in HepG2 cells, as determined by the fluorescence intensity of MDC-stained cells. The experiments were repeated three times and are indicated in mean -fold increase (Fig. 2A). The amount of RAGE was determined by Western blot analysis of WCE (Fig. 2B). The variation in the level of autophagy in different cell types can be justified by the difference in RAGE expression in these cells. Upon stimulation of AGE for different times, the amount of RAGE was not altered in HepG2 cells (Fig. 2C). This result suggests that AGE are unable to increase the expression of their receptor, RAGE. Collectively, these results support our hypothesis that AGE-mediated autophagy is independent of cell type.
FIGURE 2.
The effect of AGE on induction of autophagy in various cell types. A, different cells were incubated without or with AGE (100 μg/ml) for different times. The fluorescence photometry experiment was performed in triplicate, and data extrapolated from three independent experiments are represented as -fold of induction (mean ± S.E.), taking the unstimulated cell value as 1-fold. B, the basal amount of RAGE was measured from WCEs of various cell lines (100 μg of protein) by Western blot analysis. C, the amount of RAGE was determined from WCE in AGE-stimulated cells for different times (t) by Western blot analysis.
AGE Increase Autophagy
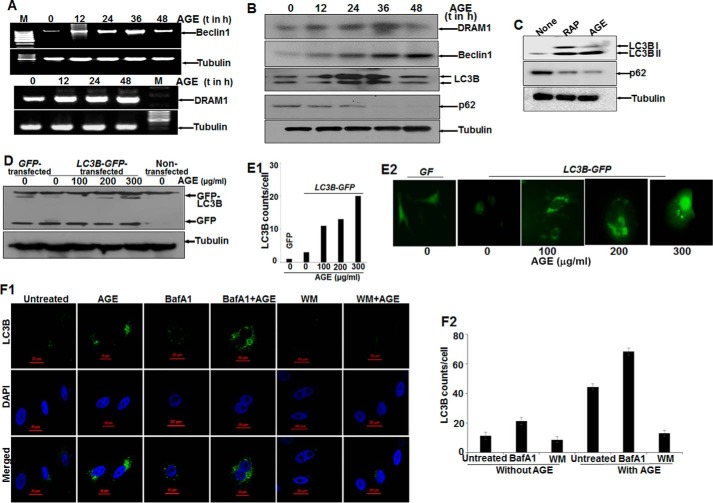
Autophagy markers (LC3B, an indicator of autophagy induction; p62, a marker for autophagic clearance; and Beclin1 and DRAM1, proteins for autophagy initiation) were determined in AGE-stimulated cells. Total mRNA for DRAM1 was increased and stabilized with time. On the other hand, Beclin1 expression was increased and then decreased slightly (Fig. 3A). These data were supported further by determining the amount of proteins as detected by Western blot analysis (Fig. 3B). LC3B expression was found to be dynamic, indicating the induction of autophagy. The decrease in the amount of p62 (Fig. 3C) well complemented our data showing that autophagy was maintained upon AGE treatment.
FIGURE 3.
The effect of AGE on autophagy in HepG2 cells. A, semiquantitative PCR analysis of autophagy genes in AGE-stimulated cells for various time (t) periods. M, marker lane. B, WCEs were prepared from AGE-stimulated cells for different times, and Western blot analysis was performed to detect DRAM1, Beclin1, LC3B, and p62. C, the amounts of LC3B and p62 were determined by Western blot analysis in rapamycin (RAP) and AGE-stimulated cells. D, HepG2 cells were transfected with GFP-LC3B and stimulated with AGE. Western blot analysis was performed from WCEs prepared from these cells, stimulated with different concentrations of AGE for 24 h. E1 and E2, representative fluorescence images from GFP-LC3B transfected cells stimulated without or with different concentrations of AGE for 24 h (E2), and the LC3B puncta counts are plotted as well (E1). F1, immunofluorescence images were captured using ant-LC3B antibody for bafilomycin A1 (BafA1) or WM treatment in the presence or absence of AGE. F2, LC3B dots were counted and plotted.
AGE, like rapamycin, a positive inducer of autophagy, increased autophagy, as shown by an increased amount of LC3B (Fig. 3C). Evidence from the GFP-LC3B transfection study confirmed the formation and accumulation of GFP-LC3B puncta in cells upon AGE treatment, as shown by fluorescent cells (Fig. 3E2) and the number of puncta (Fig. 3E1) and the amount of LC3B from transfected cells (Fig. 3D). Autophagosomes accumulated in cells pretreated with bafilomycin A1, an inhibitor of autophagosome-lysosome fusion, and in AGE-stimulated cells, although wortmannin (WM), an inhibitor of PI3K treatment, decreased this accumulation, as shown by immunofluorescence images (Fig. 3F1) and the number of LC3B puncta (Fig. 3F2). These data suggest that AGE-mediated autophagy might be proceeding through activation of PI3K and that interfering with autophagosome-lysosome fusion protects the autophagosome and prevents further maturation or degradation.
Inhibitors of NF-κB and Raf Kinase Potently Inhibit AGE-mediated Autophagy
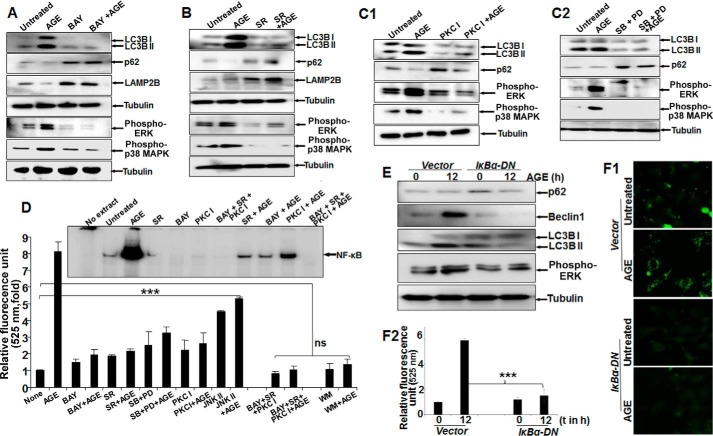
Treatment with AGE alone strongly enhanced the amounts of phospho-ERK1/2, phospho-p38 MAPK, and LC3B, with a notable decrease in p62 and LAMP2B proteins. Conversely, BAY11-7082 (an IKK inhibitor) partially inhibited AGE-mediated autophagy and reduced phosphorylation of ERK1/2 and p38 MAPK (Fig. 4A). Subsequently, the effect of sorafenib (SR) (a Raf kinase inhibitor), PKC I (a PKC inhibitor), and MAPK inhibitors (SB202190 for p38 MAPK and PD98059 for MEK1) on phosphorylation of its target proteins and autophagy was examined by Western blot analysis. The results showed a marked reduction in autophagy and efficient blocking of ERK1/2 and p38 MAPK phosphorylation (Fig. 4, B, C1, and C2). Taken together, these findings clearly indicate that the activation of ERK1/2 and p38 MAPK directed by upstream kinases Raf and PKC is under surveillance of NF-κB and controls autophagy. Overall, the quantitative representation of autophagy, as determined from MDC-stained cell fluorescence, supported the similar activity with various inhibitors, as determined from three independent experiment (Fig. 4D). Subsequently, upon AGE stimulation in IκBα-DN (IκBα dominant negative)-transfected cells, there was a significant reduction in the amount of Beclin1, LC3B, p62, or phospho-ERK (Fig. 4E) and autophagy, as determined by MDC-stained cells (Fig. 4F1) and fluorescence intensity (Fig. 4F2).
FIGURE 4.
The effect of various inhibitors on AGE-mediated autophagy. A, Western blot analysis was performed from WCEs prepared from cells pretreated with the IKKβ/α inhibitor BAY11-7082 (2 μm) for 3 h, followed by AGE (100 μg/ml) stimulation for 12 h. The amounts of LC3B, LAMP2B, p62, phospho-ERK1/2, and phospho-p38 MAPK were determined by Western blot analysis. B, the amounts of phospho-ERK1/2 and phospho-p38 MAPK along with LAMP2B, p-62, and LC3B were determined by Western blot analysis in SR-pretreated cells (10 μm for 3 h) followed by AGE-stimulated (100 μg/ml for 12 h) cells. C1, cells were pretreated with PKC inhibitor (PKC I) (2 μm for 3 h), followed by stimulated with AGE for 12 h. The WCE was used to perform the Western analysis blot to determine the amounts of phospho-ERK1/2, phospho-p38 MAPK, p62, and LC3B. C2, WCE from cells stimulated with AGE for 12 h and pretreated with PD98059 (PD, 2.5 μm for 5 h) or SB202190 (2.5 μm for 5 h) were collected, and we determined the amounts of LC3B, p62, and phopho-ERK1/2 or phospho-p38 MAPK by Western blot analysis. D, HepG2 cells were pretreated with BAY, SR, or PKC I and all together for 3 h, followed by stimulation with AGE for 12 h. Data from one fluorescence photometry experiment of three independent experiments are represented as -fold increase, considering the unstimulated/untreated cell value as 1-fold. Error bars represent mean ± S.E., Student's t test. Inset, NF-κB DNA binding assayed from NE. E, cells transfected with IκBα-DN for 6 h were incubated for 12 h. Cells were stimulated with AGE for 12 h, and the amounts of Bectlin1, LC3B, p62, and phospho-ERK were determined by Western blot analysis. F1 and F2, transfected cells stimulated with AGE were stained with MDC, and fluorescence images are shown (F1) along with quantification (F2). t, time. Error bars represent mean ± S.D. ns, not significant; ***, p < 0.001.
NF-κB Plays an Important Role in AGE-mediated Autophagy
To gain more insights into the mechanism, we investigated the time-dependent activation of NF-κB by AGE. AGE increased NF-κB DNA binding in a time-dependent manner (data not shown). From previous results (Fig. 4, A–D), we suggested the existence of NF-κB-driven MAPK activation via Raf kinase in autophagy. We also found that the amount of nuclear p65 was decreased in BAY-pretreated cells and partially inhibited in SR- or PKC I-pretreated cells, as determined by an immunofluorescence study (data not shown). A gel shift assay demonstrated a similar result with all of these inhibitors (Fig. 4D, inset). The effect of these inhibitors on ERK1/2 phosphorylation strengthened our data by pointing out the existence of a complex cascade involving NF-κB, Raf kinase, PKC, and MAPK in AGE-mediated autophagy regulation.
Autophagy Promotes Lipogenesis, and Autophagy Inhibitors Decrease Its Activation
To explore the contribution of autophagy in lipogenesis, Oil Red O staining was done in AGE-treated HepG2 cells. This further correlated with MDC-stained fluorescence images of autophagosomes. As shown in Fig. 5A, both lipogenesis and autophagy were enhanced remarkably upon AGE stimulation in a time-dependent manner. Mangiferin was used as a known inhibitor of AGE-mediated lipogenesis. To validate the probable role of autophagy in lipogenesis, Oil Red O staining was again done in the presence of autophagy inhibitors and mangiferin and showed a dramatic drop in lipid droplets, as indicated by microscopic viewing (Fig. 5B), and the mean -fold of induction, as determined from absorbance data of three independent experiments (Fig. 5C).
FIGURE 5.
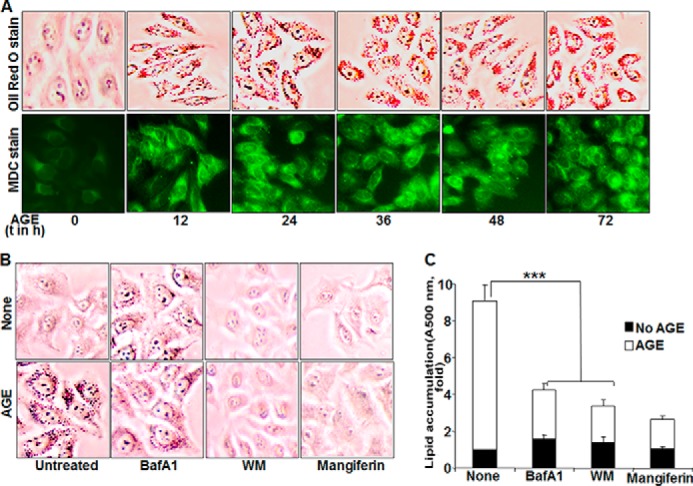
The effect of AGE on autophagy and lipogenesis. A, bottom row, HepG2 cells were stimulated with 100 mg/ml AGE for different times (t). Cells were stained with MDC, followed by visualization under a fluorescence microscope. Top row, stimulated cells were incubated with Oil Red O stain and visualized under a microscope. B, HepG2 cells were pretreated with mangiferin (10 μg/ml) and WM (100 nm) for 3 h or bafilomycin A1 (BafA1, 10 nm) for 5 h, followed by stimulation with AGE (100 μg/ml) for 12 h. Images of Oil Red O-stained cells are shown. C, quantification of Oil Red O-stained particles in HepG2 cells was done by measuring absorption at 500 nm and is represented as -fold, considering the unstimulated cell value as 1-fold. Error bars represent mean ± S.E. (Student's t test). ***, p < 0.001.
AGE-mediated Lipogenesis Is Inhibited Partially by Inhibitors of PKC or MAPK but Significantly by Raf Kinase or IKKs
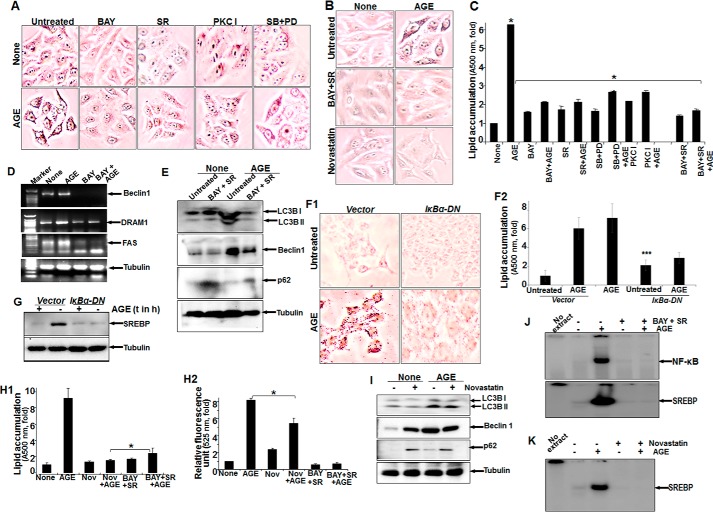
AGE-mediated lipid accumulation, as detected by Oil Red O staining, was inhibited to almost 50% by PKC I or SB and PD98059. BAY or SR inhibited almost 80% of lipid accumulation in AGE-stimulated cells, as shown by microscopic viewing of cells with Oil Red O-stained particles (Fig. 6A) or the absorbance of Oil Red O stain in cells (Fig. 6C). Almost complete inhibition of lipid accumulation was observed in AGE-stimulated cells pretreated with novastatin, a known inhibitor of the HMG-CoA pathway or SR and BAY (Fig. 6B). These data suggest that the NF-κB and Raf kinase pathways are involved in AGE-mediated lipid accumulation.
FIGURE 6.
The effect of various inhibitors on AGE-induced autophagy and lipogenesis. A, HepG2 cells were pretreated with BAY, SR, PKC I, SB, and PD98059 (PD) for 3 h, followed by stimulation with AGE for 12 h. Images of Oil Red O-stained cells were captured under a light microscope and are shown. B, cells were pretreated with BAY and SR or novastatin for 3 h and then stimulated with AGE for 12 h. The images were captured after Oil Red O staining. C, HepG2 cells were pretreated with BAY, SR, PKC I, SB, and PD98059 or BAY and SR for 3 h, followed by AGE stimulation of 12 h. Absorption of Oil Red O-stained particles was recorded at 500 nm and is represented as -fold. D, HepG2 cells were pretreated with BAY for 3 h, followed by stimulation with AGE for 12 h. The amounts of Beclin1, DRAM1, and fatty acyl synthase (FAS) were determined by semiquantitative PCR from total RNA extracted from these cells. E, cells were treated with BAY and SR for 3 h and then stimulated with AGE for 12 h. The amounts of LC3B, Beclin1, and p62 were determined from WCEs. F1 and F2, HepG2 cells transfected with IκBα-DN constructs were stimulated with AGE (100 μg/ml) for 24 h and stained with Oil Red O (F1), and absorbance is indicated as -fold (F2). G, the stimulatory effect of AGE on SREBP expression was assessed by Western blot analysis in IκBα-DN transfected cells. t, time. H1 and H2, cells were treated with novastatin (Nov) or BAY and SR for 3 h and then stimulated with AGE for 12 h. Quantification of lipid droplets was determined in Oil Red O-stained cells (H1) or autophagy and MDC-stained cells. H2, the data indicate –fold, considering the unstimulated cell value as 1-fold. I, the amounts of LC3B, Beclin1, and p62 were determined by Western blot analysis from WCEs of novastatin-treated cells followed by AGE-stimulated cells. J, NF-κB and SREBP DNA binding was determined from NE by gel shift assay collected from BAY- and SR-treated cells followed by AGE-stimulated cells. K, SREBP DNA binding was determined from NE by gel shift assay collected from novastatin-treated cells followed by AGE-stimulated cells. Error bars represent mean ± S.E. (Student's t test). *, p < 0.05; ***, p < 0.001.
AGE-mediated Autophagy and Lipogenesis Are Not Interlinked Mechanistically
To detect the role of AGE-mediated autophagy in lipogenesis, we determined the amount of molecular markers of autophagy. The AGE-mediated increases in the amounts of Beclin1, DRAM1, and fatty acyl synthase were decreased substantially in BAY-pretreated cells as determined by RT-PCR (Fig. 6D). BAY- and SR-pretreated cells showed inhibition of the AGE-mediated increase in the amount of Beclin1, p62, and LCB I and II as determined by Western blot analysis (Fig. 6E). Suppression of AGE-mediated lipid accumulation (Fig. 6, F1 and F2) and SREBP expression, as determined by Western blot analysis (Fig. 6G), was observed in IκBα-DN-transfected cells. These data suggest that NF-κB plays an important role in the regulation of AGE-mediated autophagy. BAY, in combination with SR, completely inhibited AGE-mediated lipogenesis, as shown by the absorbance of Oil Red O-stained particles in cells (Fig. 6H1), and NF-κB and SREBP DNA binding activity (Fig. 6J). Although novastatin completely inhibited AGE-induced SREBP DNA binding (Fig. 6K) and lipogenesis (Fig. 6H1), the amounts of LC3B and Beclin1 (Fig. 6I) and MDC fluorescence (Fig. 6H2) were not decreased significantly. These data suggest that NF-κB and Raf kinase are major determinants for AGE-mediated lipogenesis and autophagy. Lipogenesis may not induce autophagy, and novastatin did not significantly affect autophagy. However, lipogenesis was reduced in the case of autophagy inhibition. Suppression of NF-κB shows significant inhibition of AGE-mediated autophagy and lipogenesis.
AGE kinetically increased SREBP DNA binding (Fig. 7A). Unlabeled SREBP DNA and antibody against SREBP, but not cyclin D1 or p65, suppressed SREBP DNA binding in AGE-induced NE, suggesting the specificity of the SREBP gel shift band (Fig. 7B). Brefeldin A (BR), a blocker of vesicular transport of proteins to the Golgi apparatus, suppressed nuclear translocation of SREBP, as evident from the gel shift assay (Fig. 7C). AGE increased the amount of SREBP, and BR was unable to suppress this, as determined by semiquantitative PCR (Fig. 7D). BR inhibited AGE-mediated SREBP activation, as determined by Western blot analysis (Fig. 7E). These data suggest that AGE increase SREBP at the transcriptional level. Inhibiting autophagy upon Atg7 and Atg12 shRNA transfection and subsequent stimulation with AGE resulted in an increase in the accumulation of lipid droplets in cells (Fig. 7F).
FIGURE 7.
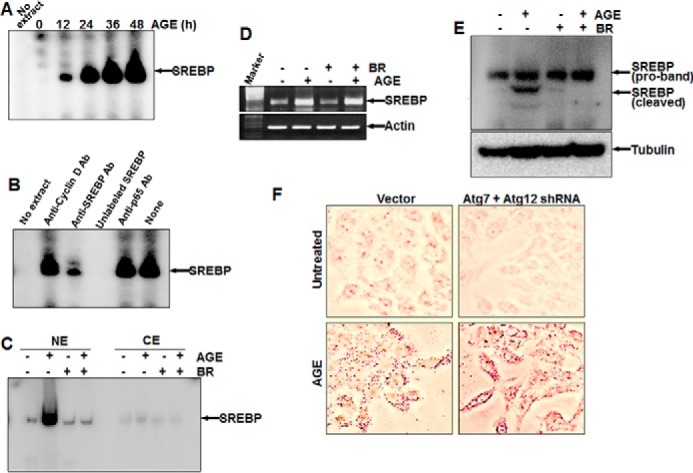
The effect of AGE on SREBP expression and the role of autophagy in lipid accumulation. A, HepG2 cells were stimulated with AGE (100 μg/ml) for different times, and SREBP DNA binding was assayed. B, the Nes of AGE-induced cells were incubated with 2 μg of anti-cyclin D1, anti-SREBP, or anti-p65 antibody or unlabeled SREBP DNA (200 ng, double-stranded) for 1 h at 4 °C, and SREBP DNA binding was assayed. C, cells were treated with BR for 3 h and then stimulated with AGE for 12 h. SREBP DNA binding was determined from NE from 50% cells. CE, cytoplasmic extract. D, the remaining 50% cells were used for semiquantitative PCR to determine the amounts of SREBP mRNA and actin. E, the amount of SREBP was determined from BR-pretreated and AGE-stimulated cells by Western blot analysis. F, HepG2 cells, transfected with Atg7 and Atg12 shRNA were stimulated with AGE for 12 h. Cells were stained with Oil Red O and visualized under a microscope.
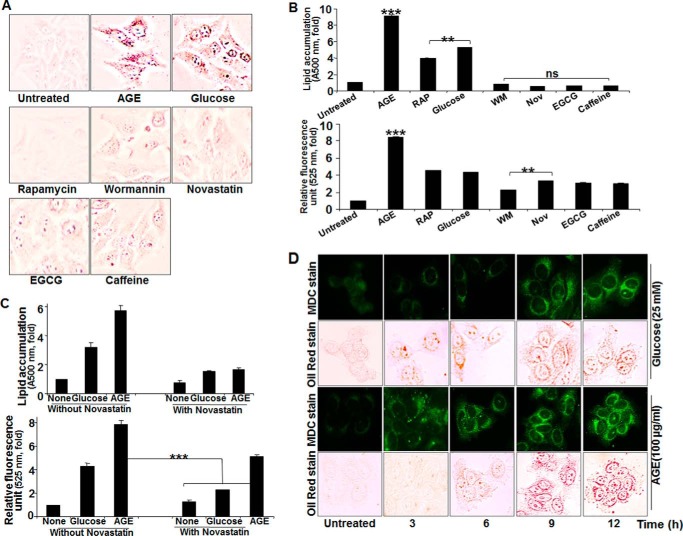
Glucose increased lipogenesis and autophagy almost 4-fold. Compared with glucose, AGE increased both of these almost 8-fold (Fig. 8, A and B). Wortmannin and novastatin did not increase lipogenesis or autophagy. Rapamycin increased autophagy but not lipogenesis. The lipolytic activators caffeine and epigallocatechin gallate also showed reduced lipid accumulation. Novastatin inhibited both glucose- and AGE-mediated lipogenesis (Fig. 8C, top panel), but it inhibited glucose- but not AGE-mediated autophagy (Fig. 8C, bottom panel). Cells, when incubated with 25 mm glucose or 100 μg/ml AGE for different times, showed an accumulation of lipid droplets prior to autophagy induction in the case of glucose, but autophagy was preceded by accumulation of lipid droplets in the case of AGE stimulation (Fig. 8D). Novastatin completely inhibited AGE-mediated lipogenesis but not autophagy, further suggesting that AGE-mediated lipid accumulation is independent of autophagy. These data further suggest that lipogenesis is independent of autophagy in the case of AGE but that it might induce autophagy in the case of glucose.
FIGURE 8.
The effect of various inhibitors on AGE-induced autophagy and lipogenesis. A, HepG2 cells were stimulated with AGE, rapamycin (100 nm), glucose (25 mm), WM (100 nm), novastatin (2 μg/ml), epigallocatechin gallate (EGCG, 10 μm), and caffeine (0.5 μm) for 12 h, followed by Oil Red O staining. B, HepG2 cells, treated with AGE, rapamycin (RAP), glucose, WM, novastatin (Nov), epigallocatechin gallate, and caffeine for 12 h were used for Oil Red O staining and fluorescence photometry. The representative graphs are from single independent experiment showing mean ± S.D. of triplicate samples. C, HepG2 cells were stimulated with AGE and glucose in the presence or absence of Nov for 12 h, and lipid accumulation as well as autophagy index were determined and represented as mean ± S.E. from triplicate samples of two independent experiments. D, HepG2 cells were treated with AGE and glucose for 0, 3, 6, 9, and 12 h. These cells were subjected to double staining. First, cells were stained with MDC, followed by Oil Red O. The represented images were captured in the same view field. Error bars represent mean ± S.E. (Student's t test). ns, not significant; **, p < 0.01; ***, p < 0.001.
Discussion
Accumulated advanced glycation end products have been shown to aggravate several ailments in aged people and diabetic patients. An understanding of the molecular mechanism for these deleterious effects because of high levels of AGE is required for future effective therapy. Obesity is one of the key phenomena under these conditions because of decreased metabolic activities. Presently, several peroxisome proliferator-activated receptor analogs, like glitazones, are in use to treat diabetes and often have obesity as a side effect (32). Autophagy (self-eating) is the “self-consumption” mechanism whereby cells try to remove the unwanted materials inside and renew this debris as a source of energy. Obesity might be triggered by this autophagy mechanism. We found a role of AGE in autophagy and lipogenesis, so the detection of detailed mechanisms between them might help to regulate AGE-mediated deleterious effects like obesity. The role of peroxisome proliferator-activated receptors in obesity and the correlation with autophagy has yet to be studied.
We used glycated HSA, which is made by methylglyoxal, and the amount of HSA used for this study was within the limit of the physiological concentration in the serum. HSA is an inert molecule in terms of cell signaling, but HSA-MGO induces cell signaling via RAGE and acts as AGE. AGE increase autophagy more potently than known inducers like TNF or doxorubicin, as determined by the increase in autophagy markers like beclin1, DRAM1, and LC3B and fluorescence-labeled autophagosomes. Induction of autophagy by AGE is not restricted to specific cell types, but the potency depends on the amount of its receptor, RAGE. When inhibiting type III PI3K by wortmannin, AGE-mediated autophagy is inhibited significantly. AGE-RAGE interaction leads to activation of PI3K, and this might activate downstream signaling molecules to exert AGE-mediated functions (33). Whether RAGE recruits PI3K, a membrane-anchoring enzyme, in its milieu upon ligand interaction needs to be studied further. RAGE has an Ig domain at the N-terminal region and C-terminal region (34) that can act as a binding site for various adaptor molecules. However, the molecules that lead to activation of PI3K or Raf kinase are still unknown. Bafilomycin A1, a known inhibitor of autophagosome maturation (35), potentially protected the AGE-mediated autophagosome from degradation, further suggesting AGE-mediated autophagy.
AGE is known to induce NF-κB through an increase in reactive oxygen species generation followed by IKK activation (36). BAY 11-7082, an IKK complex inhibitor and potent suppressor of NF-κB activation and transfection, with dominant negative IκBα has been shown to inhibit autophagy. NF-κB is known to control several cellular processes. Beclin1, DRAM1, and LCBs are involved in autophagy (15–17). The expression of Beclin1 is dependent on NF-κB (21), and inhibition of NF-κB subsequently suppresses autophagy. AGE mediates NF-κB activation, which regulates autophagy. Sorafenib, a Raf kinase inhibitor, suppressed downstream kinases like ERK and p38 MAPK, followed by reduced autophagy. Even the PKC inhibitor, which suppressed ERK and p38 MAPK, partially inhibited autophagy. Together with the NF-κB inhibitor, the PKC inhibitor and Raf kinase inhibitor have been shown to completely inhibit AGE-mediated autophagy. We found that inhibitors of ERK and p38 MAPK completely inhibited AGE-mediated autophagy in combination with the NF-κB inhibitor (data not shown). Therefore, upstream signaling molecules, either PKC and/or Raf kinase, are involved in inducing AGE-mediated autophagy via activation of the downstream molecules p38 MAPK and ERK.
AGE increases lipogenesis, as shown by the accumulation of lipid droplets, and this is correlated with the autophagic event. Although we are getting these events simultaneously upon AGE-stimulation, exactly how autophagy enhances lipid accumulation needs to be studied further. An autophagy maturation inhibitor, bafilomycin A1, sustained the levels of autophagosomes and also maintained the amount of lipid particles in the cells. The clearance of unwanted cellular content, such as misfolded proteins, non-functional organelles, and lipids, might be regulated tightly by the pathway mediated by various upstream signaling cascades. Several reports have suggested that lipid degradation is preceded by autophagy (37, 38), although we did find sustained lipid droplets in AGE-stimulated autophagy. Caffeine and epigallocatechin gallate clear lipid droplets by activating autophagy. We found that glucose-mediated lipogenesis dictates cells for autophagy, whereas AGE increase autophagy prior to lipid accumulation. This observation illustrated that AGE-mediated autophagy is assisting lipogenesis on one hand and lipolysis on the other and that the end result is accumulation. AGE might induce lipogenesis and autophagy independently, but the amount of lipid generated is more than the utilization in the cells via autophagy. AGE have been shown to induce cell death (28). Accumulated lipid particles might increase AGE-mediated cell death and need to be studied further. Lipogenesis and lipolysis are interlinked phenomena and depend on the expression of SREBP. Processing of SREBP via the Golgi-endoplasmic reticulum network is required for its transcriptional activation, followed by lipogenesis. We found that AGE do not interfere in SREBP processing but increase SREBP expression via NF-κB activation. Statins (e.g. novastatin) are a group of compounds that competitively block the activation of enzymes involved in lipogenesis. Novastatin is known to inhibit SREBP transcriptional ability, thereby disrupting lipogenesis, but this has not interfered significantly with AGE-mediated autophagy. However, the inhibitors of NF-κB, PKC, or Raf kinase partially inhibited lipid accumulation. We found that the PKC inhibitor inhibited Raf kinase (data not shown). Therefore, partial inhibition of AGE-mediated autophagy and lipogenesis by the PKC inhibitor further suggests the involvement of Raf kinase. The inhibitors of Raf kinase and IKKs in combination completely suppressed lipid accumulation, suggesting that these two pathways are involved in AGE-mediated lipogenesis. Downstream inhibitors were also able to reduce AGE-mediated lipogenesis to some extent. However, upstream inhibitors such as BAY and sorafenib were able to block lipogenesis effectively and comparably with the effect of novastatin. However, we provide data suggesting that the AGE-RAGE interaction leads to activation of cell signaling cascades: PKC, Raf kinase, MEK1/2, ERK, p38, MAPK, and IKKs. These events ultimately enhance transcriptional activity of NF-κB and SREBP which lead to increase in lipogenesis and autophagy (Fig. 9). AGE-mediated lipid accumulation and SREBP expression have been shown to be reduced in IκBα-DN-transfected cells, supporting the notion that NF-κB indeed is the master regulator in AGE-mediated lipogenesis.
FIGURE 9.
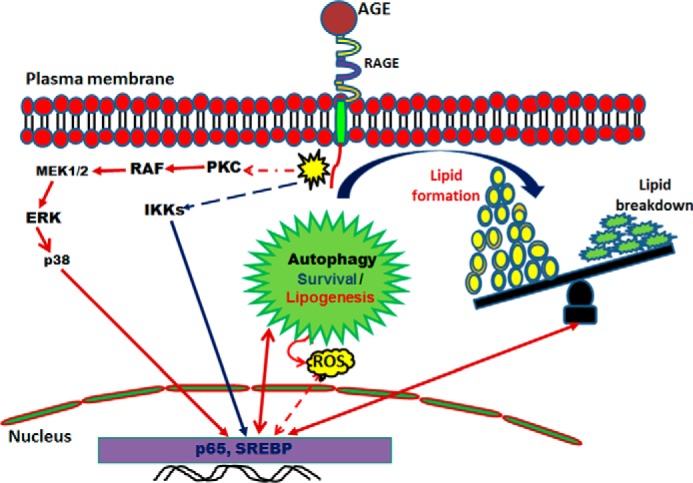
Schematic of AGE-mediated autophagy and lipogenesis. Shown is a proposed model for the role of AGE-mediated autophagy in lipid homeostasis. ROS, reactive oxygen species.
Suppression of autophagy by transfection with Atg7 and Atg12 shRNA led to a significant increase in AGE-induced lipid accumulation, suggesting partial clearance of lipids by autophagy. Simultaneous activation of both pathways resulted in the disturbance of the balance of the overall cytoplasmic lipid droplets. The accumulated lipids generate signals to clear them up by autophagy, but the AGE-mediated induction of lipogenesis dominates their accumulation. Therefore, AGE-mediated deleterious effects are often observed in aged persons or diabetic patients because of the accumulation of high amounts of AGE. This needs to be targeted by designing suitable therapeutics to regulate these signaling pathways and to nullify adverse effects such as lipogenesis or to stimulate the autophagy mechanism to control the unwanted consequences.
Author Contributions
N. V. designed and performed the experiments and prepared the figures. S. K. M. designed the experiments and wrote the manuscript.
This work was supported by a core grant from the Centre for DNA Fingerprinting and Diagnostics and fellowship from the University Grant Commission, Government of India (to N. V.). The authors declare that they have no conflicts of interest with the contents of this article.
- AGE
- advanced glycation end product(s)
- MGO
- methylglyoxal
- SREBP
- sterol regulatory elementary binding protein
- HSA
- human serum albumin
- MDC
- monodansyl cadavarine
- WCE
- whole-cell extract
- WM
- wortmannin
- BAY
- BAY 11-7082
- SR
- sorafenib
- DN
- dominant negative
- BR
- brefeldin A
- SB
- SB202190
- IKK
- inhibitory subunit of NF-κB kinase
- NE
- nuclear extract
- LC3B
- microtubular light chain protein 3.
References
- 1.Odani H., Shinzato T., Matsumoto Y., Usami J., and Maeda K. (1999) Increase in three α,β-dicarbonyl compound levels in human uremic plasma: specific in vivo determination of intermediates in advanced Maillard reaction. Biochem. Biophys. Res. Commun. 256, 89–93 [DOI] [PubMed] [Google Scholar]
- 2.Lapolla A., Flamini R., Dalla Vedova A., Senesi A., Reitano R., Fedele D., Basso E., Seraglia R., and Traldi P. (2003) Glyoxal and methylglyoxal levels in diabetic patients: quantitative determination by a new GC/MS method. Clin. Chem. Lab. Med. 41, 1166–1173 [DOI] [PubMed] [Google Scholar]
- 3.Khuhawar M. Y., Kandhro A. J., and Khand F. D. (2006) Liquid chromatographic determination of glyoxal and methylglyoxal from serum of diabetic patients using meso-stilbenediamine as derivatizing reagent. Anal. Lett. 39, 2205–2215 [Google Scholar]
- 4.Singh R., Barden A., Mori T., and Beilin L. (2001) Advanced glycation end-products: a review. Diabetologia 44, 129–146 [DOI] [PubMed] [Google Scholar]
- 5.Yamagishi S., Nakamura K., and Matsui T. (2006) Advanced glycation end products (AGE) and their receptor (RAGE) system in diabetic retinopathy. Curr. Drug. Discov. Technol. 3, 83–88 [DOI] [PubMed] [Google Scholar]
- 6.Schmidt A. M., Hori O., Chen J. X., Li J. F., Crandall J., Zhang J., Cao R., Yan S. D., Brett J., and Stern D. (1995) Advanced glycation endproducts interacting with their endothelial receptor induce expression of vascular cell adhesion molecule-1 (VCAM-1) in cultured human endothelial cells and in mice. A potential mechanism for the accelerated vasculopathy of diabetes. J. Clin. Invest. 96, 1395–1403 [DOI] [PMC free article] [PubMed] [Google Scholar]
- 7.Franceschi C., Bonafè M., Valensin S., Olivieri F., De Luca M., Ottaviani E., and De Benedictis G. (2000) Inflamm-aging: an evolutionary perspective on immunosenescence. Ann. N.Y. Acad. Sci. 908, 244–254 [DOI] [PubMed] [Google Scholar]
- 8.Guillet-Deniau I., Pichard A. L., Koné A., Esnous C., Nieruchalski M., Girard J., and Prip-Buus C. (2004) Glucose induces de novo lipogenesis in rat muscle satellite cells through a sterol-regulatory-element-binding-protein-1c-dependent pathway. J. Cell Sci. 117, 1937–1944 [DOI] [PubMed] [Google Scholar]
- 9.Ma T., Zhu J., Chen X., Zha D., Singhal P. C., and Ding G. (2013) High glucose induces autophagy in podocytes. Exp. Cell Res. 319, 779–789 [DOI] [PMC free article] [PubMed] [Google Scholar]
- 10.Dell'Angelica E. C., Mullins C., Caplan S., and Bonifacino J. S. (2000) Lysosome-related organelles. FASEB J. 14, 1265–1278 [DOI] [PubMed] [Google Scholar]
- 11.Eskelinen E. L., and Saftig P. (2009) Autophagy: a lysosomal degradation pathway with a central role in health and disease. Biochim. Biophys. Acta 1793, 664–673 [DOI] [PubMed] [Google Scholar]
- 12.Singh R., and Cuervo A. M. (2011) Autophagy in the cellular energetic balance. Cell Metab. 13, 495–504 [DOI] [PMC free article] [PubMed] [Google Scholar]
- 13.Djavaheri-Mergny M., Amelotti M., Mathieu J., Besançon F., Bauvy C., Souquère S., Pierron G., and Codogno P. (2006) NF-κB activation represses tumor necrosis factor-α-induced autophagy. J. Biol. Chem. 281, 30373–30382 [DOI] [PubMed] [Google Scholar]
- 14.Dimitrakis P., Romay-Ogando M. I., Timolati F., Suter T. M., and Zuppinger C. (2012) Effects of doxorubicin cancer therapy on autophagy and the ubiquitin-proteasome system in long-term cultured adult rat cardiomyocytes. Cell Tissue Res. 350, 361–372 [DOI] [PubMed] [Google Scholar]
- 15.Nakatogawa H., Ichimura Y., and Ohsumi Y. (2007) Atg8, a ubiquitin-like protein required for autophagosome formation, mediates membrane tethering and hemifusion. Cell 130, 165–178 [DOI] [PubMed] [Google Scholar]
- 16.Moscat J., and Diaz-Meco M. T. (2009) p62 at the crossroads of autophagy, apoptosis, and cancer. Cell 137, 1001–1004 [DOI] [PMC free article] [PubMed] [Google Scholar]
- 17.Koga H., Kaushik S., and Cuervo A. M. (2010) Altered lipid content inhibits autophagic vesicular fusion. FASEB J. 24, 3052–3065 [DOI] [PMC free article] [PubMed] [Google Scholar]
- 18.Lappas M., Permezel M., and Rice G. E. (2007) Advanced glycation endproducts mediate pro-inflammatory actions in human gestational tissues via nuclear factor-κB and extracellular signal-regulated kinase 1/2. J. Endocrinol. 193, 269–277 [DOI] [PubMed] [Google Scholar]
- 19.Rubenstein D. A., Maria Z., and Yin W. (2011) Glycated albumin modulates endothelial cell thrombogenic and inflammatory responses. J. Diabetes. Sci. Technol. 5, 703–713 [DOI] [PMC free article] [PubMed] [Google Scholar]
- 20.Copetti T., Bertoli C., Dalla E., Demarchi F., and Schneider C. (2009) p65/RelA modulates BECN1 transcription and autophagy. Mol. Cell Biol. 29, 2594–2608 [DOI] [PMC free article] [PubMed] [Google Scholar]
- 21.Johansen T., and Lamark T. (2011) Selective autophagy mediated by autophagic adapter proteins. Autophagy 7, 279–296 [DOI] [PMC free article] [PubMed] [Google Scholar]
- 22.Moscat J., Rennert P., and Diaz-Meco M. T. (2006) PKCζ at the crossroad of NF-κB and Jak1/Stat6 signaling pathways. Cell Death. Differ. 13, 702–711 [DOI] [PubMed] [Google Scholar]
- 23.Ahn J. H., and Lee M. (2013) Autophagy-dependent survival of mutant B-Raf melanoma cells selected for resistance to apoptosis induced by inhibitors against oncogenic B-Raf. Biomol. Ther. 21, 114–120 [DOI] [PMC free article] [PubMed] [Google Scholar]
- 24.Cui Q., Tashiro S., Onodera S., Minami M., and Ikejima T. (2007) Oridonin induced autophagy in human cervical carcinoma HeLa cells through Ras, JNK, and P38 regulation. J. Pharmacol. Sci. 105, 317–325 [DOI] [PubMed] [Google Scholar]
- 25.Ferré P., and Foufelle F. (2007) SREBP-1c transcription factor and lipid homeostasis: clinical perspective. Horm. Res. 68, 72–82 [DOI] [PubMed] [Google Scholar]
- 26.Kotzka J., Lehr S., Roth G., Avci H., Knebel B., and Muller-Wieland D. (2004) Insulin-activated Erk-mitogen-activated protein kinases phosphorylate sterol regulatory element-binding Protein-2 at serine residues 432 and 455 in vivo. J. Biol. Chem. 279, 22404–22411 [DOI] [PubMed] [Google Scholar]
- 27.Cachefo A., Boucher P., Dusserre E., Bouletreau P., Beylot M., and Chambrier C. (2003) Stimulation of cholesterol synthesis and hepatic lipogenesis in patients with severe malabsorption. J. Lipid Res. 44, 1349–1354 [DOI] [PubMed] [Google Scholar]
- 28.Mahali S., Raviprakash N., Raghavendra P. B., and Manna S. K. (2011) Advanced glycation end products (AGE) induce apoptosis via a novel pathway: involvement of Ca2+ mediated by interleukin-8 protein. J. Biol. Chem. 286, 34903–34913 [DOI] [PMC free article] [PubMed] [Google Scholar]
- 29.Biederbick A., Kern H. F., and Elsässer H. P. (1995) Monodansylcadaverine (MDC) is a specific in vivo marker for autophagic vacuoles. Eur. J. Cell Biol. 66, 3–14 [PubMed] [Google Scholar]
- 30.Manna S. K., Babajan B., Raghavendra P. B., Raviprakash N., and Sureshkumar C. (2010) Inhibiting TRAF2-mediated activation of NF-κB facilitates induction of AP-1. J. Biol. Chem. 285, 11617–11627 [DOI] [PMC free article] [PubMed] [Google Scholar]
- 31.Mahali S. K., Verma N., and Manna S. K. (2014) Advanced glycation end products induce lipogenesis: regulation by natural xanthone through inhibition of ERK and NF-κB. J. Cell Physiol. 229, 1972–1980 [DOI] [PubMed] [Google Scholar]
- 32.Jay MA, Ren J. (2007) Peroxisome proliferator-activated receptor (PPAR) in metabolic syndrome and type 2 diabetes mellitus. Curr. Diabetes. Rev. 3, 33–39 [DOI] [PubMed] [Google Scholar]
- 33.Xu A. W., Kaelin C. B., Takeda K., Akira S., Schwartz M. W., and Barsh G. S. (2005) PI3K integrates the action of insulin and leptin on hypothalamic neurons. J. Clin. Invest. 115, 951–958 [DOI] [PMC free article] [PubMed] [Google Scholar]
- 34.Fritz G. (2011) RAGE: a single receptor fits multiple ligands. Trends. Biochem. Sci. 36, 625–632 [DOI] [PubMed] [Google Scholar]
- 35.Yamamoto A., Tagawa Y., Yoshimori T., Moriyama Y., Masaki R., and Tashiro Y. (1998) Bafilomycin A1 prevents maturation of autophagic vacuoles by inhibiting fusion between autophagosomes and lysosomes in rat hepatoma cell line, H-4-II-E cells. Cell Struct. Funct. 23, 33–42 [DOI] [PubMed] [Google Scholar]
- 36.Mahali S. K., and Manna S. K. (2012) β-D-glucoside protects against advanced glycation end products (AGE)-mediated diabetic responses by suppressing ERK and inducing PPAR γ DNA binding. Biochem. Pharmacol. 84, 1681–1690 [DOI] [PubMed] [Google Scholar]
- 37.Kaini R. R., Sillerud L. O., Zhaorigetu S., and Hu C. A. (2012) Autophagy regulates lipolysis and cell survival through lipid droplet degradation in androgen-sensitive prostate cancer cells. Prostate 72, 1412–1422 [DOI] [PMC free article] [PubMed] [Google Scholar]
- 38.Skop V., Cahová M., Papáčková Z., Páleníčková E., Daňková H., Baranowski M., Zabielski P., Zdychová J., Zídková J., and Kazdová L. (2012) Autophagy-lysosomal pathway is involved in lipid degradation in rat liver. Physiol. Res. 61, 287–297 [DOI] [PubMed] [Google Scholar]


