

Abstract

Graphene deposited over a trench has been studied in the context of nanomechanical resonators, where experiments indicate adhesion of the graphene sheet to the trench boundary and sidewalls leads to self-tensioning; however, this adhesion is not well understood. We use molecular dynamics to simulate graphene deposited on a trench and study how adhesion to the sidewalls depends on substrate interaction, temperature, and curvature of the edge of the trench. Over the range of parameters we study, the depth at the center of the sheet is approximately linear in substrate interaction strength and temperature but not trench width, and we explain this using a one-dimensional model for the sheet configuration.
Keywords: Graphene, nanoelectromechanical systems (NEMS), adhesion, substrate, thermal
Nanoelectromechanical systems (NEMS) have demonstrated utility in problems from signal processing to studying phonon mediated mechanical processes.1,2 A promising material for NEMS is graphene, which is both stiff and strong.3,4 Over the past decade, considerable experimental work has been done to design and improve resonators consisting of graphene sheets suspended over trenches.5−9 The mechanical resonance frequency of such resonators implies they are subject to tension, which is generally accepted to be caused by adhesion of the sheets to the substrate sidewalls.10−12 However, questions have been raised about whether the depth to which the graphene adheres is consistent with the strain measured in the devices or if the observed depth is an artifact of atomic force microscopy on a flexible sheet.13 Resolving this issue is important for understanding and controlling the pretension, and hence operating parameters, of graphene nanoresonators. Suspended graphene sheets are also a testing ground for aspects of graphene physics such as wrinkling and rippling of graphene sheets, and experiments on graphene sheets over trenches have revealed, e.g., the possibility of pushing graphene strain engineering beyond the limits of continuum mechanics.14
Numerical simulations offer the possibility of explaining the role of substrate geometry and interactions for graphene deposited over trenches or holes, but simulations to date have typically treated the effect of the substrate adhesion as an applied tension or clamping of the sheet edges.15−21 Where the substrate is treated explicitly, adhesion has been induced “artificially” by, e.g., folding the sheet so that it is constrained to be in contact with a large area of the sidewalls.22,23
Here, we report simulations of graphene suspended over a trench and explore how adhesion to the sidewalls depends on interactions with the substrate, temperature, and, importantly, substrate geometry in the form of a finite radius of curvature of the trench edges. We find that adhesion is strongly promoted by trench edge curvature so that even sheets deposited flat adhere to the sidewalls and are thereby tensioned. Over the range of parameters we study, the depth at the center of the sheet is approximately linear in substrate interaction strength and temperature, and we explain this using a one-dimensional model for the sheet configuration.
We use the molecular dynamics package LAMMPS24 to simulate a rectangular sheet of 43 × 15 nm2, or ∼24,000 atoms, which interact with each other via an AIREBO potential.25 The sheet is placed flat on a substrate that consists of a trench of width 15 nm and infinite depth. The sheet and substrate interact via a Lennard-Jones interaction directed radially from the substrate surface, with strength ϵ = 0.04, 0.1, 0.2 eV and σ = 1 Å, values in the range of interactions between graphene and SiO2 substrates.26 To capture friction effects that prevent the sheet from sliding indefinitely, its short ends are coupled horizontally to their initial position by a harmonic coupling with spring constant k = 0.0001 eV/Å. It was shown previously27 that this is an adequate approximation for friction with a rough substrate. Open boundary conditions are used. The substrate is frozen, which increases computational efficiency and allows us to simulate a larger graphene sheet than would otherwise be possible.
The rims of the trench are rounded slightly, for three reasons. First, in general a trench etched in a substrate is not expected to be atomically sharp. Second, the curvature ensures the interaction between sheet and substrate varies smoothly and can be calculated accurately.28 Third, as we show below, the configuration of the sheet depends strongly on the radius of curvature of the trench edges. In general and unless otherwise stated, the radius of curvature is r = 1 nm.
The sheet is first relaxed from flat at T = 0 using LAMMPS’ built-in energy minimization routine. Finite-T simulations are performed by slowly ramping up the temperature from a starting point of the T = 0 configuration using a Berendsen thermostat. After the temperature T has been reached we use a Langevin thermostat with damping τ = 1 ps to keep the system in a steady state while we measure average quantities. We have also tested a reversed temperature protocol in which the sheet is relaxed at T = 300 K and lowered onto the substrate, before lowering the temperature gradually to T = 0 and find similar outcomes in terms of sheet configurations and stresses, as discussed in the Supporting Information. This indicates the robustness of our results presented here.
Figure 1a shows typical configurations of a sheet with adhesion characterized by ϵ = 0.04 eV. At T = 0, the sheet is smooth apart from rippling at its long edges, and is adhered to the trench edges, with a depth of ∼8 Å attained at the sheet center. For context, this is equivalent to ∼5% of the pit width. The edge rippling is consistent with that seen in previous simulations and experiments on graphene ribbons.29,30 Along the short axis, at T = 0 the sheet develops a low-amplitude ripple of wavelength ∼15 nm, as shown in Figure S1. This is consistent with continuum mechanics,31 which predicts wavelengths of order 10–20 nm for strains of order 0.1–1%. An example of deposition at T = 0 is shown as a video in the Supporting Information.
Figure 1.

(a) Sample configurations of the sheet for adhesion characterized by ϵ = 0.04 eV. As temperature increases, the sheet roughens and detaches from the trench sides. (b) For stronger adhesion ϵ, the sheet reaches lower depths at T = 0 and detaches more slowly as temperature is increased. (c) The scaling of the change in depth with temperature is approximately linear in ϵ. For comparison, the predictions of the 1d model with ϵ = 0.04 eV are also shown. (d) Standard deviation of the temporal fluctuations in the depth of the center of the sheet, plotted against temperature. (e) For large kBT/ϵ, distributions of the depth of the center of the sheet can be collapsed by rescaling by kBT/ϵ.
The primary effect we wish to study is the reduction in adhesion with temperature. As T increases, the sheet becomes rougher and attachment to the trench sides is reduced. The effect of this on the time-averaged depth h of the sheet center is quantified in Figure 1b. The depth varies smoothly with temperature and no signs of a detachment phase transition are observed, with h(T) approximately linear over a wide range of T. Similar results are seen for the alternative cooling temperature protocol, although h(T) deviates more pronouncedly from linearity, as seen in Figure S2.
In addition, the slope of h(T) decreases as the adhesion parameter ϵ increases, that is, for strong adhesion the effect of temperature on detachment is reduced. Indeed, for ϵ = 0.2 the change in depth over a 2000 K temperature range is ∼0.5 Å. To first approximation, the slope of h(T) is linear in ϵ, as indicated in Figure 1c where kBT has been rescaled by ϵ.
Temporal fluctuations of the sheet configuration are also increased with temperature. Typical examples are shown as videos in the Supporting Information. Figure 1d quantifies this effect through the standard deviation of the time series of the depth of the sheet center. For large temperatures, the scale of fluctuations grows linearly with T, with faster growth for systems with smaller adhesion ϵ. For the range of temperatures we study, the largest fluctuations observed are on the scale of 1–2 Å, which is ∼20% of the mean depth of the sheet center. In fact, for high temperatures, these observations can be consolidated by rescaling the distribution of sheet depths by kBT/ϵ, in which case the data collapse, as shown in Figure 1e.
This roughness and the observed fluctuations, in addition to adhesion to the trench edges, give rise to stresses, which can be calculated using the standard virial stress formula and a per-atom volume of 15.72 Å3 for a hexagonal lattice with interatom distance 1.42 Å and sheet thickness 3 Å. We characterize these stresses in Figure 2a by the stress along the long axis σxx, time-averaged in the steady state in a strip of width 10 nm in the center of the sheet. The stress is tensile everywhere except the trench and sheet edges where it is compressive. As temperature increases and the sheet becomes rougher, the spatial distribution of σxx reflects this, becoming less uniform, and larger tensile stresses are seen.
Figure 2.

Tensile stresses in the sheet increase with temperature. (a) Spatial distribution of the normal stress σxx, where x is the sheet long axis, shows that it is tensile everywhere except at the trench edges where it is compressive. Temperature-induced fluctuations increase the magnitude of the stress and are quantified here for (b) σxx and (c) the trace of the stress tensor, which have been averaged over the steady state fluctuations of a strip of width 10 nm in the center of the sheet. The colorbar has been clipped to the range [−2.5,2.5] GPa to make details within the sheets clearer. In fact the stresses along the sheet edges are compressive, with amplitude ∼5 GPa.
σxx is the most important contribution to Tr(σ), as can be seen by comparing the spatiotemporal averages of the two in Figure 2b,c. At T = 0, the other normal stresses are approximately zero, with a nonzero ⟨σxx⟩ due to stretching of the sheet as it conforms to the trench walls. Indeed, ⟨σxx(T = 0)⟩ is approximately linear in ϵ. At low temperatures, stresses are on the order of giga-Pascals, consistent with experimental observations.10,11 At larger T the ϵ dependence of ⟨σ⟩ becomes more complex. Large ϵ promotes adhesion of the sheet to the trench walls and therefore stretching; however, for smaller ϵ the sheet can fluctuate substantially as seen in Figure 1d,e, and these fluctuations also cause stresses in the sheet. Similar results are seen for the cooling temperature protocol, as seen in Figure S3.
Our simulations reveal behavior that is approximately linear in kBT/ϵ over a range of temperatures and adhesion strengths. This suggests the underlying physics can be captured by a relatively simple model, as we demonstrate below. The essential idea behind our model is that at finite temperature, the effective length of the graphene sheet is reduced from its T = 0 value, due to thermal fluctuations in the local orientation of the sheet. The change in depth of the center of the sheet with temperature is then purely a geometrical effect.
We treat the sheet as a 1d chain pinned at the edges of the trench. At T = 0, the chain will take a configuration that minimizes its energy E, the sum of stretching, bending, and adhesion energies. For simplicity, we assume the conformation of the chain is as depicted in Figure 3a, that is, it conforms to the circular substrate edge over some angle θ, and the detached part of the chain forms a circular arc, with tangents matching where the two arcs join. While the assumption of a circular arc for the detached sheet is a simplification, for a suspended sheet such as we study the arc of the detached part is shallow and we do not expect a more realistic shape to have a substantially different center depth.
Figure 3.

One-dimensional model of the partially adhered sheet. (a) In the
model, the sheet adheres to the substrate following an arc defined
by the angle θ; the two adhered sections are joined by a second
arc whose radius of curvature is determined by matching the tangent
vectors where the attached and detached parts meet. (b) Depth h of the sheet center at T = 0, given by
minimizing the energy (eq 2). (c) Change in depth with temperature, for the adhesion strengths
ϵ studied in our simulations. (d) Increasing the radius of curvature
of the trench edge, r, promotes adhesion to the substrate.
At T = 0, the 1d model has a sharp transition at  ; in our simulations of a 2d sheet the transition
is smoothed.
; in our simulations of a 2d sheet the transition
is smoothed.
The attached arc has a radius of curvature r and the detached arc has radius of curvature R, which is constrained by
| 1 |
where l is the trench half-width. The configuration is therefore fully characterized by the angle θ, with respect to which we minimize E.
Because of symmetry we calculate the energy of half the sheet
 |
2 |
where the first term on the RHS is the stretching energy, the second is bending energy, and the last is adhesion energy. Y = Y0w/L is an effective spring constant. Y0 = 350 N/m is the 2D in-plane stiffness of graphene,32w = 15 nm is the sheet width, and L is its rest length, which at T = 0 is l. B = B0w is the effective bending constant for our sheet with bending rigidity B0 = 1 eV. γ = ρwϵ is an effective adhesion constant, where ρ is the area density of atoms that each contribute ϵ to the energy when the sheet is adhered.
We minimize the energy numerically using the brentq function in the SciPy Optimize package. The depth h is related to θ by
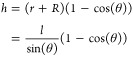 |
3 |
As shown in Figure 3b, while the absolute depth attained by the chain is less than observed in our simulations, the order of magnitude is correct as is the change in depth with ϵ. This is a nontrivial point. For example, if we neglect bending costs and treat the detached chain as a flat segment connecting two adhered segments on vertical walls, then the depth h that minimizes the energy is h = γ/(4Y), which in our sheet and trench geometry is 0.4 Å for ϵ = 0.1 eV.
At finite temperature, the effective length of the chain is reduced due to fluctuations. We model the effect of these fluctuations by using the worm-like chain model to treat the system as a semiflexible polymer with an energy cost for bending and temperature-induced tendency to fluctuate. For a worm-like chain subject to an aligning force f, the end-to-end extension L is well approximated by33
| 4 |
where P = B/kbT is the persistence length of the chain and L0 is its contour length at T = 0. The force f arises from interactions with the substrate and we take its magnitude from the measured stress σxx in the sheet at T = 0, using a cross-section area A = wt = 4.5 nm2. The effective length L calculated from (eq 4) is then used as the rest length in the energy (eq 2), and the new depth is calculated. As shown in Figure 3c, for the ϵ values we study via simulation, the scaling of the change in depth with temperature is approximately linear in ϵ. In addition, as Figure 1c demonstrates, the agreement with simulations is excellent.
At T = 0, the model predicts a transition in the
adhesion behavior of the sheet at a critical trench edge radius of
curvature rc, below which
no θ ≥ 0 exists that minimizes the energy (eq 2), due to the bending cost of conformation
overtaking the corresponding adhesion energy gain. Taking the derivative
of eq 2 at θ =
0 gives  . Simulations performed with edge radii
of curvature around rc show that this
transition is smoothed in the 2d sheet, as shown in Figure 3d. However, in both cases it
is apparent that a suitable choice of r is required
to see substantial adhesion of the sheet to the trench and for sharp
edges the sheet remains almost flat. Furthermore, as discussed in
the Supporting Information, similar results
are seen for a sheet that is thermalized at 300 K before deposition,
indicating that rounding of the trench edges is more important here
than slack introduced by wrinkling in the sheet.
. Simulations performed with edge radii
of curvature around rc show that this
transition is smoothed in the 2d sheet, as shown in Figure 3d. However, in both cases it
is apparent that a suitable choice of r is required
to see substantial adhesion of the sheet to the trench and for sharp
edges the sheet remains almost flat. Furthermore, as discussed in
the Supporting Information, similar results
are seen for a sheet that is thermalized at 300 K before deposition,
indicating that rounding of the trench edges is more important here
than slack introduced by wrinkling in the sheet.
An advantage of our 1d model is that it can be used to study system sizes inaccessible to molecular dynamics. Importantly, the 1d model reveals that, while the system behaves approximately linearly in ϵ/kT, it is nonlinear in r and l. For example, we have tested how the depth h of the sheet center varies as the trench width l and sheet length L are simultaneously increased at T = 0, for a sheet with width w = 1.93 μm (based on the system studied experimentally by Bunch et al.5). We find the depth grows sublinearly with L and the sheet attains depths of h ≈ 10 nm for micron-scale trenches with r = 1 nm. This is important for applying our results to large systems for two reasons. First, it indicates that the effect of the finite radius of curvature r is applicable for all system sizes, and second, the order of magnitude of h agrees with reports in the literature of 2–15 nm for graphene over square and round holes.10,11 We also study the effect of varying the radius of curvature r. For a trench of width 1.1 μm and sheet width 1.93 μm, dimensions matching the system studied experimentally by Bunch et al.,5 the calculated resonance frequency of the sheet in the 1d model is 10–120 MHz for r between 0.5 and 1 nm (as shown in Figure S5), values also in agreement with the observations of Bunch et al., who report a resonance frequency of 70.5 MHz.5
In conclusion, we have shown that adhesion of a graphene sheet to trench sidewalls can be induced by curvature of the trench edges, even when the sheet is deposited flat. This adhesion is sufficient to generate tension in the graphene sheet consistent with experimental measurements.
Acknowledgments
We thank Paul McEuen for helpful and informative discussions. Z.B. thanks Alessandro Sellerio for assistance with LAMMPS. This work is supported by the European Research Council through the Advanced Grant 2011 SIZEFFECTS.
Supporting Information Available
The Supporting Information is available free of charge on the ACS Publications website at DOI: 10.1021/acs.nanolett.5b03958.
Cross-section of a sheet deposited at T = 0, details of an alternative temperature protocol, and effect of trench width in the 1d model (PDF)
Initial relaxation of a sheet deposited at T = 0 (AVI)
Steady state fluctuations at T = 200 K (AVI)
Steady state fluctuations at T = 1000 K (AVI)
Deposition and cooling of a sheet initially at 300 K, with the temperature ramped down to 0 (AVI)
The authors declare no competing financial interest.
Supplementary Material
References
- Craighead H. G. Science 2000, 290, 1532–1535. 10.1126/science.290.5496.1532. [DOI] [PubMed] [Google Scholar]
- Ekinci K. L.; Roukes M. L. Rev. Sci. Instrum. 2005, 76, 061101. 10.1063/1.1927327. [DOI] [Google Scholar]
- Novoselov K. S.; Geim A. K.; Morozov S. V.; Jiang D.; Zhang Y.; Dubonos S. V.; Grigorieva I. V.; Firsov A. A. Science 2004, 306, 666–669. 10.1126/science.1102896. [DOI] [PubMed] [Google Scholar]
- Novoselov K. S.; Falko V. I.; Colombo L.; Gellert P. R.; Schwab M. G.; Kim K. Nature 2012, 490, 192–200. 10.1038/nature11458. [DOI] [PubMed] [Google Scholar]
- Bunch J. S.; van der Zande A. M.; Verbridge S. S.; Frank I. W.; Tanenbaum D. M.; Parpia J. M.; Craighead H. G.; McEuen P. L. Science 2007, 315, 490–493. 10.1126/science.1136836. [DOI] [PubMed] [Google Scholar]
- Garcia-Sanchez D.; van der Zande A. M.; Paulo A. S.; Lassagne B.; McEuen P. L.; Bachtold A. Nano Lett. 2008, 8, 1399–1403. 10.1021/nl080201h. [DOI] [PubMed] [Google Scholar]
- van der Zande A. M.; Barton R. A.; Alden J. S.; Ruiz-Vargas C. S.; Whitney W. S.; Pham P. H. Q.; Park J.; Parpia J. M.; Craighead H. G.; McEuen P. L. Nano Lett. 2010, 10, 4869–4873. 10.1021/nl102713c. [DOI] [PubMed] [Google Scholar]
- Barton R. A.; Ilic B.; van der Zande A. M.; Whitney W. S.; McEuen P. L.; Parpia J. M.; Craighead H. G. Nano Lett. 2011, 11, 1232–1236. 10.1021/nl1042227. [DOI] [PubMed] [Google Scholar]
- Miao T.; Yeom S.; Wang P.; Standley B.; Bockrath M. Nano Lett. 2014, 14, 2982–2987. 10.1021/nl403936a. [DOI] [PubMed] [Google Scholar]
- Bunch J. S.; Verbridge S. S.; Alden J. S.; van der Zande A. M.; Parpia J. M.; Craighead H. G.; McEuen P. L. Nano Lett. 2008, 8, 2458–2462. 10.1021/nl801457b. [DOI] [PubMed] [Google Scholar]
- Lee C.; Wei X.; Kysar J. W.; Hone J. Science 2008, 321, 385–388. 10.1126/science.1157996. [DOI] [PubMed] [Google Scholar]
- Suk J. W.; Kitt A.; Magnuson C. W.; Hao Y.; Ahmed S.; An J.; Swan A. K.; Goldberg B. B.; Ruoff R. S. ACS Nano 2011, 5, 6916–6924. 10.1021/nn201207c. [DOI] [PubMed] [Google Scholar]
- Bunch J. S.; Dunn M. L. Solid State Commun. 2012, 152, 1359–1364. 10.1016/j.ssc.2012.04.029. [DOI] [Google Scholar]
- Tapasztó L.; Dumitrică T.; Kim S. J.; Nemes-Incze P.; Hwang C.; Biró L. P. Nat. Phys. 2012, 8, 739–742. 10.1038/nphys2389. [DOI] [Google Scholar]
- He X. Q.; Kitipornchai S.; Liew K. M. Nanotechnology 2005, 16, 2086. 10.1088/0957-4484/16/10/018. [DOI] [PubMed] [Google Scholar]
- Atalaya J.; Isacsson A.; Kinaret J. M. Nano Lett. 2008, 8, 4196–4200. 10.1021/nl801733d. [DOI] [PubMed] [Google Scholar]
- Kim S. Y.; Park H. S. Nano Lett. 2009, 9, 969–974. 10.1021/nl802853e. [DOI] [PubMed] [Google Scholar]
- Sadeghi M.; Naghdabadi R. Nanotechnology 2010, 21, 105705. 10.1088/0957-4484/21/10/105705. [DOI] [PubMed] [Google Scholar]
- Wong C.-L.; Annamalai M.; Wang Z.-Q.; Palaniapan M. J. Micromech. Microeng. 2010, 20, 115029. 10.1088/0960-1317/20/11/115029. [DOI] [Google Scholar]
- Wang Z.; Devel M. Phys. Rev. B: Condens. Matter Mater. Phys. 2011, 83, 125422. 10.1103/PhysRevB.83.125422. [DOI] [Google Scholar]
- Kang J. W.; Kim H.-W.; Kim K.-S.; Lee J. H. Curr. Appl. Phys. 2013, 13, 789–794. 10.1016/j.cap.2012.12.007. [DOI] [Google Scholar]
- Lu Z.; Dunn M. L. J. Appl. Phys. 2010, 107, 044301. 10.1063/1.3270425. [DOI] [Google Scholar]
- Zhou L.; Wang Y.; Cao G. J. Phys.: Condens. Matter 2013, 25, 475303. 10.1088/0953-8984/25/47/475303. [DOI] [PubMed] [Google Scholar]
- Plimpton S. J. Comput. Phys. 1995, 117, 1–19. 10.1006/jcph.1995.1039. [DOI] [Google Scholar]
- Stuart S. J.; Tutein A. B.; Harrison J. A. J. Chem. Phys. 2000, 112, 6472–6486. 10.1063/1.481208. [DOI] [Google Scholar]
- Yamamoto M.; Pierre-Louis O.; Huang J.; Fuhrer M. S.; Einstein T. L.; Cullen W. G. Phys. Rev. X 2012, 2, 041018. 10.1103/PhysRevX.2.041018. [DOI] [Google Scholar]
- Budrikis Z.; Sellerio A. L.; Bertalan Z.; Zapperi S. Sci. Rep. 2015, 5, 8938. 10.1038/srep08938. [DOI] [PMC free article] [PubMed] [Google Scholar]
- Fix wall/region command. http://lammps.sandia.gov/doc/fix_wall_region.html (accessed 2015-06-17).
- Shenoy V. B.; Reddy C. D.; Ramasubramaniam A.; Zhang Y. W. Phys. Rev. Lett. 2008, 101, 245501. 10.1103/PhysRevLett.101.245501. [DOI] [PubMed] [Google Scholar]
- Wang H.; Upmanyu M. Phys. Rev. B: Condens. Matter Mater. Phys. 2012, 86, 205411. 10.1103/PhysRevB.86.205411. [DOI] [Google Scholar]
- Cerda E.; Mahadevan L. Phys. Rev. Lett. 2003, 90, 074302. 10.1103/PhysRevLett.90.074302. [DOI] [PubMed] [Google Scholar]
- Lambin P. Appl. Sci. 2014, 4, 282. 10.3390/app4020282. [DOI] [Google Scholar]
- Marko J. F.; Siggia E. D. Macromolecules 1995, 28, 8759–8770. 10.1021/ma00130a008. [DOI] [Google Scholar]
Associated Data
This section collects any data citations, data availability statements, or supplementary materials included in this article.