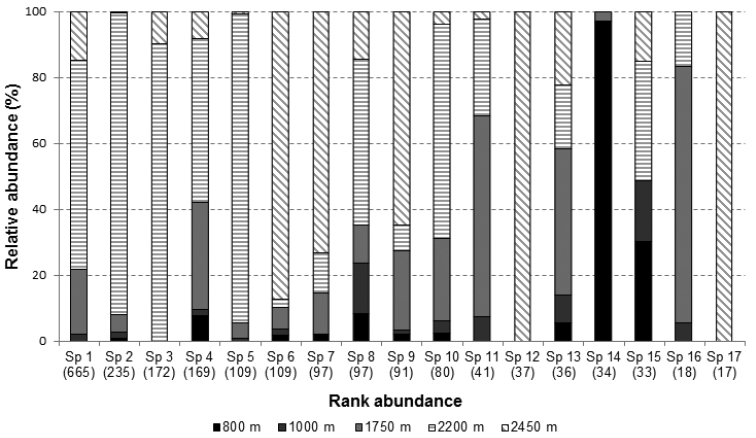
Figure 4.
Relative abundance per elevation of the 17 Galerucinae species with more than 10 individuals sampled in the entire study period. Species are arranged from the most (left) to the less (right) abundant one. Number of individuals of each species are within brackets. Texture represents the high fields and color lowest elevations.

