Abstract
Background:
While there is literature suggesting that the palatal rugae could be used for human identification, most of these studies use two-dimensional (2D) approach.
Aim:
The aims of this study were to evaluate palatal ruga patterns using three-dimensional (3D) digital models; compare the most clinically relevant digital model conversion techniques for identification of the palatal rugae; develop a protocol for overlay registration; determine changes in palatal ruga individual patterns through time; and investigate the efficiency and accuracy of 3D matching processes between different individuals’ patterns.
Material and Methods:
Five cross sections in the anteroposterior dimension and four cross sections in the transverse dimension were computed which generated 18 2D variables. In addition, 13 3D variables were defined: The posterior point of incisive papilla (IP), and the most medial and lateral end points of the palatal rugae (R1MR, R1ML, R1LR, R1LL, R2MR, R2ML, R2LR, R2LL, R3MR, R3ML, R3LR, and R3LL). The deviation magnitude for each variable was statistically analyzed in this study. Five different data sets with the same 31 landmarks were evaluated in this study.
Results:
The results demonstrated that 2D images and linear measurements in the anteroposterior and transverse dimensions were not sufficient for comparing different digital model conversion techniques using the palatal rugae. 3D digital models proved to be a highly effective tool in evaluating different palatal ruga patterns. The 3D landmarks showed no statistically significant mean differences over time or as a result of orthodontic treatment. No statistically significant mean differences were found between different digital model conversion techniques, that is, between OrthoCAD™ and Ortho Insight 3D™, and between Ortho Insight 3D™ and the iTero® scans, when using 12 3D palatal rugae landmarks for comparison.
Conclusion:
Although 12 palatal 3D landmarks could be used for human identification, certain landmarks were especially important in the matching process and were arranged by strength and importance. Proposed values for 3D palatal landmarks were introduced that could be useful in biometrics and forensic odontology for the verification of human identity.
Keywords: 3D analysis, digital models, forensic odontology, forensic science, human identification, human verification, palatal rugae
Introduction
Palatal rugae, also known as the plicae palatinae, transversae and the rugae palatinae, are situated in the anterior third of the hard mucosal palate in the roof of the mouth. The rugae are anatomical grooves, folds, or wrinkles with irregular, asymmetric ridges extending laterally from the incisive papilla (IP) and the anterior part of the median palatal raphe. Their number, shape, length, width, prominence, and orientation vary on each side of the midline and among different individuals. The palatal rugae never cross the midline and are numbered separately from anterior to posterior on each side of the palate. Palatoscopy or palate rugoscopy is the name given to the study of palatal rugae in order to establish a person's identity.[1,2,3,4,5]
The literature shows that palatal rugae are unique and permanent for each person and can be used for human identification.[6,7] However, current classification systems and quantification measurements are largely based on two-dimensional (2D) approaches.[8,9,10] To date, there have been no studies using three-dimensional (3D) technology for the evaluation and quantification of the palatal ruga patterns, comparison of different digital model conversion techniques, and assessment of the matching process between different individuals.
Concerns have been raised about the possibility of changes in palatal ruga patterns as a result of growth, orthodontic treatment, palatal expansion, and extractions of adjacent teeth.[11,12,13,14,15,16] Different studies found that the medial and lateral points of the third ruga were stable landmarks in both extraction and nonextraction orthodontic cases and thus are useful as anatomic reference points in dental cast analysis; palatal rugae maintained the same pattern pre and post rapid palatal expansion, presenting no morphological changes.[13,14] The results of another study showed that lateral ruga points were less stable, particularly with headgear orthodontic treatment. Medial ruga points, especially of the first rugae, were suggested as stable reference landmarks for longitudinal cast analysis in the transverse and anteroposterior planes.[15] In contrast, other studies suggested that only the medial points of the third palatal rugae are stable enough to be used as landmarks for the superimposition of maxillary dental casts. The largest displacement observed was for the lateral points of the first palatal rugae, followed by the second rugae.[16]
Plaster study models have a long and proven history as a routine dental technique and an essential aid in orthodontic diagnosis and treatment planning. Digital models offer a highly accurate, valid, and clinically useful alternative to traditional plaster models.[17,18,19,20,21] Today, with evolving technology, intraoral mapping is one of the most exciting areas in dentistry, with new scanners entering clinical practice continuously all over the world. 3D scanning of the mouth is performed in a large number of procedures in general dentistry, prosthodontics, and orthodontics for the design and manufacture of a large range of appliances, such as dentures, crowns, and orthodontic devices (e.g. brackets, arch wires, expanders, aligners, retainers).[22,23]
The objectives of this study were the following: (1) To compare the most clinically relevant digital model conversion techniques for the accurate identification of palatal ruga patterns; (2) to establish a method of overlay registration of palatal ruga patterns using previously described landmarks as compared to a 3D best fit technology; (3) to determine changes in palatal ruga individual patterns through time; and (4) to test the efficiency of 3D matching processes between different individuals’ palatal ruga patterns as an aid to forensics.
Materials and Methods
Study design
In this Institutional Review Board (IRB)-approved study by the University of Illinois at Chicago (UIC), 3D data were obtained from 15 subjects from the university orthodontic clinic and 15 subjects from three private orthodontic practices [Figure 1]. Gender and ethnicity were not recorded. The general inclusion criteria were 1) availability of initial and follow-up maxillary dental casts and 2) no visible model fracture or distortion of the palatal area.
Figure 1.
Conceptual framework. 45 digital maxillary models from 15 patients treated at a university orthodontic clinic and 24 digital maxillary models from 15 private practice patients were used in this study
Forty-five digital maxillary models of 15 adolescents (age 12-18) who had completed orthodontic treatment at the UIC orthodontic clinic were selected at two time points, roughly 20-24 months apart: Prior to orthodontic treatment and during orthodontic treatment [Figure 1]. The inclusion criteria were 1) age 12-18 at the start of orthodontic treatment, 2) initial maxillary plaster model, 3) initial maxillary OrthoCAD™ (Align Technology, Inc., San Jose, CA, USA) digital model, 4) a 20-month minimum follow-up maxillary plaster model, and (5) no visible fracture or distortion of the palatal area on all models. The initial maxillary plaster and OrthoCAD™ models were obtained by taking two alginate impressions (Kromopan 100, Kromopan USA, Des Plaines, IL, USA) on the same day at the initial time point. The first impression for each patient was mailed to OrthoCAD™ for digital conversion and electronically returned in digital format for analysis [Figure 2]. Each second impression was poured within 24 h and a trimmed plaster model was obtained. The follow-up 20-month minimum plaster models were obtained by taking an alginate impression at that time point and pouring plaster into them within 24 h. The initial and the follow-up plaster models were scanned with Ortho Insight 3D™ laser scanner (Motion View Software, LLC, Chattanooga, TN, USA) [Figure 3].
Figure 2.
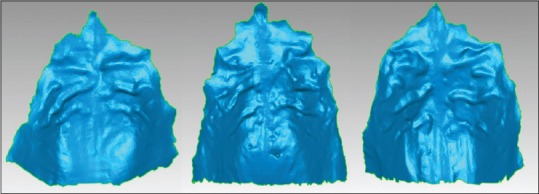
Example of scans of alginate impressions by OrthoCAD™ of different palates
Figure 3.

Example of Ortho Insight 3D™ plaster models scans of different palates
Twenty-four digital maxillary models with iTero® Intra Oral Digital Scanner (Align Technology, Inc., San Jose, CA, USA) of 15 adolescents (age 12-18) were obtained from three private orthodontic practices [Figures 1 and 4]. The inclusion criteria were 1) age 12-18 at the start of orthodontic treatment, 2) initial maxillary iTero® intraoral scan, 3) a 20-month minimum follow-up maxillary iTero® intraoral scan, and 4) the entire palatal area included in both scans. Nine of the subjects had scans at two time points roughly 20-24 months apart, prior to orthodontic treatment and during orthodontic treatment performed without extraction of teeth. Six of the subjects had only an initial iTero® intraoral scan and no follow-up scan.
Figure 4.

Example of iTero® intraoral scans of different palates
Digital Shape Scanning and Processing (DSSP), model analysis, selection of the palatal rugae region, 3D superimposition, and measurements were done using Geomagic® Control™ 14 (Geomagic®, Research Triangle Park, NC, USA). All digital scans were converted into a stereolithography binary file format (*.stl), supported by the Geomagic® Software.
Study groups
Five study groups were created [Figure 5]: Group A: Scans of alginate impressions by OrthoCAD™ were compared with Ortho Insight 3D™ scans of plaster models prior to orthodontic treatment; Group B: Ortho Insight 3D™ plaster model scans were compared prior to and during orthodontic treatment; Group C: iTero® intraoral scans were compared prior to and during orthodontic treatment; Group D: One subject's Ortho Insight 3D™ plaster model scan was compared with 15 different subjects’ Ortho Insight 3D plaster model scans; Group E: One subject's iTero® intraoral scan was compared with 15 different subjects’ iTero® intraoral scans.
Figure 5.
Study groups. Each of the five groups was comprised of 15 subjects except for Group C which had 9 subjects
Model reconstruction, alignment, and 3D compare
For each individual in the five study groups, a different set of two digital impressions was imported in Geomagic® Control™ 14 (e.g. for group A: One initial scan of an alginate impression by OrthoCAD™ was imported along with the corresponding initial plaster model scan with Ortho Insight 3D™; for Group B: One initial scan and one follow-up scan of a plaster model with Ortho Insight 3D™ were imported, etc.). Processing and analysis of the 3D models were done in sets of two.
First, the palatal rugae area of each digital model was selected and a separate object was created that consisted only of that area. The posterior limit of the extracted region ranged 2-15 mm from the most distal lateral end point of the third palatal rugae. Subsequently, both scanned palates were registered by manual alignment. The following 13 points were selected on both digital models: The posterior point of the IP and the most medial and lateral end points of the palatal rugae (R1MR, R1ML, R1LR, R1LL, R2MR, R2ML, R2LR, R2LL, R3MR, R3ML, R3LR, and R3LL) [Figure 6]. Each of the two objects was positioned, rotated, or scaled to face the same direction in order for the same point selection to be achieved. Global registration followed the manual alignment for refinement of the position of the two scans by fine-tuned automatic adjustments. Only the palatal surface was used for registration, so any changes in tooth position did not affect the overall superimposition. 3D Compare analysis was performed, which generated a 3D color-coded map.
Figure 6.
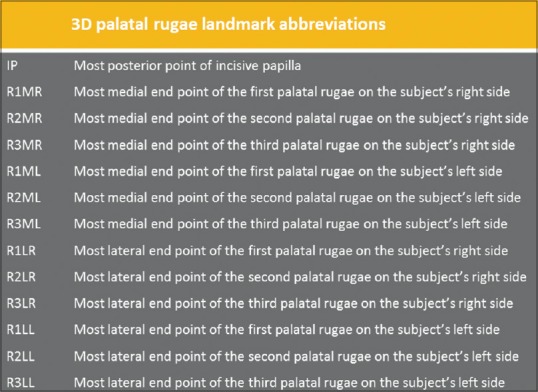
3D palatal rugae landmark abbreviations
2D and 3D variables
2D cross-sections were generated to illustrate graphically the deviations (dev) between the two digital palates. Five cross-sections in the anteroposterior dimension (at the midline, at 6 mm on each side of the midline, and at the lateral end points of all palatal rugae bilaterally) and four cross-sections in the transverse dimension (at the posterior point of the IP, at the medial end points of the first and third palatal rugae, and at 5 mm posterior to the medial end points of the third palatal ruga) were computed [Figure 7]. The upper and lower deviations Dx, Dy, Dz, and the upper and lower deviation magnitudes were automatically calculated by the software for each of the nine cross-sections [Figure 8a and b].
Figure 7.
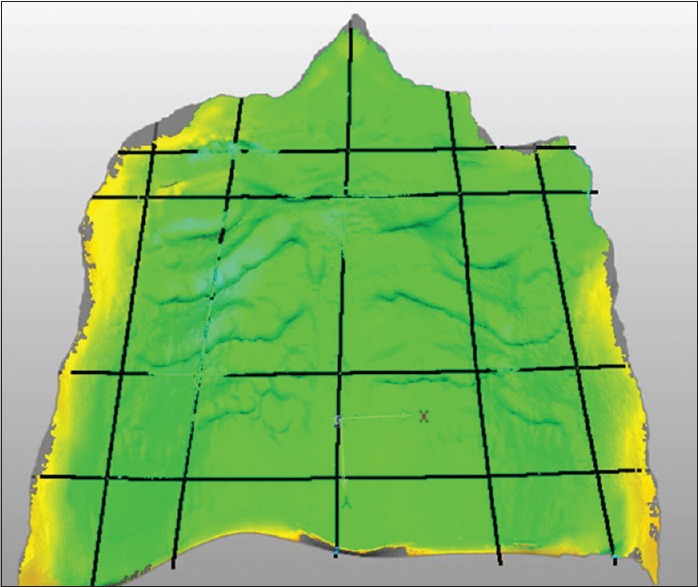
Example of a 3D image with the cross-sections in anteroposterior and transverse dimensions
Figure 8.
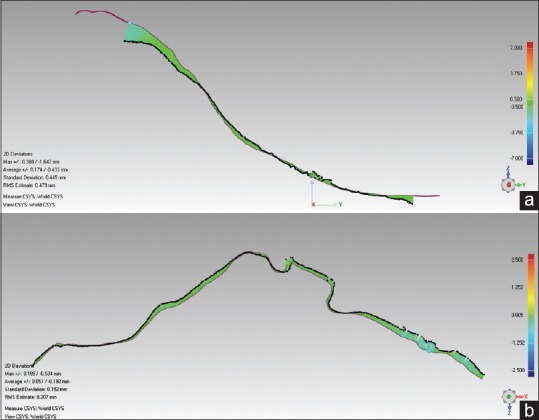
(a) Example of the 2D comparison results, a cross-section in the anteroposterior dimension, at the midline of the two digital models (b) Example of the 2D comparison results, a cross-section in the transverse dimension, at the medial ends of the third palatal rugae of the two digital models
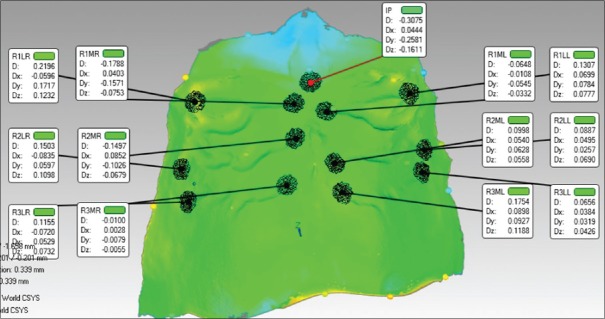
Thirteen 3D variables were defined that highlighted the deviations at the XYZ position of the two digital models. The following target points were identified in order to create the annotations: The posterior point of IP, and the most medial and lateral end points of the palatal rugae (R1MR, R1ML, R1LR, R1LL, R2MR, R2ML, R2LR, R2LL, R3MR, R3ML, R3LR, and R3LL). When the number of lateral ruga points was more than three on each side of the midline due to present bifurcations, the most anterior lateral end points of the first and second palatal rugae and the most posterior lateral end points of the third palatal ruga were selected. The deviations Dx, Dy, Dz, and the deviation magnitudes were automatically measured for each of the 13 variables, which showed the difference between the two digital impressions within 1 mm radius in the corresponding XYZ position [Figure 9].
Figure 9.
Example of the 3D comparison results, the annotation view with selected medial and lateral points of the palatal rugae
The same target points were selected and the same functions were applied for each of the five study groups. Only the magnitudes of deviation data were analyzed statistically in this study.
Statistical analysis
Five different data sets with the same 31 variables were created for each of the five study groups. Descriptive and comparative statistics were performed using SPSS 20.0 (Chicago, IL, USA). One sample t-tests were used to evaluate mean discrepancies for all 31 variables in each of the five study groups. Independent sample t-tests were performed to assess the statistical significance between the values for the Ortho Insight 3D™ plaster model scans and the iTero® intraoral scans at the initial and followup time points (groups B and C). A P value of less than 0.05 was used as a criterion for statistical significance.
Results
Comparison between different digital model conversion techniques
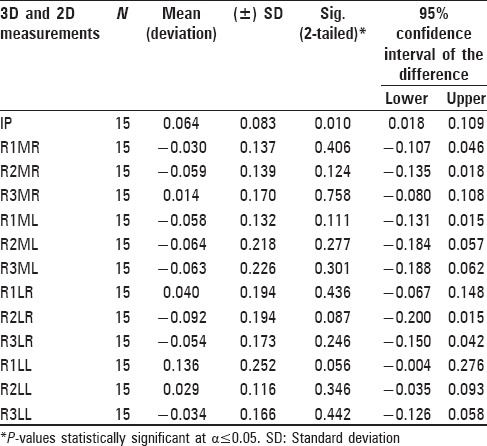
A one-sample t-test was performed to compare the mean magnitude of deviation for each of the 31 variables between the scans of the alginate impressions by OrthoCAD™ and the Ortho Insight 3D™ plaster model scans at the initial time point. Fifteen subjects were evaluated in this study group. All 18 2D variables in the study showed statistically significant mean differences with P-values ranging 0.000-0.001 [Table 1]. Twelve out of the 13 3D landmarks in the study, created from target point selections on superimposed scans of alginate impressions by OrthoCAD™ and the Ortho Insight 3D™ plaster model scans, showed no a statistically significant mean differences, P > 0.05. An exception was the posterior point of IP, which showed statistically significant mean difference with P = 0.010.
Table 1.
One-sample t-test results from the deviation magnitudes comparison of two different digital model conversion techniques
Comparison of the same digital model conversion technique at two time periods
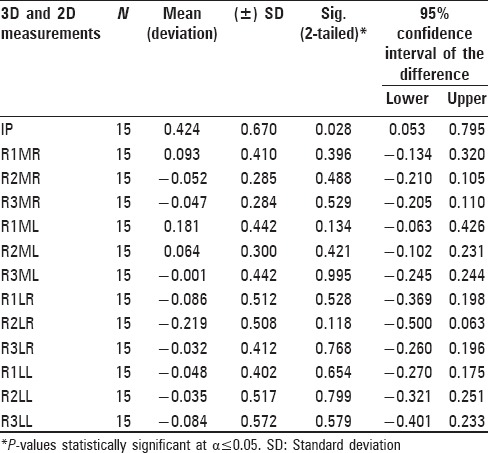
A one-sample t-test was performed to assess the mean magnitude of deviation for each of the 31 variables of the Ortho Insight 3D™ plaster model scans compared at two time periods, 20-24 months apart: Prior to and during orthodontic treatment. Fifteen subjects were evaluated in this study group. Five individuals had teeth extracted for orthodontic treatment. All 18 2D variables in the study showed statistically significant mean differences, with P-values ranging 0.000-0.001 [Table 2]. Twelve out of the 13 3D landmarks in the study, created from target point selections on superimposed scans of Ortho Insight 3D™ plaster models in two time periods, showed no statistically significant mean differences, P > 0.05. An exception was the posterior point of IP, which showed statistically significant mean difference with P = 0.028.
Table 2.
One-sample t-test results of the deviation magnitudes comparison of the Ortho Insight 3D. digital model conversion technique between two time periods
Comparison of iTero® intraoral scans at the two time periods
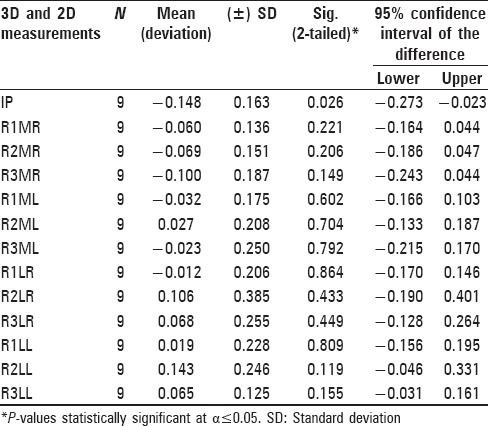
A one-sample t-test was performed to assess the mean magnitude of deviation for each of the 31 variables of the iTero® intraoral scans compared at two time periods, 20-24 months apart: Prior to and during conventional fixed nonextraction orthodontic treatment. Nine subjects were evaluated in this study group. All 18 2D variables in the study showed statistically significant mean differences with P-values ranging 0.000-0.011 [Table 3]. Twelve out of the 13 3D landmarks in the study, created from target point selections on superimposed iTero® intraoral scans in two time periods, had no statistically significant mean differences, P > 0.05. An exception was the posterior point of IP, which showed statistically significant mean difference with P = 0.026.
Table 3.
One-sample t-test results of the deviation magnitudes comparison of the iTeroR digital model conversion technique between two time periods
Comparison between ortho insight 3D™ plaster model scans and iTero® intraoral scans
Independent sample t-tests were performed to assess the statistically significant mean differences between the two digital model conversion techniques in groups B and C. The test found no statistically significant mean differences for the majority of the variables, P > 0.05. The following eight out of the 31 variables showed statistically significant mean differences with P-values ranging 0.004-0.042: The posterior point of IP, 2D midline upper dev, 2D AP-LL upper dev, 2D AP-LR lower dev, 2D T1 upper dev, 2D T2 upper dev, 2D T3 lower dev, and T4 lower dev. However, since each of the nine cross-sections generated two variables, the corresponding values of the seven 2D statistically different variables were taken into account. The means were approximately the same for all 31 variables, except for the IP variable, when comparing scans of plaster models with Ortho Insight 3D™ laser scanner and iTero® intraoral scans.[24]
Comparison between different subjects’ ortho insight 3D™ plaster model scans
A one-sample t-test was performed to assess the mean magnitude of deviation for each of the 31 variables following the superimposition of two different subjects’ Ortho Insight 3D™ plaster model scans. One subject's Ortho Insight 3D™ plaster model scan was compared with 15 different subjects’ Ortho Insight 3D plaster model scans. No statistical differences were found for the following 3D variables: The most medial and lateral end points of the first and second palatal rugae bilaterally (R1MR, R2MR, R1ML, R2ML, R1LR, R2LR, R1LL, and R2LL) and the most lateral end point of the third palatal ruga on the left side (R3LL), P > 0.05. For the remaining 3D landmarks, namely the IP, the most medial end points of the third palatal ruga bilaterally (R3MR and R3ML), and the most lateral end point of the third palatal ruga on the right side (R3LR) the test found the means to be statistically different with P < 0.05. Three out of the eighteen 2D variables had P > 0.05: 2D AP-LL lower dev, 2D AP-LR lower dev, and 2D T1 lower dev. However, since each of the nine cross sections generated two variables, the corresponding values of those three statistically different variables were taken into account. Overall, all 2D variables in the study group D had statistically significant mean differences with P-values ranging 0.000-0.016.[24]
Comparison between different subjects’ iTero® intraoral scans
A one-sample t-test was performed to assess the mean magnitude of deviation for each of the 31 variables following the superimposition of two different subjects’ iTero® intraoral scans. One subject's iTero® intraoral scan was compared with 15 different subjects’ iTero® intraoral scans. All 18 2D variables in the study showed statistically significant mean differences with P-values ranging 0.000-0.05. All 13 3D landmarks in the study, created from target point selections on the superimposed iTero® intraoral scans from different subjects, had no statistically significant mean differences, P > 0.05.[24]
Discussion
3D evaluation of palatal ruga patterns had not been performed previously, and the strength of this evaluation method was the use of a three-coordinate (XYZ) point system that took into account the anteroposterior, the transverse, and the vertical axes. Many of the previous palatal rugae studies calculated linear distances only on the anteroposterior or transverse reference planes, which can be a source of error. By utilizing 3D measurements, a quantitative result in all three dimensions was obtained, which is more precise and applicable to current clinical settings.
When comparing the different digital model conversion techniques (group A), statistically significant differences were seen for all 2D variables generated from the nine cross-sections of the two superimposed digital models. It is likely that the differences are due to the fact that the most upper and the lowest deviations were generated and distributed mainly on the periphery of the cross-section of the two images. Also, slices in a slightly different position of the section plane or on a slightly different angle of one of the XYZ coordinate axes could yield different results. Nevertheless, 12 of the 3D landmarks, created from target point selection on two superimposed digital models, showed no statistically significant mean differences between the OrthoCAD™ and Ortho Insight 3D™ digital model conversion techniques. Therefore, these results indicate that 2D images and linear measurements are not sufficient for comparing different digital model conversion techniques using the palatal rugae and that 3D analysis should be further performed. The IP is a small oval-shaped projection situated behind the maxillary central incisors. The posterior point of IP, the last of the 13 palatal 3D landmarks, showed statistically significant differences in the study groups A, B, and C. It has been shown in the literature that changes in the IP position can occur during orthodontic treatment or during the transition to the edentulous state.[25,26] The discrepancies found in this study may be due to the movement of the incisors, which could have affected the position of the IP. Furthermore, the IP could have become swollen or inflamed due to gingivitis or gingival overgrowth, which are common during orthodontic treatment.
With regard to the palatal rugae changes resulting from growth and from orthodontic tooth movement, when Ortho Insight 3D™ or iTero® scans of the same subjects 20-24 months apart were compared (groups B and C), statistically significant differences were seen again for all 2D variables. That indicated that 2D images and linear measurements are not sufficient for the verification of a person's identity using the palatal rugae. The 3D landmarks showed no statistically significant mean differences over time and as a result of orthodontic treatment. Studies found within the literature show certain changes of the palatal ruga pattern as a result of growth, orthodontic tooth movement, palatal expansion, or extractions of adjacent teeth.[12,13] However, other studies observed the permanence of most of the palatal rugae points anteroposteriorly, and hence their use as reference landmarks for the analysis of dental casts and for measuring tooth movement comparable with cephalometric superimpositions.[15,27] Based on the current findings, 12 individual 3D palatal landmarks’ mean values and standard deviations were generated using the combined results from study groups B and C [Table 4]. Since no statistically significant mean differences were observed between the Ortho Insight 3D™ and the iTero® scans, the digital conversion technique was not taken into account (groups B and C).
Table 4.
Proposed values for palatal rugae landmarks
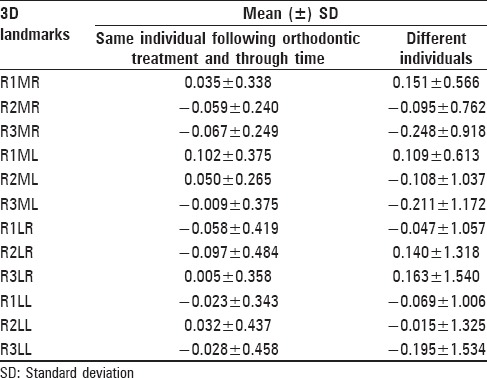
Although all 12 palatal 3D landmarks could be used for verification of the same individual over time, certain landmarks showed a more significant impact on the matching process. Based on the order of the number of rugae and the side of the palate, it was found that no two rugae had exactly matching deviation values. Arranged by strength and importance, the following 3D landmarks are suggested to be used for verification of a person's identity: R3LR, R3ML, R1LL, R3LL, R2LL, R1MR, R2ML, R1LR, R2MR, R3MR, R2LR, and finally R1ML [Table 4]. When comparing the palatal rugae landmarks between different individuals, where one subject's Ortho Insight 3D™ or iTero® scan was superimposed with 15 different subjects’ scans, much higher mean values and standard deviations were generated using the combined results from groups D and E [Table 4]. Although all 12 palatal 3D landmarks could be used for human identification, certain landmarks showed more significant impact on the matching process. Arranged by strength and importance, the following 3D landmarks are suggested to be used for human identification: R3MR, R3ML, R3LL, R3LR, R1MR, R2LR, R1ML, R2ML, R2MR, R1LL, R1LR, and finally R2LL.
Due to their internal anatomical position, surrounded by the cheeks, lips, tongue, buccal pad of fat, teeth, and bone, the palatal rugae are well protected from trauma and high temperatures, and do not demonstrate age-related changes.[2,3,28] To establish a person's identity, forensic odontology or forensic dentistry is currently using comparisons of antemortem and postmortem dental records, which could include findings from clinical examination, radiographs, photographs, and study casts.[29] The findings of this project suggest a clinically relevant methodology for biometric recognition based on palatal ruga patterns using superimposed digital models.
One of the main limitations of the study was the sample size and the period of 20-24 months between the two time point scans. In future studies, increasing the number of participants and implementing this evaluation method with a longitudinal sample would improve its statistical power. It would also be interesting to evaluate palatal rugae landmarks in each decade of life to see if significant differences emerge as a result of growth and aging of the palatal mucosa over more than a couple of years long-term. The software used for obtaining the measurements, Geomagic® Control™ was built for comprehensive inspection in different industries such as parts, tools, molds, and aerospace manufacturers, and requires manual alignment followed by global registration. Custom software specially developed for automated palatal rugae registration and superimposition could reduce human interaction in measurements and recordings, and increase the speed and accuracy of the quantitative analysis. A commonly used matching algorithm in fingerprinting applying feature-based matching or ratios of relative distances as the comparing function could be developed for palatal ruga recognition.
Gender and ethnicity were not considered in this study. Also, changes in palatal rugae form, layout, and characteristics were not accounted for following cleft palate surgery, periodontal surgery, forced eruption of impacted canines, or the use of acrylic pads or buttons in orthodontic appliances such as expanders, distalizers, or anchorage devices. Such changes would most likely occur in a small area of the palatal ruga pattern, but they must be considered and investigated in future studies.
Proposed values for 3D palatal landmarks were introduced that could be useful in forensic odontology for human verification or identification in cases of traffic accidents, in mass casualty incidents such as aviation and natural disasters, industrial explosions, or acts of terrorism. Since the use of 3D digital dental study models is becoming increasingly routine in clinical dentistry and orthodontics with integration into the electronic health record, they can be requested and accessed by forensic institutes.
Conclusion
A 3D approach was developed and utilized for human identification using palatal ruga patterns. The following conclusions were obtained:
No statistically significant mean differences exist between different digital model conversion techniques, between OrthoCAD™ and Ortho Insight 3D™, and between Ortho Insight 3D™ and the iTero® scans, when using the 12 3D palatal rugae landmarks for comparison
2D images and linear measurements in anteroposterior and transverse dimensions were not sufficient for comparing different digital model conversion techniques using the palatal rugae. 3D digital models proved to be a highly effective tool in evaluating different palatal ruga patterns. They allowed for accurate landmark identification, which took into account all three XYZ coordinate axes. Twelve of the 3D palatal landmarks showed no statistically significant mean differences over time and as a result of orthodontic treatment
Although all 12 palatal 3D landmarks could be used for human identification over time, certain landmarks showed more significant impact on the matching process. Arranged by strength and importance, the following 3D palatal landmarks are suggested to be used for verification of a person's identity: R3LR, R3ML, R1LL, R3LL, R2LL, R1MR, R2ML, R1LR, R2MR, R3MR, R2LR, and finally R1ML
Arranged by strength and importance, the following 3D palatal landmarks are suggested to be used for human identification: R3MR, R3ML, R3LL, R3LR, R1MR, R2LR, R1ML, R2ML, R2MR, R1LL, R1LR, and finally R2LL.
Footnotes
Source of Support: Nil
Conflict of Interest: None declared
References
- 1.Patil MS, Patil SB, Acharya AB. Palatine rugae and their significance in clinical dentistry: A review of the literature. J Am Dent Assoc. 2008;139:1471–8. doi: 10.14219/jada.archive.2008.0072. [DOI] [PubMed] [Google Scholar]
- 2.Thomas CJ, Kotze TJ. The palatal ruga pattern: A new classification. J Dent Assoc S Afr. 1983;38:153–7. [PubMed] [Google Scholar]
- 3.Kapali S, Townsend G, Richards L, Parish T. Palatal rugae patterns in Australian aborigines and Caucasians. Aust Dent J. 1997;42:129–33. doi: 10.1111/j.1834-7819.1997.tb00110.x. [DOI] [PubMed] [Google Scholar]
- 4.Jain A, Chowdhary R. Palatal rugae and their role in forensic odontology. J Investig Clin Dent. 2014;5:171–8. doi: 10.1111/j.2041-1626.2013.00150.x. [DOI] [PubMed] [Google Scholar]
- 5.Caldas IM, Magalhães T, Afonso A. Establishing identity using cheiloscopy and palatoscopy. Forensic Sci Int. 2007;165:1–9. doi: 10.1016/j.forsciint.2006.04.010. [DOI] [PubMed] [Google Scholar]
- 6.Bansode SC, Kulkarni MM. Importance of palatal rugae in individual identification. J Forensic Dent Sci. 2009;1:77–81. [Google Scholar]
- 7.English WR, Robison SF, Summitt JB, Oesterle LJ, Brannon RB, Morlang WM. Individuality of human palatal rugae. J Forensic Sci. 1988;33:718–26. [PubMed] [Google Scholar]
- 8.Dawasaz AA, Dinkar AD. Rugoscopy: Predominant pattern, uniqueness, and stability assessment in the Indian Goan population. J Forensic Sci. 2013;58:1621–7. doi: 10.1111/1556-4029.12190. [DOI] [PubMed] [Google Scholar]
- 9.De Angelis D, Riboli F, Gibelli D, Cappella A, Cattaneo C. Palatal rugae as an individualising marker: Reliability for forensic odontology and personal identification. Sci Justice. 2012;52:181–4. doi: 10.1016/j.scijus.2011.09.002. [DOI] [PubMed] [Google Scholar]
- 10.Hemanth M, Vidya M, Shetty N, Karkera BV. Identification of individuals using palatal rugae: Computerized method. J Forensic Dent Sci. 2010;2:86–90. doi: 10.4103/0975-1475.81288. [DOI] [PMC free article] [PubMed] [Google Scholar]
- 11.Yang ST, Kim HK, Lim YS, Chang MS, Lee SP, Park YS. A three dimensional observation of palatal vault growth in children using mixed effect analysis: A 9 year longitudinal study. Eur J Orthod. 2013;35:832–40. doi: 10.1093/ejo/cjs104. [DOI] [PubMed] [Google Scholar]
- 12.Simmons JD, Moore RN, Erickson LC. A longitudinal study of anteroposterior growth changes in the palatine rugae. J Dent Res. 1987;66:1512–5. doi: 10.1177/00220345870660092001. [DOI] [PubMed] [Google Scholar]
- 13.Bailey LT, Esmailnejad A, Almeida MA. Stability of the palatal rugae as landmarks for analysis of dental casts in extraction and nonextraction cases. Angle Orthod. 1996;66:73–8. doi: 10.1043/0003-3219(1996)066<0073:SOTPRA>2.3.CO;2. [DOI] [PubMed] [Google Scholar]
- 14.Barbieri AA, Scoralick RA, Naressi SC, Moraes ME, Daruge E, Jr, Daruge E. The evidence of the rugoscopy effectiveness as a human identification method in patients submitted to rapid palatal expansion. J Forensic Sci. 2013;58(Suppl 1):S235–8. doi: 10.1111/j.1556-4029.2012.02263.x. [DOI] [PubMed] [Google Scholar]
- 15.Almeida MA, Phillips C, Kula K, Tulloch C. Stability of the palatal rugae as landmarks for analysis of dental casts. Angle Orthod. 1995;65:43–8. doi: 10.1043/0003-3219(1995)065<0043:SOTPRA>2.0.CO;2. [DOI] [PubMed] [Google Scholar]
- 16.Jang I, Tanaka M, Koga Y, Iijima S, Yozgatian JH, Cha BK, et al. A novel method for the assessment of three-dimensional tooth movement during orthodontic treatment. Angle Orthod. 2009;79:447–53. doi: 10.2319/042308-225.1. [DOI] [PubMed] [Google Scholar]
- 17.Fleming PS, Marinho V, Johal A. Orthodontic measurements on digital study models compared with plaster models: A systematic review. Orthod Craniofac Res. 2011;14:1–16. doi: 10.1111/j.1601-6343.2010.01503.x. [DOI] [PubMed] [Google Scholar]
- 18.Okunami TR, Kusnoto B, BeGole E, Evans CA, Sadowsky C, Fadavi S. Assessing the American Board of Orthodontics objective grading system: Digital vs plaster dental casts. Am J Orthod Dentofacial Orthop. 2007;131:51–6. doi: 10.1016/j.ajodo.2005.04.042. [DOI] [PubMed] [Google Scholar]
- 19.Ender A, Mehl A. Full arch scans: Conventional versus digital impressions-an in-vitro study. Int J Comput Dent. 2011;14:11–2. [PubMed] [Google Scholar]
- 20.Sousa MV, Vasconcelos EC, Janson G, Garib D, Pinzan A. Accuracy and reproducibility of 3-dimensional digital model measurements. Am J Orthod Dentofacial Orthop. 2012;142:269–73. doi: 10.1016/j.ajodo.2011.12.028. [DOI] [PubMed] [Google Scholar]
- 21.Thiruvenkatachari B, Al-Abdallah M, Akram NC, Sandler J, O’Brien K. Measuring 3-dimensional tooth movement with a 3-dimensional surface laser scanner. Am J Orthod Dentofacial Orthop. 2009;135:480–5. doi: 10.1016/j.ajodo.2007.03.040. [DOI] [PubMed] [Google Scholar]
- 22.Patzelt SB, Emmanouilidi A, Stampf S, Strub JR, Att W. Accuracy of full-arch scans using intraoral scanners. Clin Oral Investig. 2014;18:1687–94. doi: 10.1007/s00784-013-1132-y. [DOI] [PubMed] [Google Scholar]
- 23.Kravitz ND, Groth C, Jones PE, Graham JW, Redmond WR. Intraoral digital scanners. J Clin Orthod. 2014;48:337–47. [PubMed] [Google Scholar]
- 24.Taneva E. Chicago, IL: University of Illinois; 2014. 3D Evaluation of Palatal Rugae for Human Identification. [Google Scholar]
- 25.Castro LO, Borges GJ, Castro IO, Porto OC, Freitas JC, Estrela C. Change of incisive papilla height due to orthodontic movement: An evaluation in study models and three-dimensional images. Stomatos. 2012;18:52–9. [Google Scholar]
- 26.Solomon EG, Arunachalam KS. The incisive papilla: A significant landmark in prosthodontics. J Indian Prosthodont Soc. 2012;12:236–47. doi: 10.1007/s13191-012-0169-y. [DOI] [PMC free article] [PubMed] [Google Scholar]
- 27.Hoggan BR, Sadowsky C. The use of palatal rugae for the assessment of anteroposterior tooth movements. Am J Orthod Dentofacial Orthop. 2001;119:482–8. doi: 10.1067/mod.2001.113001. [DOI] [PubMed] [Google Scholar]
- 28.Muthusubramanian M, Limson KS, Julian R. Analysis of rugae in burn victims and cadavers to simulate rugae identification in cases of incineration and decomposition. J Forensic Odontostomatol. 2005;23:26–9. [PubMed] [Google Scholar]
- 29.Pretty IA, Sweet D. A look at forensic dentistry-Part 1: The role of teeth in the determination of human identity. Br Dent J. 2001;190:359–66. doi: 10.1038/sj.bdj.4800972. [DOI] [PubMed] [Google Scholar]


