

Dear Editor,
Vestibular-evoked myogenic potentials are increasingly being used as clinical tests of otolith function. Cervical vestibular-evoked myogenic potentials are short latency electromyograms, elicited by acoustic or vibration stimuli, that measure the sacculo-collic reflex. They are recorded by electrodes placed over the sternocleidomastoid muscle. The presence of a cervical vestibular-evoked myogenic potential is dependent upon the integrity of the inferior vestibular nerve and is abolished after nerve section.1 Tap-evoked ocular vestibular-evoked myogenic potentials are short latency electromyograms that measure the utriculo-ocular reflex. The presence of an ocular vestibular-evoked myogenic potential is dependent upon the integrity of the superior vestibular nerve. Ocular vestibular-evoked myogenic potentials are recorded from the inferior oblique muscle by electrodes placed below the eyes.2
Wave latencies vary depending on the applied stimuli. A few studies have provided normative data for latencies of cervical vestibular-evoked myogenic potentials elicited by tone bursts and clicks.3 However, normative latency ranges for cervical and ocular vestibular-evoked myogenic potentials elicited by different stimuli, including tone bursts, clicks, mini-shaker oscillations and reflex hammer taps, have not been well studied. These ranges would be helpful in the clinical setting to determine whether an observed response represents a vestibular response. For example, a sound-evoked response by the posterior auricular muscle, with a latency of 11.5 ms, looks like a cervical vestibular-evoked myogenic potential but occurs earlier.4 Similarly, later components of the cervical vestibular-evoked myogenic potential tracing are likely cochlear and not vestibular in origin.5
The aims of this study are to describe normative ranges for cervical and ocular vestibular-evoked myogenic potential latencies in response to various stimuli and present technical pearls from our testing experience.
Materials and methods
Ethical considerations
Subjects gave informed consent for vestibular-evoked myogenic potential testing protocols approved by the institutional review board at the Johns Hopkins University School of Medicine.
Subjects
Fifty-three individuals without hearing, vestibular or other neurological deficits participated in the study. There were 26 men and 28 women age 20–70 years (mean 35.3 years). These individuals are part of the cohort evaluated by Nguyen, et al.6
Stimuli and recording techniques
Air-conducted sound stimuli consisted of (i) 0.1 ms, 105 dB nHL (140 dB peak SPL) clicks of positive polarity at repetition rate of 5 Hz and (ii) 500 Hz, 125 dB SPL tone bursts of positive polarity, with 1 ms rise/fall time, 2 ms plateau, at a repetition rate of 5 Hz. Sound stimuli were delivered monaurally through foam eartips (Aearo Company Auditory Systems, Indianapolis, IN, USA) on intraauricular speakers from VIASYS Healthcare (Madison, WI, USA). Mid-line vibration stimuli consisted of head taps delivered (i) manually with an Aesculap model ACO12C reflex hammer fitted with an inertial microswitch trigger and with (ii) a Brüel and Kjær Mini-Shaker Type 4810 (Norcross, GA, USA). Head taps were delivered at Fz, in the mid-line at the hairline, 30% of the distance between the inion and nasion. One hundred sweeps for air-conducted sound and fifty sweeps for head taps were averaged for each test.
For vestibular-evoked myogenic potential recording, a commercial electromyographic system (software version 14.1; Carefusion Synergy, Dublin, OH, USA) was used. Electromyogram signals were recorded with disposable, self-adhesive, pregelled, Ag/AgCl electrodes with 40-inch safety leadwires from GN Otometrics (Schaumburg, IL, USA). Electromyogram signals were amplified 2500× and band-pass filtered, 20–2000 Hz for cervical vestibular-evoked myogenic potentials and 3–500 Hz for ocular vestibular-evoked myogenic potentials.
For cervical vestibular-evoked myogenic potential testing, participants laid with upper bodies increased at 30° from horizontal. A non-inverting electrode was placed at the mid-point of the sternocleidomastoid muscle, an inverting electrode was placed on the sternoclavicular junction, and a ground electrode was placed on the manubrium sterni. Participants were instructed to lift their heads up from the head rest to provide tonic background sternocleidomastoid activity during stimulation and recording, and a pre-stimulus rectified surface electromyogram signal of at least 30 μV was required for accepting a cervical vestibular-evoked myogenic potential tracing.
For ocular vestibular-evoked myogenic potential testing, participants laid with upper bodies increased at 30° from horizontal. A non-inverting electrode was placed on the cheek ≈3 mm below the eye, directly beneath the pupil, an inverting electrode was placed 2 cm below the non-inverting electrode, and a ground electrode was placed on the manubrium sterni. Before stimulation, participants were instructed to perform 20° vertical saccades to ensure that symmetrical signals were recorded from both eyes. If signals showed >25% asymmetry, the electrodes were removed and new ones applied. Participants were instructed to maintain a 20° upgaze during ocular vestibular-evoked myogenic potential stimulation and recording.
Response parameters
The cervical vestibular-evoked myogenic potential waveform consists of a positive peak (p13), identified as the first distinctive trough in the waveform, followed by a negative peak (n23), identified as the first distinctive peak in the waveform. Rectified background electromyogram activity was recorded during the 10-ms interval before stimulus onset. The ocular vestibular-evoked myogenic potential waveform consists of a negative peak (n10), identified as the first distinctive peak in the waveform, followed by a positive peak (p16), identified as the first distinctive trough in the waveform.
Mean values for cervical and ocular vestibular-evoked myogenic potential latencies were calculated. Latency ranges were calculated as two standard deviations above and below the mean.
Results
Mean values and ranges are reported for ocular and cervical vestibular-evoked myogenic potential latencies with various stimuli in Table 1. Figures 1 and 2 compare ambiguous waveforms encountered in our practice to normative cervical and ocular vestibular-evoked myogenic potentials in response to 500 Hz tone bursts and reflex hammer taps, respectively. These waveforms have a characteristic shape, but their latencies fall outside the ranges reported in Table 1, therefore, according to our objective criteria, we did not record them as vestibular-evoked myogenic potential responses.
Table 1. Median values and ranges for cervical and ocular vestibular-evoked myogenic potential latencies.
| Cervical vestibular-evoked myogenic potential stimulus | p13 Latency | n23 Latency |
|---|---|---|
| 500 Hz tone bursts | 13.70 11.81–15.59 | 21.90 18.15–25.64 |
| 0.1-ms clicks | 11.82 9.76–13.88 | 20.04 14.84–25.24 |
| Mini-shaker | 12.83 10.61–15.05 | 20.72 16.75–24.69 |
| Reflex hammer | 11.54 8.46–14.63 | 18.87 14.07–23.68 |
|
| ||
| Ocular vestibular-evoked myogenic potential stimulus | n10 Latency | p16 Latency |
|
| ||
| 500 Hz tone bursts | 10.57 8.77–12.37 | 16.07 13.26–18.88 |
| 0.1-ms clicks | 8.87 6.86–10.88 | 14.10 10.94–17.27 |
| Mini-shaker | 9.50 7.78–11.22 | 14.72 12.34–17.10 |
| Reflex hammer | 7.81 5.56–10.07 | 13.15 10.74–15.55 |
Fig. 1.
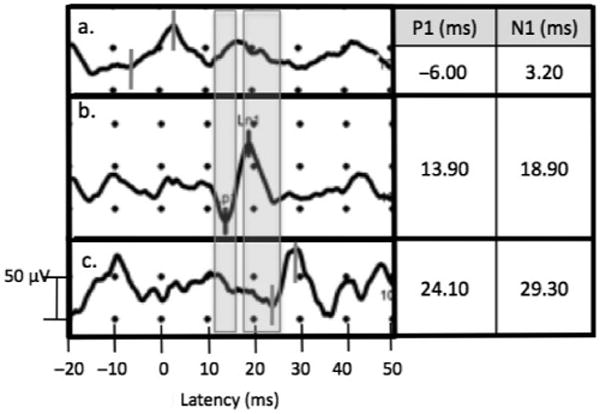
Cervical vestibular-evoked myogenic potential recording with 500 Hz TB stimulus showing characteristic waveform appearing at latencies before normal range (a), within normal range (b), and after normal range (c). Shaded areas correspond to p13 and n23 ranges: 11.81–15.59 and 18.15–25.64 ms, respectively.
Fig. 2.
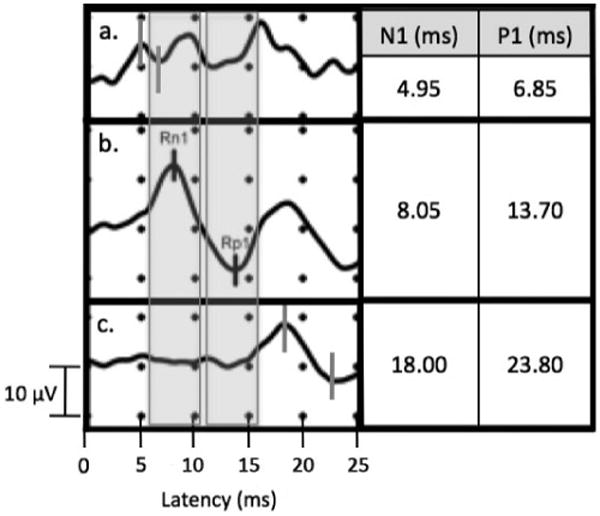
Ocular vestibular-evoked myogenic potential recording with reflex hammer tap stimulus showing characteristic waveform appearing at latencies before normal range (a), within normal range (b), and after normal range (c). Shaded areas correspond to n10 and p16 ranges: 5.56–10.07 and 10.74–15.55 ms, respectively.
The rectifying background electromyogram tracing should exhibit simultaneous spikes when myogenic responses are present. Figure 3 shows a characteristic cervical vestibular-evoked myogenic potential response on each side to a 500 Hz tone burst stimulus with accompanying spike in background electromyogram activity at the same latency as the vestibular response.
Fig. 3.
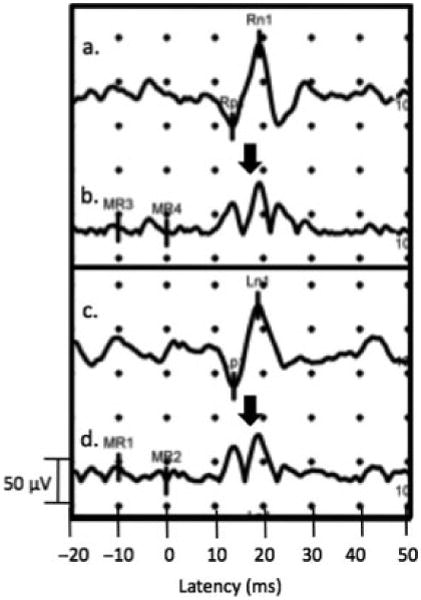
Characteristic unrectified right (a) and left (c) cervical vestibular-evoked myogenic potential signal and corresponding background electromyogram activity from the left (b) and right (d) sternocleidomastoid with 500 Hz TB stimulus. Arrows show the increased background electromyogram activity at the time of the vestibular response.
The following are technical pearls for optimising vestibular-evoked myogenic potential testing.
During ocular vestibular-evoked myogenic potential calibration to ensure symmetrical recording of vertical saccades from each eye, the non-inverting electrode can be placed closer to the eye and the inverting electrode further to increase the saccade amplitude for one eye. To decrease saccade amplitude for one eye, the non-inverting electrode can be placed further below the eye and the inverting electrode closer. Care should be taken to make slight adjustments as moving the electrodes too much could result in signals from other muscles and thus non-vestibular responses.
For vibration-evoked ocular vestibular-evoked myogenic potentials, if patients have hair covering Fz, the tester should hold the hair back without contacting the subject's head when delivering the vibration stimulus.
Ensuring tonic sternocleidomastoid muscle contraction is crucial for recording cervical vestibular-evoked myogenic potentials. In individuals unable to sustain a muscle contraction by elevating their heads, an alternative method of rotating the head in the supine position (head down in the yaw plane) may be attempted. However, this method has been associated with longer latencies, lower response rates and smaller amplitudes.7 Given these considerations, it is important to keep testing conditions consistent as the degree of muscle activation and neck flexion can significantly affect the parameters measured.
Subjects with longer necks tend to have later cervical vestibular-evoked myogenic potential responses because the efferent signal has to travel a longer distance.8
Prolonged ocular and cervical vestibular-evoked myogenic potential latencies can be observed in individuals with central neurological lesions, such as multiple sclerosis, emphasising the value of vestibular-evoked myogenic potential testing for central lesions as well peripheral ones.9
Subjects with more subcutaneous fat will have lower ocular and cervical vestibular-evoked myogenic potential responses.8
Ocular and cervical vestibular-evoked myogenic potential latencies vary according to the stimulus used. Ocular vestibular-evoked myogenic potentials evoked by reflex hammer taps exhibit the earliest latencies, followed by those evoked by the Mini-Shaker and clicks, with responses evoked by tone bursts appearing at the latest latencies. Cervical vestibular-evoked myogenic potentials evoked by reflex hammer taps also exhibit the earliest latencies, followed by those evoked by clicks and the Mini-Shaker, with responses evoked by tone bursts also appearing at the latest latencies.
Discussion
We report latency ranges for vestibular-evoked myogenic potential testing with a variety of stimuli. Previously published cervical vestibular-evoked myogenic potential latencies for air-conducted sound are consistent with those displayed in Table 1. We do not provide age-stratified ranges as some studies have performed, given that we want to be able to identify responses outside the normative range, whether the responses are due to ageing or other pathologies.
Vestibular-evoked myogenic potential latencies differ for various stimuli, with the biggest difference between reflex hammer tap-evoked responses and 500 Hz tone burst-evoked responses. Testing with reflex hammer taps utilises an inertial microswitch trigger to begin recording. The very short latencies of the reflex hammer may reflect a triggering of the recording after the hammer begins to transfer energy to the skull. Additionally, the reflex hammer tap is a suprathreshold stimulus that generates a more immediate response, while the 500 Hz tone burst is a less intense, non-physiologic stimulus that requires a longer time for sound energy to generate a synchronised response.
Regarding sound stimuli, there are significant changes in responses depending on frequency and duration of the sound.10 Given the dependence of vestibular-evoked myogenic potential response on specific testing conditions, it is important that centres involved in vestibular-evoked myogenic potential testing use their own normative controls for various stimuli.
This study characterises vestibular-evoked myogenic potential responses to a variety of stimuli and provides clinically applicable ranges and practical guidelines for eliciting and interpreting vestibular-evoked myogenic potential tracings.
Keypoints.
Cervical and ocular vestibular-evoked myogenic potentials are clinical tests of saccular and utricular function, respectively.
Vestibular-evoked myogenic potentials parameters are affected significantly by testing conditions and technical pitfalls. Ambiguities exist in the interpretation of vestibular-evoked myogenic potential tracings.
This study describes the procedure for eliciting cervical and ocular vestibular-evoked myogenic potentials using a variety of air- and bone-conducted stimuli in a healthy adult population. Additionally, several technical considerations in recording and interpreting vestibular-evoked myogenic potential tracings are described.
Normative ranges of latencies are reported to aid in the identification of vestibular-evoked responses from other waveforms in the clinical setting.
Consideration of these technical details and rigorous adherence to laboratory-generated normative ranges are important for the objective interpretation of vestibular-evoked myogenic potentials.
Footnotes
Conflicts of interest: None to declare.
References
- 1.Colebatch JG, Halmagyi GM, Skuse NF. Myogenic potentials generated by a click-evoked vestibulocollic reflex. J Neurol Neurosurg Psychiatry. 1994;57:190–197. doi: 10.1136/jnnp.57.2.190. [DOI] [PMC free article] [PubMed] [Google Scholar]
- 2.Weber KP, Rosengren SM, Michels R, et al. Single motor unit activity in human extraocular muscles during the vestibulo-ocular reflex. J Physiol. 2012;590:3091–3101. doi: 10.1113/jphysiol.2011.226225. [DOI] [PMC free article] [PubMed] [Google Scholar]
- 3.Singh NK, Kashyap RS, Supreetha L, et al. Characterization of age-related changes in sacculocolic response parameters assessed by cervical vestibular evoked myogenic potentials. Eur Arch Otorhinolaryngol. 2013;271:1869–1877. doi: 10.1007/s00405-013-2672-0. [DOI] [PubMed] [Google Scholar]
- 4.Funahashi K, Imae S, Kuwata T, et al. Postauricular response in motor paresis with intracranial lesions. Neurol Med Chir (Tokyo) 1992;32:566–571. doi: 10.2176/nmc.32.566. [DOI] [PubMed] [Google Scholar]
- 5.Welgampola MS, Colebatch JG. Characteristics and clinical applications of vestibular-evoked myogenic potentials. Neurology. 2005;64:1682–1688. doi: 10.1212/01.WNL.0000161876.20552.AA. [DOI] [PubMed] [Google Scholar]
- 6.Nguyen KD, Welgampola MS, Carey JP. Test-retest reliability and age-related characteristics of the ocular and cervical vestibular evoked myogenic potential tests. Otol Neurotol. 2010;31:793–802. doi: 10.1097/MAO.0b013e3181e3d60e. [DOI] [PMC free article] [PubMed] [Google Scholar]
- 7.Wang CT, Young YH. Comparison of the head elevation versus rotation methods in eliciting vestibular evoked myogenic potentials. Ear Hear. 2006;27:376–381. doi: 10.1097/01.aud.0000224126.24604.db. [DOI] [PubMed] [Google Scholar]
- 8.Chang CH, Yang TL, Wang CT, et al. Measuring neck structures in relation to vestibular evoked myogenic potentials. Clin Neurophysiol. 2007;118:1105–1109. doi: 10.1016/j.clinph.2007.01.020. [DOI] [PubMed] [Google Scholar]
- 9.Gazioglu S, Boz C. Ocular and cervical vestibular evoked myogenic potentials in multiple sclerosis patients. Clin Neurophysiol. 2012;123:1872–1879. doi: 10.1016/j.clinph.2012.01.022. [DOI] [PubMed] [Google Scholar]
- 10.Rosengren SM, Govender S, Colebatch JG. The relative effectiveness of different stimulus waveforms in evoking VEMPs: significance of stimulus energy and frequency. J Vestib Res. 2009;19:33–40. doi: 10.3233/VES-2009-0345. [DOI] [PubMed] [Google Scholar]