Abstract
Ultrasound-stimulated microbubble dynamics have been shown to be dependent on intrinsic bubble properties, including size and shell characteristics. The effect of the surrounding environment on microbubble response, however, has been less investigated. In particular, microbubble optimization studies are generally conducted in water/saline, characterized by a 1 cP viscosity, for application in the vasculature (i.e., 4 cP). In this study, ultra-high speed microscopy was employed to investigate fluid viscosity effects on phospholipid encapsulated microbubble oscillations at 1 MHz, using a single, eight-cycle pulse at peak negative pressures of 100 and 250 kPa. Microbubble oscillations were shown to be affected by fluid viscosity in a size- and pressure-dependent manner. In general, the oscillation amplitudes exhibited by microbubbles between 3 and 6 μm in 1 cP fluid were larger than in 4 cP fluid, reaching a maximum of 1.7-fold at 100 kPa for microbubbles 3.8 μm in diameter and 1.35-fold at 250 kPa for microbubbles 4.8 μm in diameter. Simulation results were in broad agreement at 250 kPa, however generally underestimated the effect of fluid viscosity at 100 kPa. This is the first experimental demonstration documenting the effects of surrounding fluid viscosity on microbubble oscillations, resulting in behavior not entirely predicted by current microbubble models.
I. INTRODUCTION
Ultrasound contrast agent consists of a suspension of encapsulated, gas-filled microbubbles. These microbubbles, typically between 1 and 10 μm in diameter, possess scattering cross-sections several orders of magnitude larger than their geometric cross-sections at resonance (Medwin, 1977) and provide significant signal enhancement in the vasculature to which they are confined. Aside from being strong linear scatterers (i.e., scattering at the transmit frequency), microbubbles can scatter nonlinearly, often possessing harmonic and/or subharmonic content that is a direct consequence of nonlinear microbubble radial oscillations (Leighton, 1994). Indeed, it is the nonlinear character of microbubbles that is exploited in contrast imaging strategies (Brock-Fisher et al., 1996; Burns et al., 2000), commonly employed in diagnostic applications including echocardiography (Mulvagh et al., 2008; Porter and Xie, 2010) and blood flow assessment of the kidneys (Wei et al., 2001) and liver (Burns et al., 2000). Furthermore, recent studies have employed contrast ultrasound in a molecular imaging context, capable of relaying site-specific imaging information (e.g., Yeh et al., 2015).
Many studies have been dedicated to the optimization of ultrasound parameters and microbubble formulations, as well as to a further understanding of the physical mechanisms by which microbubbles oscillate nonlinearly, with a view to improving contrast image quality in an in vivo environment. Microbubble behavior is known to be affected by its encapsulation properties, and previous simulation and in vitro studies have shown that encapsulation material affects microbubble resonance frequency (Church, 1995; de Jong et al., 1992) and nonlinear emissions (Frinking et al., 1999; de Jong et al., 1994). More recently, microbubble encapsulation material rheology has garnered much interest, revealing nonlinear radial behaviors including nonlinear resonance (Overvelde et al., 2010) and “compression-only” oscillations (de Jong et al., 2007) that play a mechanistic role in the nonlinear signals that are exploited through microbubble-specific imaging strategies (e.g., amplitude modulation). In addition to intrinsic microbubble composition, the surrounding physical environment has been shown to influence microbubble behavior. Ambient temperature, for example, has been shown to affect microbubble oscillation amplitudes (Vos et al., 2008) and nonlinear behavior (Mulvana et al., 2011). Simulation and in vitro studies have also shown that microbubble proximity to a neighboring boundary (e.g., vessel wall) may also affect its behavior, both in terms of radial oscillations and far-field scattered pressure (Doinikov et al., 2011; Garbin et al., 2007; Helfield et al., 2014b,c).
The effect of the surrounding fluid viscosity on microbubble behavior has been less investigated. While there have been a limited number of simulation-based studies on bubble behavior in generalized viscoelastic fluids (Allen and Roy, 2000b; Khismatullin and Nadim, 2002; Tanasawa and Yang, 1970) and on inertial cavitation thresholds within viscous media (Allen et al., 1997; Deng et al., 1996), direct experimental-based evidence of the manner in which fluid viscosity affects encapsulated microbubble oscillation amplitudes has not been previously demonstrated. The majority of in vitro microbubble optimization studies have been performed in de-ionized water or saline, characterized by a liquid viscosity of 0.001 Pa s (1 cP). Within the vasculature, microbubbles are situated within the blood pool, characterized by deformable red blood cells within plasma (a Newtonian fluid) and exhibits a hematocrit percentage and shear-rate dependent viscosity (Walker et al., 1976). Under normal physiological conditions in vivo, the viscosity of blood is typically 0.004 Pa s (4 cP), and therefore approximately four times greater than that of water or saline. The damping of microbubble oscillations is, in part, dictated by the viscous effects of the surrounding host fluid and therefore a change in fluid viscosity is expected to alter oscillation behavior. Our previous work has investigated the effect of fluid viscosity on individual microbubble disruption and on the scattered emissions from microbubble populations subjected to relatively large acoustic pressures (0.5–2 MPa), determining that the propensity for microbubble fragmentation significantly decreases for microbubbles situated in 4 cP fluid as compared to 1 cP fluid (Helfield et al., 2015).
The present study aims to investigate the effect of the surrounding fluid viscosity on non-inertial microbubble oscillation dynamics, subjected to relatively low acoustic pressures. Individual microbubble dynamics were recorded by employing an ultra-high frame rate imaging system in which the fundamental and second harmonic microbubble oscillations in either a 1 or 4 cP fluid were assessed. Simulations were then performed using a generally accepted nonlinear model in order to place the experimental results within a physical framework.
II. MATERIALS AND METHODS
A. Viscosity measurements
Fluid viscosity adjustments were performed by diluting polyvinylpyrrolidone (PVP) (#PVP360-100 g, Sigma-Aldrich, St. Louis, MO), a biologically inert polymer, in phosphate-buffered saline (PBS) (#17-516 F, Lonza, Walkersville, MD); a technique that has been previously employed for this purpose (Bolten and Turk, 2011). Pure PBS and a 1.25% PVP solution at room temperature were employed to achieve fluid viscosities of 1.05 ± 0.01 cP and 4.02 ± 0.01 cP, respectively, as measured using a capillary viscometer (model C445, Cannon Instrument Company, State College, PA). Measurements were repeated four times and the means and standard deviations are presented. Given the relatively small amount of PVP in solution (i.e., 1.25%), it is assumed that the density of the 4 cP fluid remains approximated by ρ = 1000 kg/m3.
B. Contrast agent preparation
Phospholipid encapsulated microbubbles were fabricated in-house (Weller et al., 2002). Briefly, microbubbles were prepared from a lipid aqueous dispersion composed of polyoxyethylene (40) stearate (Sigma-Aldrich, St. Louis, MO), 1,2-distearoyl-sn-glycero-3-phosphocholine (DSPC), and 1,2-distearoyl-sn-glycero-3-phosphoethanolamine-N-[methoxy(polyethylene glycol)-2000] (DSPE-mPEG2000) (Avanti Polar Lipids, Alabaster, AL). Polyoxyethylene (40) stearate, DSPC and DSPE-mPEG2000 (1:2:1, w/w/w) were dissolved in chloroform. After chloroform evaporation, the solution was vacuum-dried. The dried lipid film was rehydrated in saline with a final lipid concentration of 10 mg/mL for 4 h at room temperature, and sonicated with a 20 kHz probe (Heat Systems Ultrasonics, Newtown, CT) in the presence of perfluorobutane gas (FluoroMed, L.P., Round Rock, TX).
C. Optical-acoustical apparatus
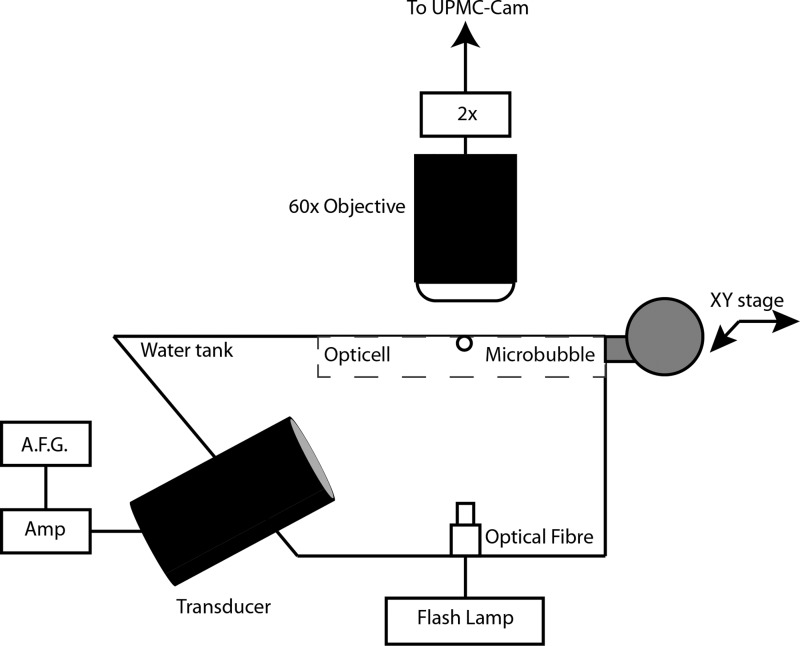
The optical-acoustical apparatus is similar to our previous study (Helfield et al., 2015). Briefly, a water tank was constructed in order to house both a single element transducer (f = 1 MHz, f# = 1.67; −6 dB beam width of 2.5 mm; model A302S-SU-F1.63-PTF, Olympus NDT, Waltham, MA) at an angle of 45° from below and a white light illumination fiber optic (Fig. 1). The tank was filled with de-ionized water and placed under a 60× water-coupled objective lens (LUMPLFL, 100X/WI, Olympus), coupled to a 2× magnifier and to the UPMC-Cam (Chen et al., 2013), an ultrafast frame rate microscopy imaging system capable of recording up to 25 × 106 frames per second (25 Mfps) for 128 frames. Optical-acoustical co-alignment was performed with a pulse-echo approach after which suspensions of microbubbles were diluted in either 1 or 4 cP fluid and injected in an OpticellTM chamber (Thermo Scientific, Waltham, MA) placed on an XY positioning stage. At least 8 h prior to experiments, the OpticellTM was pre-treated with 2% bovine serum albumin (BSA; Sigma Aldrich #A2153, St. Louis, MO) in order to mitigate any potential bubble adhesion to the polystyrene layer. Individual microbubbles were insonicated with a 1 MHz, eight-cycle cosine-tapered pulse, generated from an arbitrary function generator (AFG3252, Tektronix, Beaverton, OR) and amplified by a gated RF power amplifier (Model 250A250AM8, Amplifier Research, Souderton, PA). All experiments were performed at room temperature. The transmit pulses were sent at a peak negative pressure of either 100 or 250 kPa, as measured in water in a separate tank with a hydrophone (HGL-0200, Onda Corp, Sunnyvale, CA). With the attenuation coefficient assumed to be proportional to the fluid viscosity [Stokes-Kirchhoff's equation, e.g., Shutilov (1988)], KZK simulations in both fluid environments were conducted and confirm negligible differences (<1%) in peak negative pressure and propagation harmonic amplitudes between the two fluids (data not shown).
FIG. 1.
Schematic view of the experimental apparatus. Individual microbubbles were interrogated from below with a single element transducer, employing a single, 1 MHz, 8-cycle Tukey window tapered pulse with a peak negative pressure of either 100 or 250 kPa.
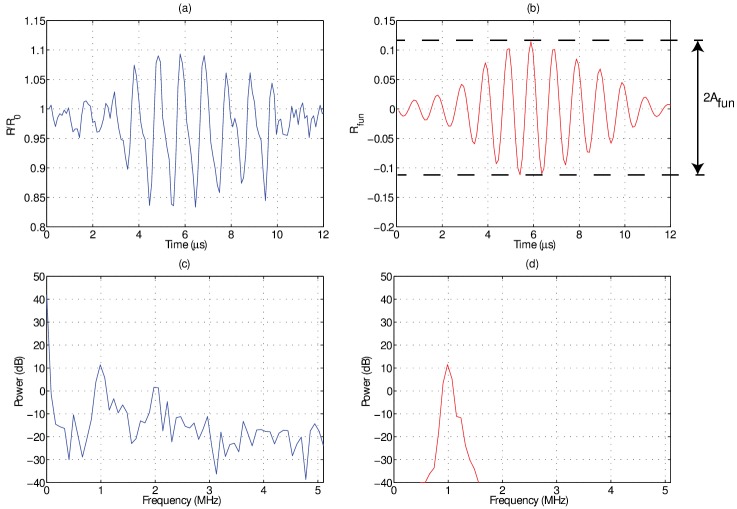
An offline analysis in matlab (The Mathworks, Natick, MA) was performed to extract the dynamic behavior of individual microbubbles from the ultra-high frame rate recordings. This was accomplished by employing a minimum cost algorithm based on pixel intensity gradients to identify microbubble borders. Figure 2 highlights the data analysis protocol for microbubble oscillation curves extracted from ultra-high speed imaging with the UPMC-Cam. In panel (a), an example of a raw, radius-time curve for a 3.7 μm diameter microbubble is shown, normalized to its initial size, along with the associated Fourier power spectrum shown in panel (c). The radius-time curve was then band-pass filtered around the fundamental frequency (1 MHz) with a digital Butterworth filter with a pass band of 0.4 MHz. The resulting time-domain and Fourier-domain representations are shown in panels (b) and (d), respectively. The amplitude of the resulting time-domain signal is then extracted. This metric represents the maximum relative fundamental radial excursion, i.e., the maximum oscillation amplitude of a microbubble at the fundamental frequency (1 MHz) normalized by its initial size. This procedure was then repeated to isolate the second harmonic response , namely the maximum oscillation at 2 MHz normalized by its initial size. This frequency decomposition analysis was chosen as opposed to simply employing the maximum amplitude as extracted from the raw data, for two main reasons: first, filtering the raw signal around the most pertinent frequency components (i.e., largest contributions—fundamental and second-harmonic) results in a more robust metric that is less prone to processing errors from the extraction process of raw, radius versus time curves. That being said, the pertinent results on the effect of viscosity as described by presented in this study are similar to that on the raw maximum amplitude (data not shown). Second, analyzing the oscillation amplitude at a particular frequency allows for more specific physical insight (i.e., the response frequency dimension is not collapsed). It is well known that microbubbles can oscillate at super and sub harmonic frequencies (Leighton, 1994), and that oscillations from different frequency components (e.g., fundamental, second-harmonic) may each exhibit differential dependencies on factors such as microbubble size or transmit amplitude (Prosperetti, 2013; Shankar et al., 1998; Sijl et al., 2011; Sprague et al., 2010). This type of individual microbubble analysis is similar to that employed in previous ultra-high frame rate microscopy studies (Overvelde et al., 2010; Sijl et al., 2011; Thomas et al., 2012).
FIG. 2.
(Color online) An example of the data analysis performed on individual microbubble radius-time curves in order to obtain the relative fundamental oscillation amplitude (). (a) The raw normalized radius versus time curve and (c) its Fourier transform as extracted from an ultrafast frame rate microscopy recording of a 3.7 μm diameter microbubble in a 1 cP solution. After applying a band-pass filter around the transmit frequency (1 MHz), panels (b) and (d) illustrate the resulting time and frequency domain representation; namely the radial oscillations at the fundamental frequency . The amplitude of this function is defined as the relative fundamental oscillation amplitude .
The experimental noise floor is dictated by the intensity profile of the flash lamp, the variability of the focal plane, and the microbubble diameter extraction software. An estimate of the noise floor was calculated through an identical analysis (Fig. 2) of noise-only ultra-high frame rate recordings with no ultrasound present. A relative amplitude of 0.01 was determined, independent of response frequency, to be within the noise of the system and thus band-passed oscillations less than 1% of the initial microbubble diameter were excluded from further analysis.
D. Individual microbubble simulations
Simulations of individual encapsulated microbubble behavior were conducted in order to place the experimentally obtained radial profiles within a theoretical framework. Specifically, the radial profile was simulated by employing the nonlinear model (Marmottant et al., 2005):
| (1) |
where is the liquid density, is the equilibrium gas pressure within the bubble, is the equilibrium bubble radius, is the polytropic index, c is the speed of sound, is the liquid viscosity, is radius dependent surface tension, is the shell viscosity, is the external ultrasound pressure, and the dots denote differentiation with time. It is important to note that the Marmottant model requires three model inputs to specify the effects of the encapsulation; the shell viscosity , the shell elasticity, and an initial surface tension . The latter two shell properties are related to ; see Marmottant et al. (2005) for a complete description.
III. RESULTS
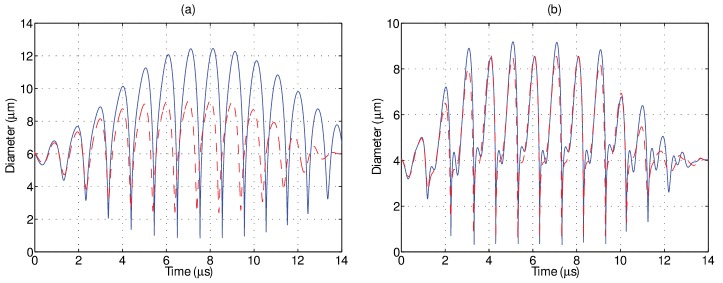
Figure 3 depicts the simulated oscillation of two sized-matched microbubbles located in either a 1 (solid) or 4 cP (dashed) fluid environment and insonicated at a peak negative pressure of (a) 100 and (b) 250 kPa. The particular bubble sizes chosen for these simulations are based on experimental results (Figs. 5 and 6). The remaining simulation parameters were as follows: = 1000 kg/m3, = , = 100 kPa, = 0.8 N/m, = 3 × 10⁻⁹ kg/s, and = 0.01 N/m. The values for the shell elasticity and viscosity were extracted from the fitting of linearized microbubble models to the frequency-dependent attenuation exhibited by this in-house agent (data not shown), a technique commonly employed for such a purpose (Goertz et al., 2007; Helfield et al., 2014a; Hoff et al., 2000; de Jong et al., 1992; Sarkar et al., 2005). The particular value of chosen here is comparable to that which has been employed in previous studies for other lipid encapsulated agents (Overvelde et al., 2010; Sijl et al., 2011). At these transmit amplitudes, these simulations result in highly nonlinear behavior, as indicated by asymmetric oscillations and by distinct second harmonic oscillations, in particular, at 250 kPa. Figure 3(a) illustrates that for a 6.0 μm microbubble at 100 kPa, the effect of a larger fluid viscosity manifests itself in a reduction of oscillation amplitude of 25%, as well as a significant dampening of the last few oscillation cycles. At 250 kPa [Fig. 3(b)], these same effects are present but to a lesser extent. The oscillation amplitude of a 4.0 μm microbubble decreases by approximately 10%, and the second harmonic component is also visibly reduced.
FIG. 3.
(Color online) Simulated diameter versus time plots obtained through Eq. (1) in a 1 cP (solid) and 4 cP (dashed) liquid at (a) 100 kPa and (b) 250 kPa.
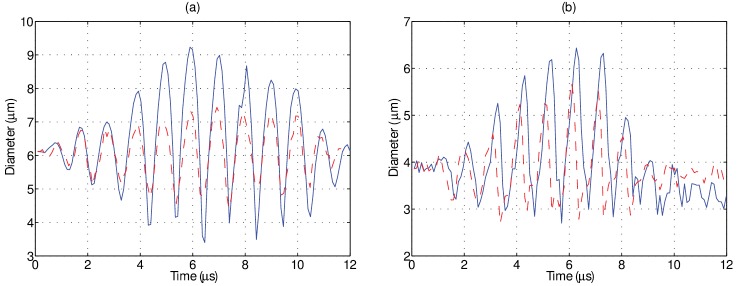
FIG. 5.
(Color online) Example of experimentally determined diameter versus time plots obtained via ultrafast frame rate microscopy at approximately 10.6 Mfps for sized matched individual microbubbles in a 1 cP (solid) and 4 cP (dashed) liquid at (a) 100 kPa and (b) 250 kPa. For the microbubbles examined in this figure, the 4 cP liquid serves to reduce the amplitude of oscillation at both pressure levels.
FIG. 6.
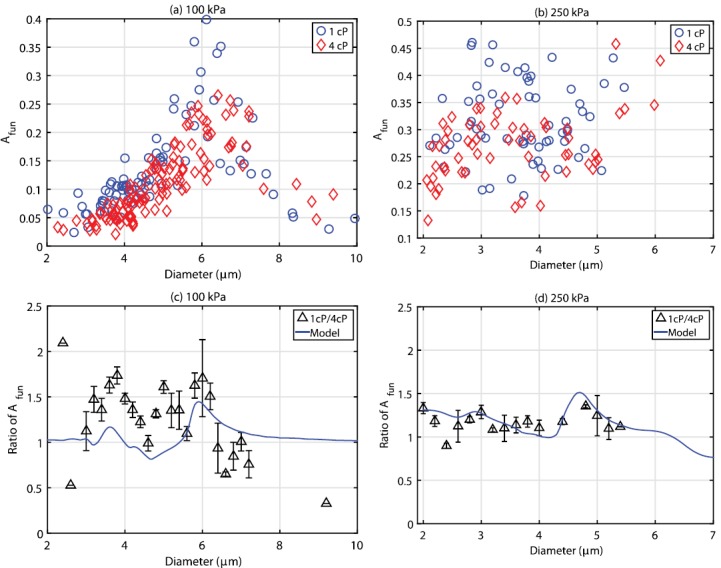
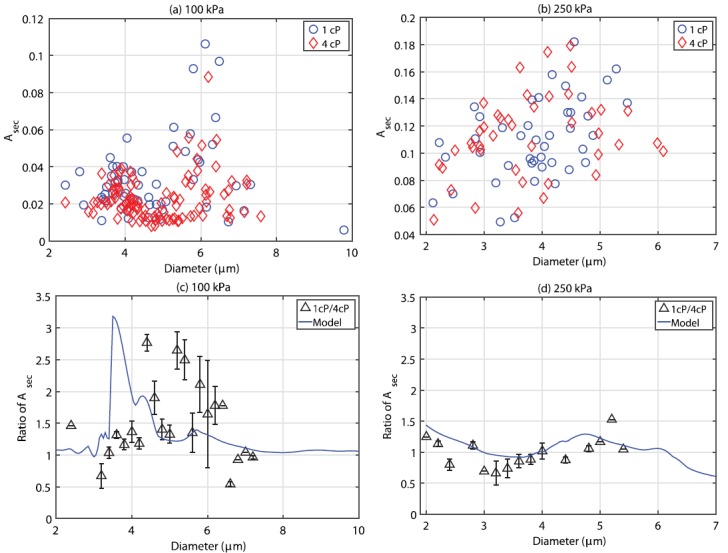
(Color online) A summary of the relative radial oscillation as a function of microbubble diameter for all the microbubbles interrogated at (a) 100 kPa and (b) 250 kPa, in either 1 cP (circles) or 4 cP (triangles) fluid. The bottom two panels depict the relative ratio between in 1 cP fluid to that in 4 cP, overlaid with simulations from Eq. (1), for both (c) 100 kPa and (d) 250 kPa. Note that the microbubble diameters are binned in 0.2 μm intervals, and that the error bars represent the standard deviation of the mean using appropriate error propagation.
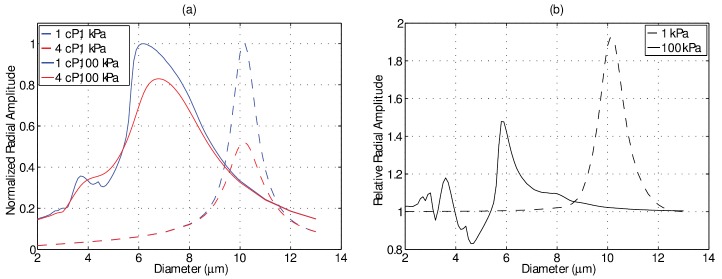
At these transmit pressures, however, there is a size-dependence to the effect of the fluid viscosity. To illustrate this, Fig. 4 depicts the simulated effect of fluid viscosity on microbubble resonance response at a transmit frequency of 1 MHz both in linear (1 kPa) and nonlinear (100 kPa) regimes. The simulation parameters are identical to those indicated for the previous figure. In Fig. 4(a), the amplitude of oscillation as a function of microbubble diameter situated in a 1 and 4 cP fluid is shown. Note that for each pressure the two curves are normalized to that of the response in 1 cP, and therefore the normalization factor is different for the two pressure amplitudes in order to facilitate their comparisons. The low-amplitude, linear resonance diameter at 1 MHz is approximately 10.0 μm in either fluid environment (dashed). The amplitude of oscillation near resonance, however, is approximately a factor of two greater in 1 cP liquid—the effects of the more viscous fluid serving to dampen oscillations and slightly broaden the resonance curve; two well-known effects of linear resonant systems (Landau and Lifshitz, 1969). As the transmit pressure is increased, the resonance response shifts to smaller sized microbubbles and becomes increasingly asymmetric, a property of nonlinear strain-softening systems (Landau and Lifshitz, 1969; Lauterborn, 1974; Overvelde et al., 2010). For the 1 cP fluid environment, the resonance diameter shifts to 6.1 μm, and a second, smaller amplitude peak at 3.7 μm is observed. In a 4 cP fluid, the familiar effects of dampening are present; namely, a decrease in oscillation amplitude and a broadening of the resonance curve. However, in addition the nonlinear strain-softening behavior itself is also attenuated, which results in a larger resonant diameter of 6.8 μm. To further appreciate these effects, Fig. 4(b) depicts the ratio of oscillation amplitude between a given microbubble in 1 cP fluid to that within 4 cP fluid at 1 (dashed) and 100 kPa (solid). As previously stated, in the linear regime the effects of fluid viscosity are most pertinent for resonant sized microbubbles. For the larger pressure amplitude, the effect of fluid viscosity takes on a complex size dependence due to the strain-softening behavior. As compared to 4 cP fluid, microbubbles around their resonant size of 6.1 μm exhibit a 37% increase in oscillation amplitude, while “twice-resonant” microbubbles (3.7 μm) exhibit an increase of 18% in 1 cP fluid. Furthermore, this may result in regimes where the effect of a less viscous host fluid may serve to decrease the oscillation amplitude, as is shown for microbubbles between 4.0 and 5.4 μm.
FIG. 4.
(Color online) (a) Simulated normalized resonance response curves at 1 MHz as a function of bubble diameter in the linear regime (1 kPa; dashed) and nonlinear regime (100 kPa; solid) for bubbles placed with a 1 or 4 cP host fluid. Note that for each pressure the two curves are normalized to that of the response in 1 cP fluid, and therefore the normalization factor is different for the two pressure amplitudes in order to facilitate their comparisons. (b) Relative ratio of the simulated responses in 1 cP to that in 4 cP at 1 kPa (dashed) and 100 kPa (solid).
Figure 5 illustrates two examples of experimentally obtained diameter versus time curves from size-matched individual microbubbles situated in either a 1 (solid) or 4 cP (dashed) fluid at (a) 100 and (b) 250 kPa. It can be seen from this figure that, although the absolute magnitude of individual microbubble response is larger in the simulations (Fig. 3), the relative amplitude difference between these size-matched microbubbles in the two different fluids is in broad agreement. Specifically, an increased fluid viscosity decreased the oscillation amplitude by 19% and 11% for a 6.0 and 4.0 μm bubble insonicated at 100 and 250 kPa, respectively. It can be seen that the microbubble size at the end of the single ultrasound pulse is smaller than its initial resting size due to ultrasound-induced partial gas diffusion—an effect not taken into account for the simulated results in Fig. 3. The relative phase information between two sized-matched microbubbles in either fluid environment cannot be accurately extracted from Fig. 5. Experiments in either fluid were conducted separately, and small differences in focal alignment between experiments (less than a microsecond), while not affecting the peak pressure, render the exact phase of ultrasound in each frame difficult to ascertain. Indeed, a novel cross-correlation technique to do so by employing the bubble as a pressure sensor was recently demonstrated (Shpak et al., 2013), however, this was not attempted in the present study. Figure 6 summarizes the size dependent results for all the microbubbles insonicated at either (a) 100 or (b) 250 kPa in both 1 (circles) and 4 cP (triangles) fluid. At 100 kPa, microbubbles between 2.0 and 9.9 μm (n = 87) and 2.3 and 9.4 μm (n = 117) in diameter were interrogated in 1 and 4 cP fluid, respectively. From panel (a), it can be seen that in either fluid, there exists a clear peak in microbubble response; namely a range of microbubble diameters that are preferentially active. In 1 cP fluid, the peak in response occurred at a diameter of 6.1 μm, exhibiting a maximum relative oscillation amplitude of 0.4, while exhibiting a second, smaller peak at 3.7 μm. In 4 cP fluid, the peak diameter shifts to 6.4 μm and results in a maximum relative amplitude of 0.26, with no secondary peak, in broad agreement with the simulations presented in Fig. 4(a). In comparing the responses between both fluids, the microbubble resonance curve is dampened and broadened in 4 cP fluid as compared to 1 cP. At 250 kPa [Fig. 6(b)], microbubbles between 2.1 and 5.5 μm (n = 64) and 2.1 and 6.1 μm (n = 58) were interrogated in 1 and 4 cP fluid, respectively. Figures 6(c) and 6(d) depict the ratio of relative oscillation amplitude between microbubbles in 1 cP fluid to that of 4 cP fluid, binned in 0.2 μm intervals. The uncertainty at each binned size has been propagated from the standard error of the mean in either fluid medium. At 100 kPa, it can be seen that for bubble diameters between 3 and 6 μm, oscillation amplitudes in 1 cP are larger than in the more viscous, 4 cP fluid, reaching a factor of 1.7 for microbubbles binned at 3.8 μm. For microbubbles larger than 6 μm (resonant size in 1 cP), the oscillation amplitudes can be larger in the 4 cP fluid as compared to bubbles situated in 1 cP fluid. At 250 kPa, microbubbles predominately exhibited a larger amplitude of fundamental oscillation at 1 cP as compared to within 4 cP fluid, exhibiting a maximum relative amplitude of 1.35 at 4.8 μm. Overlaid on these panels are the simulation results by use of Eq. (1). At 100 kPa, the simulation results generally underestimate the effects of the surrounding fluid viscosity, while at 250 kPa are in broad agreement with the experimental data. Figure 7 summarizes the second harmonic response from individual microbubbles in either fluid environment. At 100 kPa, microbubble second harmonic amplitude response in either fluid exhibits peaks at approximately 4 and 6 μm. The effect of viscosity on these responses is overestimated by simulations [Fig. 7(c)], which predict a large increase in amplitude at 3.8 μm in 1 cP fluid as compared to 4 cP fluid. At 250 kPa, the simulation results approach the experimental results. From Fig. 7(d), it can be seen that there are microbubble diameters for which a less viscous environment decreases microbubble second-harmonic amplitude, for example, for microbubbles between 3 and 4 μm.
FIG. 7.
(Color online) A summary of the relative radial oscillation at the second harmonic as a function of microbubble diameter for all the microbubbles interrogated at (a) 100 kPa and (b) 250 kPa, in either 1 cP (circles) or 4 cP (triangles) fluid. The bottom two panels depict the relative ratio between in 1 cP fluid to that in 4 cP, overlaid with simulations from Eq. (1), for both (c) 100 kPa and (d) 250 kPa. Note that the microbubble diameters are binned in 0.2 μm intervals, and that the error bars represent the standard deviation of the mean using appropriate error propagation.
IV. DISCUSSION
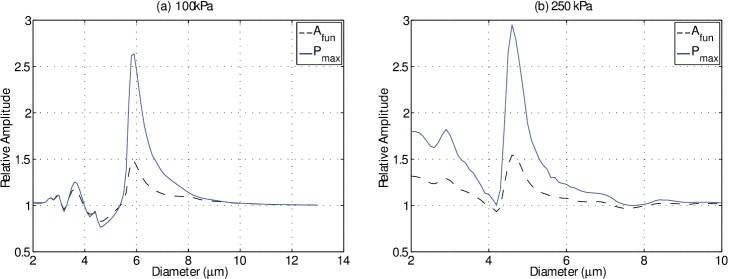
The results presented here indicate that the surrounding fluid viscosity affects phospholipid encapsulated microbubble oscillation response to relatively low acoustic pressures (<250 kPa). While an increase in fluid viscosity primarily serves to dampen microbubble oscillations, this study demonstrates for the first time that the effect has a complex bubble-size dependence due to the resonance and strain-softening nature of an oscillating microbubble. This suggests that measurements from in vitro microbubble optimization studies performed in saline (1 cP) may need to be interpreted judiciously with respect to translation in vivo (4 cP), particularly in vitro investigations of optimal bubble sizes for a given contrast application, contrast imaging quantification, or contrast-specific detection strategies. For example, it can be seen from Figs. 6(c) and 6(d) that the relative amplitude of oscillation of a given microbubble (e.g., 4 μm) at 100 kPa differs from that at 250 kPa; namely, the effect of viscosity on microbubble oscillation amplitude is pressure-dependent for a fixed bubble size. This can be a confounding factor in studies investigating the effectiveness of amplitude modulation imaging schemes in water/saline. For diagnostic contrast imaging applications, it is the scattered emissions from microbubbles that are detected, which are ultimately a function of radial behavior. While the scattered emissions from individual microbubbles were not recorded in the present study, Fig. 8 highlights a simulation result on the effect of fluid viscosity on this metric and compares it to the radial oscillation amplitude, where the scattered pressure due to radial oscillations is estimated from Euler's equation (Helfield and Goertz, 2013; Sijl et al., 2008). This figure depicts the ratio of the maximum pressure in 1 cP to that of 4 cP fluid and overlays the results from Fig. 6(c) and 6(d) for comparison. The magnitude of the effect of fluid viscosity on scattered emissions is greater than or equal to that on the oscillation amplitude for microbubbles in this size range, for both transmit pressures.
FIG. 8.
(Color online) Simulation results using Eq. (1) on the effect of fluid viscosity. The relative fundamental oscillation amplitude at 1 MHz (solid) and relative maximum scattered pressure (dashed) of a microbubble at 1 cP to that situated in 4 cP as a function of microbubble diameter.
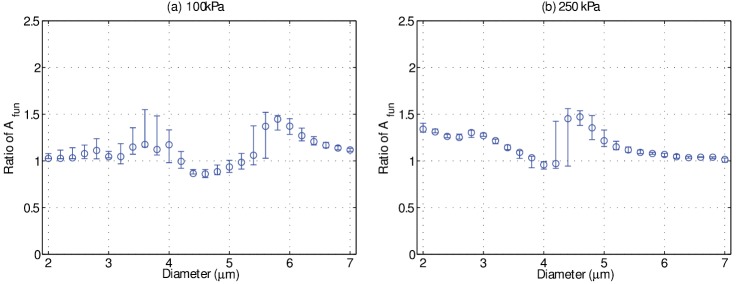
The simulation results presented in Figs. 3 and 4 highlight that the surrounding fluid viscosity affects microbubble oscillation amplitudes, and the experimental results also indicate a significant change in oscillation amplitude for microbubbles situated in 1 cP fluid as compared to 4 cP fluid. Figures 6 and 7 highlight, however, that while the nonlinear microbubble model is in broad agreement with the experiment data at 250 kPa, it deviates from experimental results at 100 kPa. Recent ultra-high speed microscopy studies on individual microbubble response at low acoustic pressure (<50 kPa) have revealed heterogeneity in bubble oscillation amplitude, even among two bubbles of similar size (Overvelde et al., 2010; Sijl et al., 2011). This behavior has been attributed to a radial dependent shell elasticity, namely, due to large gradients in the shell elasticity as a function of bubble size. Specifically, it has been modeled by an initial phospholipid packing density which dictates the critical amount of bubble wall strain (i.e., vibration amplitude) required before the shell elasticity undergoes an abrupt change in value. As mentioned in previous studies, while the exact form of the radius-dependent shell elasticity remains unknown, the Marmottant model [Eq. (1)] was perhaps the first to incorporate such a phenomenon with a view to predicting these nonlinear bubble behaviors. The Marmottant model characterizes this radial-dependent shell elasticity by a small region of elastic behavior, namely, where the normalized radial amplitude remains smaller than , typically around 5% of the initial microbubble size for = 0.8 N/m depending on its initial phospholipid state . As the microbubble oscillates to amplitudes past this threshold, the encapsulating shell properties change and therefore alter its instantaneous vibrational response to a fixed set of ultrasound parameters. Given that the initial phospholipid packing density of a given bubble is unknown (i.e., the value of ), this can lead to differences in oscillation behavior even for bubbles of similar size. With increasing acoustic pressure amplitude, a given microbubble will spend decreasing amounts of time at a radial amplitude less than , and therefore will exhibit behavior that is characterized by shell properties that are increasingly dominated by their values at large radial strains (>). In an attempt to gain insight into this, a one-parameter sensitivity analysis on the simulations results for the ratio of fundamental oscillation amplitudes in both fluid environments is shown in Fig. 9, where the unknown initial phospholipid packing density is varied over commonly employed values in the literature 0 0.04 N/m. In this figure, the median values are denoted by circles, while the range in response is represented by the error bars. It can be seen that the ratio of fundamental amplitudes is more sensitive over a wider range of initial diameters at 100 kPa as compared to 250 kPa, most notably between 3 and 4 μm. This suggests that the model disagreement at 100 kPa is in part related to the uncertainty in shell material characterization, and in particular that this uncertainty has a greater effect at lower acoustic pressure amplitudes. It is also important to note that rheological behaviors exhibited by the encapsulation material pertaining to an effective shell viscosity (e.g., shear-thinning) are not accounted for in the Marmottant model (i.e., this model assumes a constant shell viscosity value). Indeed, recent studies have demonstrated that the lipid encapsulation of both microbubbles and echogenic liposomes may be characterised by a shear-thinning viscosity (Helfield and Goertz, 2013; van der Meer et al., 2007; Raymond et al., 2015; van Rooij et al., 2015; Tu et al., 2011). Indeed, investigation of microbubble encapsulation rheology is currently an active field of research (Hosny et al., 2013; Owen and Stride, 2015).
FIG. 9.
(Color online) A one-parameter sensitivity analysis on the simulation results predicting the relative ratio between in 1 cP fluid to that in 4 cP fluid, by way of Eq. (1), at (a) 100 kPa and (b) 250 kPa. The simulation parameters for the encapsulating shell were = 0.8 N/m, = 3 × 10⁻⁹ kg/s, and 0 0.04 N/m. The circles denote median values, while the maximum and minimum values (i.e., range) are represented by the error bars.
V. LIMITATIONS
In this study, individual phospholipid encapsulated microbubbles were diluted in either 1 or 4 cP fluid and insonicated at 1 MHz. A comparison of the effect of fluid viscosity on individual microbubble behavior was therefore conducted by first obtaining the oscillation amplitude as a function of microbubble size in each fluid environment, i.e., by constructing a pseudo resonance curve at a fixed frequency. As a consequence, binning of the microbubble sizes was necessary in order to compare the size-dependent response between the two fluid environments. The uncertainty, therefore, of the ratio of responses near resonance [see Fig. 6(c), for example] will be inherently larger than off-resonant sizes due to averaging errors. Furthermore, given that it has been established that similarly-sized phospholipid encapsulated microbubbles may elicit different responses to the same ultrasonic stimulus, another approach is to conduct a microbubble spectroscopy experiment on one and the same microbubble in both fluid environments. While a spectroscopic approach to constructing a microbubble resonance curve in a given fluid environment has been previously shown possible (van der Meer et al., 2007), it remains an experimental challenge to interrogate the same microbubble in two different fluid environments.
The average apparent viscosity of blood in arterioles and venules is approximately 4 cP (Papaioannou and Stefanadis, 2005; Rosenson et al., 1996). As previously noted, the blood pool consists of deformable erythrocytes which can conceivably alter the local viscoelastic properties of the surround fluid environment. Previous theoretical work on the investigation of the radial oscillations of individual un-encapsulated (Allen and Roy, 2000a,b) and encapsulated microbubbles (Khismatullin and Nadim, 2002) in generalized non-Newtonian fluid has been performed. Specifically, microbubble behavior in the presence of erythrocytes has been investigated, both in terms of individual microbubble modeling and frequency-dependent acoustic attenuation experiments on microbubble populations (Raymond et al., 2014; Stride and Saffari, 2004). These studies concluded that microbubble behavior is not significantly altered by the presence of erythrocytes. However, a more rigorous, experimental investigation on an individual microbubble basis has yet to be conducted.
The microbubbles analysed in this study were adjacent to an OpticellTM (polystyrene) layer, approximately 75 μm in thickness. Microbubble behavior may be affected by the presence of boundaries, and in particular, previous experiments using an OpticellTM have shown that microbubble oscillation amplitude decreases as the microbubble approaches the OpticellTM boundary (Garbin et al., 2007; Overvelde, 2010). This may explain the reason for which the simulations (which assume a bubble in free space) generally predict larger absolute amplitudes than the experimental data indicate (see, for example, Figs. 3 and 5). An acknowledged limitation of the present study is the fact that the boundary effects themselves may be a function of fluid viscosity. In the limiting case of a rigid boundary, a bubble-boundary system can be modeled through the method of images (Leighton, 1994). The “real” microbubble radial response is therefore altered by the scattered emissions from the “image” bubble, and these scattered emissions are itself a function of fluid viscosity (Euler's equation coupled with a Rayleigh-Plesset equation). The extent to which the observed differences in microbubble behavior within 1 and 4 cP are due to fluid viscosity-dependent microbubble behavior [i.e., differences in fluid viscosity-based pressures at the bubble wall present in Eq. (1)] versus due to fluid viscosity-dependent boundary effects (i.e., differences originating from the scattered emissions from an image bubble) remains unclear.
VI. CONCLUDING REMARKS
This study conducts the first experimental demonstration of the effects of fluid viscosity on phospholipid encapsulated microbubble oscillation dynamics. Ultra-high frame rate recordings of individual microbubbles situated in either 1 or 4 cP fluid revealed that microbubble oscillation amplitude is affected by fluid viscosity in a size-dependent and transmit pressure dependent manner. Specifically, at 250 kPa experimental results are in agreement with theoretical predictions using a well-accepted nonlinear encapsulated microbubble model; however, the data indicate a larger effect of fluid viscosity at 100 kPa than predicted by simulations.
ACKNOWLEDGMENTS
This work was partly funded by the National Institutes of Health (Grant No. R01EB016516-01A1), the Fonds de Recherche Natures et Technologies postdoctoral grant from Quebec, Canada, and the Center for Ultrasound Molecular Imaging and Therapeutics, Heart and Vascular Medicine Institute, University of Pittsburgh, Pittsburgh, PA.
References
- 1. Allen, J. S. , and Roy, R. A. (2000a). “ Dynamics of gas bubbles in viscoelastic fluids I: Linear viscoelasticity,” J. Acoust. Soc. Am. 107, 3167–3178. 10.1121/1.429344 [DOI] [PubMed] [Google Scholar]
- 2. Allen, J. S. , and Roy, R. A. (2000b). “ Dynamics of gas bubbles in viscoelastic fluids II: Nonlinear viscoelasticity,” J. Acoust. Soc. Am. 108, 1640–1650. 10.1121/1.1289361 [DOI] [PubMed] [Google Scholar]
- 3. Allen, J. S. , Roy, R. A. , and Church, C. C. (1997). “ On the role of shear viscosity in mediating inertial cavitation from short-pulse, megahertz-frequency ultrasound,” IEEE Trans. Ultrason. Ferroelectr. Freq. Control 44, 743–751. 10.1109/58.655189 [DOI] [Google Scholar]
- 4. Bolten, D. , and Turk, M. (2011). “ Experimental study on the surface tension, density, and viscosity of aqueous poly(vinylpyrrolidone) solutions,” J. Chem. Eng. Data 56, 582–588. 10.1021/je101277c [DOI] [Google Scholar]
- 5. Brock-Fisher, G. A. , Poland, M. D. , and Rafter, P. G. (1996). “ Means for increasing sensitivity in non-linear ultrasound imaging systems,” Report No. US5577505 A.
- 6. Burns, P. N. , Wilson, S. R. , and Simpson, D. H. (2000). “ Pulse inversion imaging of liver blood flow: Improved method for characterizing focal masses with microbubble contrast,” Invest. Radiol. 35, 58–71. 10.1097/00004424-200001000-00007 [DOI] [PubMed] [Google Scholar]
- 7. Chen, X. , Wang, J. , Versluis, M. , de Jong, N. , and Villanueva, F. S. (2013). “ Ultra-fast bright field and fluorescence imaging of the dynamics of micrometer-sized objects,” Rev. Sci. Instrum. 84, 063701. 10.1063/1.4809168 [DOI] [PMC free article] [PubMed] [Google Scholar]
- 8. Church, C. (1995). “ The effects of an elastic solid surface layer on the radial pulsations of gas bubbles,” J. Acoust. Soc. Am. 97, 1510–1521. 10.1121/1.412091 [DOI] [Google Scholar]
- 9. de Jong, N. , Cornet, R. , and Lancée, C. T. (1994). “ Higher harmonics of vibrating gas-filled microspheres. Part one: Simulations,” Ultrasonics 32, 447–453. 10.1016/0041-624X(94)90064-7 [DOI] [Google Scholar]
- 10. de Jong, N. , Emmer, M. , Chin, C. T. , Bouakaz, A. , Mastik, F. , Lohse, D. , and Versluis, M. (2007). “ ‘Compression-only’ behavior of phospholipid-coated contrast bubbles,” Ultrasound Med. Biol. 33, 653–656. 10.1016/j.ultrasmedbio.2006.09.016 [DOI] [PubMed] [Google Scholar]
- 11. de Jong, N. , Hoff, L. , Skotland, T. , and Bom, N. (1992). “ Absorption and scatter of encapsulated gas filled microspheres: Theoretical considerations and some measurements,” Ultrasonics 30, 95–103. 10.1016/0041-624X(92)90041-J [DOI] [PubMed] [Google Scholar]
- 12. Deng, C. , Apfel, R. E. , and Holland, C. K. (1996). “ Inertial cavitation produced by pulsed ultrasound in controlled host media,” J. Acoust. Soc. Am. 100, 1199–1208. 10.1121/1.416304 [DOI] [PubMed] [Google Scholar]
- 13. Doinikov, A. A. , Aired, L. , and Bouakaz, A. (2011). “ Acoustic scattering from a contrast agent microbubble near an elastic wall of finite thickness,” Phys. Med. Biol. 56, 6951–6967. 10.1088/0031-9155/56/21/012 [DOI] [PubMed] [Google Scholar]
- 14. Frinking, P. J. A. , de Jong, N. , and Cespedes, E. I. (1999). “ Scattering properties of encapsulated gas bubbles at high ultrasound pressures,” J. Acoust. Soc. Am. 105, 1989–1996. 10.1121/1.426732 [DOI] [Google Scholar]
- 15. Garbin, V. , Cojoc, D. , Ferrari, E. , Di Fabrizio, E. , Overvelde, M. L. J. , van der Meer, S. M. , de Jong, N. , Lohse, D. , and Versluis, M. (2007). “ Changes in microbubble dynamics near a boundary revealed by combined optical micromanipulation and high-speed imaging,” Appl. Phys. Lett. 90, 114103. 10.1063/1.2713164 [DOI] [Google Scholar]
- 16. Goertz, D. E. , de Jong, N. , and van der Steen, A. F. W. (2007). “ Attenuation and size distribution measurements of DefinityTM and manipulated DefinityTM populations,” Ultrasound Med. Biol. 33, 1376–1388. 10.1016/j.ultrasmedbio.2007.03.009 [DOI] [PubMed] [Google Scholar]
- 17. Helfield, B. L. , Black, J. J. , Qin, B. , Pacella, J. , Chen, X. , and Villanueva, F. S. (2015). “ Fluid viscosity affects the fragmentation and inertial cavitation threshold of lipid encapsulated microbubbles,” Ultrasound Med. Biol., in press. 10.1016/j.ultrasmedbio.2015.10.023 [DOI] [PMC free article] [PubMed] [Google Scholar]
- 18. Helfield, B. L. , and Goertz, D. E. (2013). “ Nonlinear resonance behavior and linear shell estimates for DefinityTM and MicroMarkerTM assessed with acoustic microbubble spectroscopy,” J. Acoust. Soc. Am. 133, 1158–1168. 10.1121/1.4774379 [DOI] [PubMed] [Google Scholar]
- 20. Helfield, B. L. , Leung, B. Y. C. , and Goertz, D. E. (2014b). “ The effect of boundary proximity on the response of individual ultrasound contrast agent microbubbles,” Phys. Med. Biol. 59, 1721–1745. 10.1088/0031-9155/59/7/1721 [DOI] [PubMed] [Google Scholar]
- 21. Helfield, B. L. , Leung, B. Y. C. , and Goertz, D. E. (2014c). “ The influence of compliant boundary proximity on the fundamental and subharmonic emissions from individual microbubbles,” J. Acoust. Soc. Am. 136, EL40–EL46. 10.1121/1.4885544 [DOI] [PubMed] [Google Scholar]
- 19. Helfield, B. L. , Leung, B. Y. C. , Huo, X. , and Goertz, D. E. (2014a). “ Scaling of the viscoelastic shell properties of phospholipid encapsulated microbubbles with ultrasound frequency,” Ultrasonics 54, 1419–1424. 10.1016/j.ultras.2014.03.014 [DOI] [PubMed] [Google Scholar]
- 22. Hoff, L. , Sontum, P. , and Hovem, J. (2000). “ Oscillations of polymeric microbubbles: Effect of the encapsulating shell,” J. Acoust. Soc. Am. 107, 2272–2280. 10.1121/1.428557 [DOI] [PubMed] [Google Scholar]
- 23. Hosny, N. A. , Mohamedi, G. , Rademeyer, P. , Owen, J. , Wu, Y. , Tang, M.-X. , Eckersley, R. J. , Stride, E. , and Kuimova, M. K. (2013). “ Mapping microbubble viscosity using fluorescence lifetime imaging of molecular rotors,” Proc. Natl. Acad. Sci. U.S.A. 110, 9225–9230. 10.1073/pnas.1301479110 [DOI] [PMC free article] [PubMed] [Google Scholar]
- 24. Khismatullin, D. B. , and Nadim, A. (2002). “ Radial oscillations of encapsulated microbubbles in viscoelastic liquids,” Phys. Fluids 14, 3534–3557. 10.1063/1.1503353 [DOI] [Google Scholar]
- 25. Landau, L. D. , and Lifshitz, E. M. (1969). Couse of Theoretical Physics, Volume 1: Mechanics, 2nd ed. ( Pergamon, Oxford, UK: ). [Google Scholar]
- 26. Lauterborn, W. (1974). “ Numerical investigation of nonlinear oscillations of gas bubbles in liquids,” J. Acoust. Soc. Am. 59, 283–293. 10.1121/1.380884 [DOI] [Google Scholar]
- 27. Leighton, T. G. (1994). The Acoustic Bubble ( Academic, San Diego: ). [Google Scholar]
- 28. Marmottant, P. , van der Meer, S. , Emmer, M. , Versluis, M. , de Jong, N. , Hilgenfeldt, S. , and Lohse, D. (2005). “ A model for large amplitude oscillations of coated bubbles accounting for buckling and rupture,” J. Acoust. Soc. Am. 118, 3499–3505. 10.1121/1.2109427 [DOI] [Google Scholar]
- 29. Medwin, H. (1977). “ Counting bubbles acoustically: A review,” Ultrasonics 15, 7–13. 10.1016/0041-624X(77)90005-1 [DOI] [Google Scholar]
- 30. Mulvagh, S. L. , Rakowski, H. , Vannan, M. A. , Abdelmoneim, S. S. , Becher, H. , Bierig, S. M. , Burns, P. N. , Castello, R. , Coon, P. D. , Hagen, M. E. , Jollis, J. G. , Kimball, T. R. , Kitzman, D. W. , Kronzon, I. , Labovitz, A. J. , Lang, R. M. , Mathew, J. , Moir, S. W. , Nagueh, S. F. , Pearlman, A. S. , Perez, J. E. , Porter, T. R. , Rosenbloom, J. , Strachan, G. M. , Thanigaraj, S. , Wei, K. , Woo, A. , Yu, E. H. C. , and Zoghbi, W. A. (2008). “ American Society of Echocardiography Consensus Statement on the Clinical Applications of Ultrasonic Contrast Agents in Echocardiography,” J. Am. Soc. Echocardiogr. 21, 1179–1201. 10.1016/j.echo.2008.09.009 [DOI] [PubMed] [Google Scholar]
- 31. Mulvana, H. , Stride, E. , Tang, M. , Hajnal, J. V. , and Eckersley, R. (2011). “ Temperature-dependent differences in the nonlinear acoustic behavior of ultrasound contrast agents revealed by high-speed imaging and bulk acoustics,” Ultrasound Med. Biol. 37, 1509–1517. 10.1016/j.ultrasmedbio.2011.05.020 [DOI] [PubMed] [Google Scholar]
- 32. Overvelde, M. (2010). “ Ultrasound Contrast Agents,” Ph.D. thesis, University of Twente, Enschede, The Netherlands. [Google Scholar]
- 33. Overvelde, M. , Garbin, V. , Sijl, J. , Dollet, B. , de Jong, N. , Lohse, D. , and Versluis, M. (2010). “ Nonlinear shell behavior of phospholipid-coated microbubbles,” Ultrasound Med. Biol. 36, 2080–2092. 10.1016/j.ultrasmedbio.2010.08.015 [DOI] [PubMed] [Google Scholar]
- 34. Owen, J. , and Stride, E. (2015). “ Technique for the characterization of phospholipid microbubbles coatings by transmission electron microscopy,” Ultrasound Med. Biol. 41, 3253–3258. 10.1016/j.ultrasmedbio.2015.07.024 [DOI] [PubMed] [Google Scholar]
- 35. Papaioannou, T. G. , and Stefanadis, C. (2005). “ Vascular wall shear stress: Basic principles and methods,” Hell. J. Caridology 46, 9–15. [PubMed] [Google Scholar]
- 36. Porter, T. R. , and Xie, F. (2010). “ Myocardial perfusion imaging with contrast ultrasound,” J. Am. Coll. Cardiol. 3, 176–187. 10.1016/j.jcmg.2009.09.024 [DOI] [PubMed] [Google Scholar]
- 37. Prosperetti, A. (2013). “ A general derivation of the subharmonic threshold for non-linear bubble oscillations,” J. Acoust. Soc. Am. 133, 3719–3726. 10.1121/1.4802742 [DOI] [PubMed] [Google Scholar]
- 38. Raymond, J. L. , Haworth, K. J. , Bader, K. B. , Radhakrishnan, K. , Griffin, J. K. , Huang, S.-L. , McPherson, D. D. , and Holland, C. K. (2014). “ Broadband attenuation measurements of phospholipid-shelled ultrasound contrast agents,” Ultrasound Med. Biol. 40, 410–421. 10.1016/j.ultrasmedbio.2013.09.018 [DOI] [PMC free article] [PubMed] [Google Scholar]
- 39. Raymond, J. L. , Luan, Y. , van Rooij, T. , Kooiman, K. , Versluis, M. , and Holland, C. K. (2015). “ Impulse response method for characterization of echogenic liposomes,” J. Acoust. Soc. Am. 137, 1693–1703. 10.1121/1.4916277 [DOI] [PMC free article] [PubMed] [Google Scholar]
- 40. Rosenson, R. S. , McCormick, A. , and Uretz, E. F. (1996). “ Distribution of blood viscosity values and biochemical correlates in healthy adults,” Clin. Chem. 42, 1189–1195. [PubMed] [Google Scholar]
- 41. Sarkar, K. , Shi, W. T. , Chatterjee, D. , and Forsberg, F. (2005). “ Characterization of ultrasound contrast microbubbles using in vitro experiments and viscous and viscoelastic interface models for encapsulation,” J. Acoust. Soc. Am. 118, 539–550. 10.1121/1.1923367 [DOI] [PubMed] [Google Scholar]
- 42. Shankar, P. M. , Dala Krishna, P. , and Newhouse, V. L. (1998). “ Advantages of subharmonic over second harmonic backscatter for contrast-to-tissue echo enhancement,” Ultrasound Med. Biol. 24, 395–399. 10.1016/S0301-5629(97)00262-7 [DOI] [PubMed] [Google Scholar]
- 43. Shpak, O. , Kokhuis, T. J. A. , Luan, Y. , Lohse, D. , de Jong, N. , Fowlkes, B. , Fabiilli, M. , and Versluis, M. (2013). “ Ultrafast dynamics of the acoustic vaporization of phase-change microdroplets,” J. Acoust. Soc. Am. 134, 1610–1621. 10.1121/1.4812882 [DOI] [PubMed] [Google Scholar]
- 44. Shutilov, V. A. (1988). Fundamental Physics of Ultrasound ( Gordon and Breach, Amsterdam: ). [Google Scholar]
- 45. Sijl, J. , Gaud, E. , Frinking, P. J. A. , Arditi, M. , de Jong, N. , Lohse, D. , and Versluis, M. (2008). “ Acoustic characterization of single ultrasound contrast agent microbubbles,” J. Acoust. Soc. Am. 124, 4091–4097. 10.1121/1.2997437 [DOI] [PubMed] [Google Scholar]
- 46. Sijl, J. , Overvelde, M. , Dollet, B. , Garbin, V. , de Jong, N. , Lohse, D. , and Versluis, M. (2011). “ ‘Compression-only’ behavior: A second-order nonlinear response of ultrasound contrast agent microbubbles,” J. Acoust. Soc. Am. 129, 1729–1739. 10.1121/1.3505116 [DOI] [PubMed] [Google Scholar]
- 47. Sprague, M. R. , Chérin, E. , Goertz, D. E. , and Foster, F. S. (2010). “ Nonlinear emission from individual bound microbubbles at high frequencies,” Ultrasound Med. Biol. 36, 313–324. 10.1016/j.ultrasmedbio.2009.08.010 [DOI] [PubMed] [Google Scholar]
- 48. Stride, E. , and Saffari, N. (2004). “ Theoretical and experimental investigation on the behaviour of ultrasound contrast agent particles in whole blood,” Ultrasound Med. Biol. 30, 1495–1509. 10.1016/j.ultrasmedbio.2004.09.003 [DOI] [PubMed] [Google Scholar]
- 49. Tanasawa, I. , and Yang, W.-J. (1970). “ Dynamic behavior of a gas bubble in viscoelastic liquids,” J. Appl. Phys. 41, 4526–4531. 10.1063/1.1658491 [DOI] [Google Scholar]
- 50. Thomas, D. H. , Butler, M. , Anderson, T. , Emmer, M. , Vos, H. , Borden, M. , Stride, E. , de Jong, N. , and Sboros, V. (2012). “ The ‘quasi-stable’ lipid shelled microbubble in response to consecutive ultrasound pulses,” Appl. Phys. Lett. 101, 071601. 10.1063/1.4746258 [DOI] [Google Scholar]
- 51. Tu, J. , Swalwell, J. E. , Giraud, D. , Cui, W. , Chen, W. , and Matula, T. J. (2011). “ Microbubble sizing and shell characterization using flow cytometry,” IEEE Trans. Ultrason. Ferroelectr. Freq. Control 58, 955–963. 10.1109/TUFFC.2011.1896 [DOI] [PMC free article] [PubMed] [Google Scholar]
- 52. van der Meer, S. M. , Dollet, B. , Voormolen, M. M. , Chin, C. T. , Bouakaz, A. , de Jong, N. , Versluis, M. , and Lohse, D. (2007). “ Microbubble spectroscopy of ultrasound contrast agents,” J. Acoust. Soc. Am. 121, 648–656. 10.1121/1.2390673 [DOI] [PubMed] [Google Scholar]
- 53. van Rooij, T. , Luan, Y. , Renaud, G. , van der Steen, A. F. W. , Versluis, M. , de Jong, N. , and Kooiman, K. (2015). “ Non-linear response and viscoelastic properties of lipid-coated microbubbles: DSPC versus DPPC,” Ultrasound Med. Biol. 41, 1432–1445. 10.1016/j.ultrasmedbio.2015.01.004 [DOI] [PubMed] [Google Scholar]
- 54. Vos, H. J. , Emmer, M. , and de Jong, N. (2008). “ Oscillation of single microbubbles at room versus body temperature,” in Proceedings of the IEEE Ultrasonics Symposium, pp. 982–984. [Google Scholar]
- 55. Walker, A. , Naylor, G. P. , and Humphries, W. V. (1976). “ Measurement of blood viscosity using a conicylindrical viscometer,” Med. Biol. Eng. 14, 551–557. 10.1007/BF02478056 [DOI] [PubMed] [Google Scholar]
- 56. Wei, K. , Le, E. , Bin, J. P. , Coggins, M. , Thorpe, J. , and Kaul, S. (2001). “ Quantification of renal blood flow with contrast-enhanced ultrasound,” J. Am. Coll. Cardiol. 37, 1135–1140. 10.1016/S0735-1097(00)01210-9 [DOI] [PubMed] [Google Scholar]
- 57. Weller, G. E. R. , Villanueva, F. S. , Klibanov, A. L. , and Wagner, W. R. (2002). “ Modulating targeted adhesion of an ultrasound contrast agent to dysfunctional endothelium,” Ann. Biomed. Eng. 30, 1012–1019. 10.1114/1.1513565 [DOI] [PubMed] [Google Scholar]
- 58. Yeh, J. S. , Sennoga, C. A. , McConnell, E. , Eckersley, R. , Tang, M. X. , Nourshargh, S. , Seddon, J. M. , Haskard, D. O. , and Nihoyannopoulos, P. (2015). “ A targeting microbubble for ultrasound molecular imaging,” PLoS One 10, 1–23. 10.1371/journal.pone.0129681 [DOI] [PMC free article] [PubMed] [Google Scholar]


