Abstract
Purpose:
Proton computed tomography (pCT) will enable accurate prediction of proton and ion range in a patient while providing the benefit of lower radiation exposure than in x-ray CT. The accuracy of the range prediction is essential for treatment planning in proton or ion therapy and depends upon the detector used to evaluate the water-equivalent path length (WEPL) of a proton passing through the object. A novel approach is presented for an inexpensive WEPL detector for pCT and proton radiography.
Methods:
A novel multistage detector with an aperture of 10 × 37.5 cm was designed to optimize the accuracy of the WEPL measurements while simplifying detector construction and the performance requirements of its components. The design of the five-stage detector was optimized through simulations based on the geant4 detector simulation toolkit, and the fabricated prototype was calibrated in water-equivalent millimeters with 200 MeV protons in the research beam line of the clinical proton synchrotron at Loma Linda University Medical Center. A special polystyrene step phantom was designed and built to speed up and simplify the calibration procedure. The calibrated five-stage detector was tested in the 200 MeV proton beam as part of the pCT head scanner, using a water phantom and polystyrene slabs to verify the WEPL reconstruction accuracy.
Results:
The beam-test results demonstrated excellent performance of the new detector, in good agreement with the simulation results. The WEPL measurement accuracy is about 3.0 mm per proton in the 0–260 mm WEPL range required for a pCT head scan with a 200 MeV proton beam.
Conclusions:
The new multistage design approach to WEPL measurements for proton CT and radiography has been prototyped and tested. The test results show that the design is competitive with much more expensive calorimeter and range-counter designs.
Keywords: proton computed tomography, proton radiography, proton therapy, WEPL, proton energy detector, proton range measurement
1. INTRODUCTION
Low-dose proton radiography and proton computed tomography (pCT) are currently being explored as techniques to improve the accuracy of proton treatment planning and to provide artifact-free images for verification and adaptive therapy at the time of treatment.1 The advantage of this approach is that it avoids the need to convert CT numbers of x-ray based CT scanners to relative stopping power values. Currently, x-ray CT is used for proton treatment planning and also starts to be used for in-room verification with cone beam CT.
The authors’ approach to proton radiography and pCT is based on measurements of water-equivalent path length (WEPL, symbol W be used throughout this text) of individual protons crossing the object from many directions (from 0 to 2π for a pCT scan or orthogonal directions for radiography).2 The WEPL can be expressed as a line integral of relative stopping power along proton path L through the object,
| (1) |
where the relative stopping power is a ratio of actual proton stopping power S at the distance l on the path L to that of water at the same proton energy E,
| (2) |
By collecting a large number of individual proton histories (WEPL plus track information), one can produce a 2D projection of W values or reconstruct a 3D distribution of relative stopping power ρs using an appropriate pCT reconstruction technique.3 In order to produce clinically useful CT images, one needs to accumulate on the order of 100 proton histories1 in voxels of 1 mm3. Assuming that a human head contains about 2 × 10⁶ such voxels, this requires collection of about 200 × 106 proton histories in a clinically acceptable time of 5 min or less, which corresponds to data acquisition (DAQ) rates of the order of at least 1 × 10⁶ histories per second. This defines one of the key requirements of the pCT scanner performance: the detectors comprising a pCT system should be able to handle at least 1 × 10⁶ protons/s. A second key requirement concerns the detector size, which should be about 30 cm in the lateral dimension for a head scanner. Larger sizes will be required for body scans. These two key requirements make plastic scintillation detectors a good choice for proton WEPL measurements.
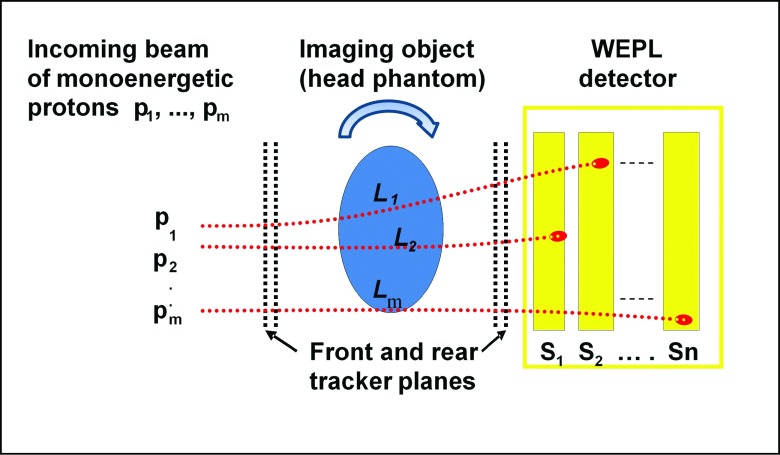
The general design scheme for a pCT scanner consisting of upstream and downstream proton tracking detectors and a detector for WEPL measurements is sketched in Fig. 1. The WEPL detector is shown as a multistage system consisting of n consecutive scintillation detectors (stages) S1, S2, …, Sn of water-equivalent thicknesses Si and with integral thickness large enough to stop all protons crossing (or passing) the object being imaged. In the case of an incoming monoenergetic proton beam with total range in water Rtot, defined as the integral over the inverse stopping power between zero and initial energy in the continuous slowdown approximation (CSDA) of energy loss, the WEPL of a proton passing through an object is determined according to
| (3) |
where S0 is the water-equivalent thickness of all materials along the path of the proton leading up to the WEPL detector, excluding the object being imaged, and R is the water-equivalent range of the proton in the WEPL detector. In the remainder of this publication, range will always be understood to be defined as the CSDA range.
FIG. 1.
Schematic depiction of WEPL measurements in proton radiography or computed tomography.
In Ref. 2, the performance of a first prototype pCT scanner (phase I) constructed by the authors was described, which used a CsI(Tl) crystal array calorimeter (n = 1) as the WEPL detector. While phase I pCT scanner achieved a reasonable imaging performance, the calorimeter did not meet the high data-rate requirement discussed above. It was also observed that the calorimeter WEPL measurement uncertainty distinctly depended on the imaging object thickness, and was nonuniform over the detector sensitive area, peaking at the edges of the CsI crystals composing the calorimeter, which resulted in some artifacts in the reconstructed images. Here, the authors describe a novel approach to design a fast multistage detectors optimized for WEPL measurements, corresponding to the new multistage detector employed in the present pCT scanner prototype (phase II), which utilizes fast plastic scintillators, provides uniform and practically WEPL-independent resolution, and has demonstrated data acquisition rates exceeding 1 × 10⁶ proton histories per second.
The remainder of this paper is organized as follows: Sec. 2.A presents the formalism of the theoretical uncertainty of different WEPL detector designs. Section 2.B describes phase II proton CT scanner design, the detailed design of the new multistage WEPL detector, and its data readout. Section 2.C describes the details of the experimental studies, and Sec. 2.D describes details of the geant4 Monte Carlo simulation studies that were done in parallel. Section 2.E details the correction of the detector response for light collection nonuniformity and describes the calibration procedure performed to convert the detector response to WEPL. Section 3.A presents and discusses results on the detector intrinsic resolution and stability. Section 3.B presents and discusses the WEPL resolution results obtained with the new detector and compares them to the results from Monte Carlo simulations. Section 4 contains the conclusions from this work.
2. METHODS AND MATERIALS
2.A. WEPL uncertainty of different detector designs
In phase I design of the pCT scanner, where the WEPL detector consisted of only one stage (n = 1; CsI crystal calorimeter), the WEPL was evaluated by measuring the energy E deposited by the proton in the detector and converting it to the residual proton range R, for example, by applying the well-known Bragg-Kleeman rule: R = AEp, where A and p are empirical parameters obtained by fitting to experimental data.4 The principal uncertainty of the WEPL measurement by such a detector is defined by the inherent range uncertainty caused by range straggling along the proton path to the detector and the accuracy of the evaluation of the proton residual range R via the energy measurement. The range straggling σS (defined as the standard deviation of a Gaussian fit to the range distribution) is approximately 1.1% of the proton range.5
In this case, the range leading up to the calorimeter is W + S0; hence, . The accuracy of the residual proton range evaluation by the power-law relationship of the Bragg–Kleeman rule is , where δE ≡ σE/E is the intrinsic energy resolution of the calorimeter, and the parameter p was determined to be 1.8 for a polystyrene-based scintillating detector as obtained by fitting to energy-range data from the NIST PSTAR database (http://physics.nist.gov/PhysRefData/Star/Text/PSTAR.html). Assuming that the range straggling along the path leading up to the calorimeter is not correlated with the fluctuations in the energy measurement by the calorimeter, the total WEPL measurement uncertainty made by means of a calorimeter can be expressed as the following function of the WEPL:
| (4) |
Equation (4) indicates that to achieve performance close to the theoretical limit of range straggling, a calorimeter WEPL detector should provide an energy resolution better than 1% from a few tens of MeV to a few hundreds of MeV, a performance level that is not easy to achieve, especially with a fast detector.6
An alternative approach to measuring WEPL is to build a detector with a large number of stages of a few mm in thickness (n ≫ 10, i.e., a true range counter), as described, e.g., in Refs. 7 and 8. Assuming only small scattering angles within the material, the range R is approximately defined by the center position of the stage i where the last energy deposition is detected, in which case Eq. (1) becomes
| (5) |
In this case, the uncertainty of the WEPL measurement is determined by the range straggling along the entire proton path to the stage Si, which is approximately equal to σS ≈ 0.011 × Rtot (assuming Si ≪ Rtot) together with the accuracy of approximating the residual proton range inside the last stage by Si/2, which is assuming a uniform distribution of the residual proton range in the stage. Then, the total WEPL measurement uncertainty is independent of WEPL and is approximately equal to
| (6) |
One can see that in order to get the WEPL measurement accuracy close to the range straggling limit σW ≈ σS, the plastic scintillating detector thicknesses (including wrapping) of the range detector stages should not exceed about 1.5% of the total proton range (∼4 mm for 200 MeV protons). In practice, this means the number of stages in the range detector should be between 60 and 100.
The multistage WEPL detector design, the subject of this paper, is a combination of both energy and range detector concepts. It consists of a relatively small number of stages (n = 5 in this work), and therefore its response is defined by both the position of the stage Si in which the proton stops and the total energy Ei deposited in that stage. Similar to the single-stage calorimetric approach, the energy deposited in the final stage can be converted to the residual range of the proton Ri in the stopping stage. By the Bragg–Kleeman rule, assuming an incoming monoenergetic parallel proton beam and small scattering angles of the protons, the WEPL is
| (7) |
Here, the uncertainty in W is due to the range straggling of the proton in material leading up to the final stage Si together with the uncertainty in the proton residual range in the final stage ,
| (8) |
where δE is the resolution of the measurement of the energy deposition in the final stage.
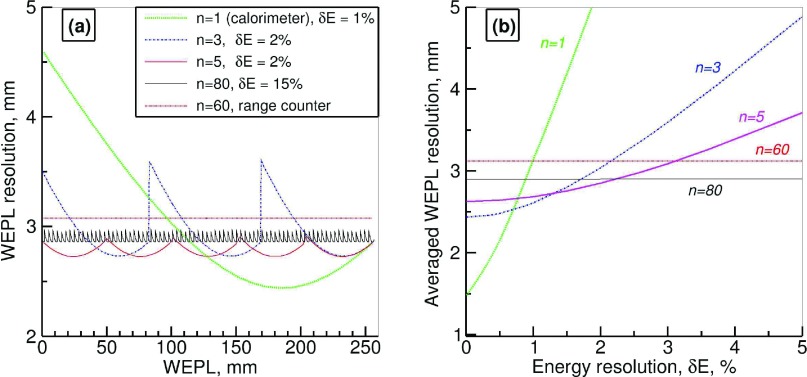
At this point, it is useful to compare the WEPL resolutions of the three approaches given by approximate Eqs. (4), (6), and (8): Fig. 2(a) shows the estimated WEPL resolution as a function of WEPL of the imaged object, and Fig. 2(b) shows its dependence on the energy measurement uncertainty δE for the detectors with different number of identical stages—a single-stage calorimeter with δE ≅ 1% resolution,6 range counter with 60 plates of 4 mm thickness,7 and multistage detectors with three,6 five (this work), and eighty stages.9 The protons are assumed to have a kinetic energy of 200 MeV, such that Rtot ≅ 260 mm. The detector material is polystyrene (p ≅ 1.8), and the constant thickness of the material in front of the detector but excluding the object being imaged is S0 = 4 mm.
FIG. 2.
(a) Predicted WEPL resolution versus WEPL. (b) WEPL resolution averaged over 260 mm proton range as function of the intrinsic detector energy resolution δE for the three detector design approaches: calorimeter (n = 1), multistage energy/range detectors (n = 3, 5, 80), and range counter (n = 60).
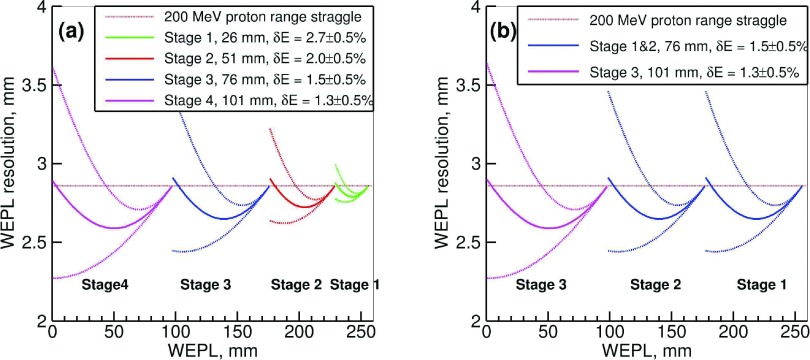
The comparison shown in Fig. 2(a) indicates that assuming realistic detector resolution the multistage detector with the number of stages as low as five outperforms the range counter and the calorimeter in terms of the WEPL resolution. Moreover, the WEPL resolution of the multistage detector depends on the detector intrinsic resolution δE much more weakly than does the calorimeter, as shown in Fig. 2(b), which is essential for any WEPL detector designed to work at a high data rate. The results in Fig. 2 correspond to WEPL detectors composed of identical stages; one can also consider a multistage detector with stages of different thicknesses. To keep the WEPL uncertainty of such a detector below a certain level for the total WEPL measurement range, the intrinsic resolution δE has to be better for thicker stages. For example, the predicted WEPL resolution for a four-stage detector composed of stages fitting 1, 2, 3, and 4 in. (25, 50, 75, and 100 mm diameter) photomultiplier tubes (PMTs) and for a three-stage detector fitting two 3 in. and one 4 in. PMTs is shown in Figs. 3(a) and 3(b) as a function of WEPL. The corresponding intrinsic resolution δE of the stages required to achieve the WEPL accuracy displayed in Fig. 3 is listed in the figure legends.
FIG. 3.
Predicted WEPL resolution for a four-stage detector composed of stages fitting 1, 2, 3, and 4 in. PMTs (a) and for a three-stage detector fitting two 3 in. and one 4 in. PMTs (b) as a function of WEPL. The required intrinsic resolutions δE of the stages are listed in the legends. Dotted lines show WEPL resolution margins corresponding to ±0.5% variation of the δE value.
Using approximate Eqs. (4), (6), and (8) for the detectors comprised of different number of stages, we estimated the intrinsic resolution δE required to keep the WEPL measurement uncertainty per 200 MeV proton close to the 2.85 mm proton straggling limit and not exceeding 3 mm. The δE values and corresponding WEPL resolution averaged over 0–260 mm WEPL range are presented in Table I.
TABLE I.
WEPL measurement error per a 200 MeV proton.
| Number of stages | Stage thicknesses, polystyrene (mm) | Intrinsic resolution of the stages, δE (%) | Averaged WEPL resolution, water equivalent (mm) |
|---|---|---|---|
| 1 | 250 | 0.65 | 2.5 |
| 2 | 125 + 125 | 1.15, 1.15 | 2.65 |
| 3 | 76 + 76 + 101 | 1.45, 1.45, 1.3 | 2.7 |
| 4 | 26 + 52 + 76 + 101 | 2.7, 2.0, 1.45, 1.3 | 2.75 |
| 5 | 5 × 51 | 5 × 2.0 | 2.8 |
| 10 | 10 × 26 | 10 × 2.7 | 2.9 |
| 60 range counter | 60 × 4 | ∼25 (see text) | 3.1 |
| 80 | 80 × 3.7 | 15 | 2.9 |
The multistage approach has clear advantages over the range-counter approach, i.e., better WEPL resolution, simpler assembly, and a greatly reduced number of channels, meaning lower cost and less readout complexity. The channel count advantage is reduced somewhat by the need to digitize each signal pulse, compared to the range counter, which can function with only a simple discriminator in each channel. It should be noted that although the intrinsic resolution δE of the range counter is not directly present in Eq. (6) defining the range-counter WEPL resolution, together with the discriminator threshold it defines the counter efficiency, which should be close to 100% for applicability of Eq. (6). For example, 200 MeV protons traversing the 3.75 mm thick scintillating detector of the range counter described in Ref. 10 produce a signal distribution with a mean of 110 mV and a Gaussian sigma of 25 mV, i.e., δE = 23%. The threshold was set to 20 mV to keep the noise rate below 50 kHz. In this case, the single-stage firing efficiency was about 0.9998, and the probability that all counters on the proton range fired was close to 99%.
The multistage detector advantage over the single-stage calorimetric approach is that the intrinsic energy resolution of each stage does not need to be nearly as good and stable, allowing use of fast and relatively inexpensive detectors such as plastic scintillators with PMT readout. This is important because high speed is a key requirement. The intrinsic energy resolution of a large plastic scintillating detector depends on many factors. For the current application, the most important are the light collection efficiency and its dependence on the particle track location, the PMT gain stability, and the scintillation light yield of plastic scintillator for protons. According to Eq. (8), the WEPL resolution dependence on δE increases with increasing proton range in the last stage once that range exceeds the range straggling magnitude, i.e., above ∼3 mm (see also Fig. 3). The scintillation light yield for a proton with a range of 3 mm and above (proton energy above ∼15 MeV) exceeds 5000 photons/MeV, which allows one to achieve a statistical uncertainty on δE below 1%, assuming reasonable light collection and PMT photocathode efficiency. The PMT gain stability depends on the particle rate, the PMT temperature, and scintillating light and high voltage variations. Special measures are usually required to keep it below the 1% level.11 As for the light collection efficiency dependence on the proton track location, for large size scintillators with a single PMT readout it amounts to tens of percent, well above an acceptable level. Fortunately, the spatial variation of the light collection efficiency is rather smooth and can be corrected to below the 1% level based on proton track extrapolations from the rear tracker into the multistage detector. A conservative estimate of 1% for each of the three main independent contributions results in a δE value close to 2%. These considerations made the five-stage plastic scintillator detector our choice for phase II design of the pCT head scanner prototype.
In Secs. 2.B–2.E, we describe experimental setup and performance results of the five-stage WEPL detector consisting of five polystyrene scintillators integrated in current phase II pCT scanner in a 200 MeV proton beam, as well as comparisons with a detailed geant4 simulation.
2.B. Detector design and integration
2.B.1. Phase II pCT scanner
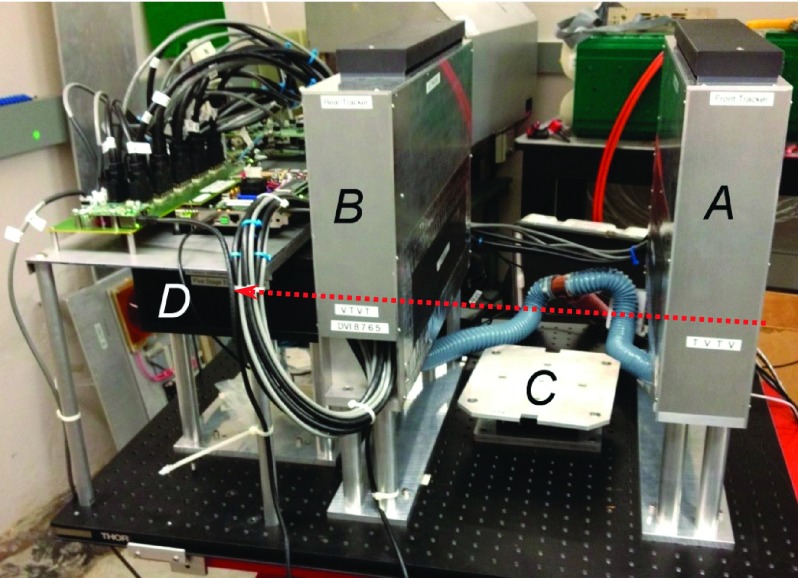
Phase II pCT head scanner consists of three main components, as illustrated in Fig. 4. The front and rear silicon microstrip (SSD) position-sensitive detectors (tracking modules) measure the proton track entering and exiting the object being imaged, which is positioned at the scanner isocenter on a rotational stage in-between the tracking modules. The multistage energy/range detector is located at a short distance behind the rear tracking module. A custom DAQ system records individual histories at a data rate of more than a million protons per second. A detailed description of the scanner and its technical performance will be published elsewhere.12
FIG. 4.
Phase II pCT head scanner with the five-stage energy/range detector installed. The front tracker (A), rear tracker (B), the rotation stage (C), and five-stage detector (D) are labeled. The event builder and five-stage-detector electronics are visible above the five-stage detector. The red arrow indicates the proton beam direction.
2.B.2. The five-stage WEPL detector
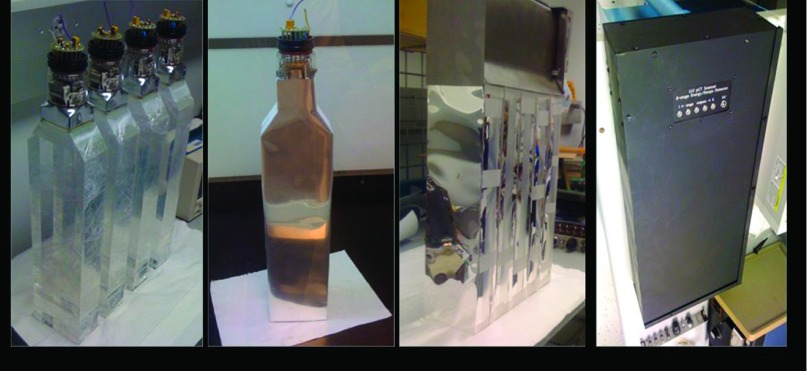
As outlined in the analysis above (see Sec. 2.B), the optimal number of stages in view of performance and simplicity is five for WEPL measurements made with a multistage detector in the 0–260 mm range required for a pCT scan with a 200 MeV proton beam. That defines the thickness of each stage to be about 260/5 = 52 water-equivalent millimeters. The detector scintillating material we chose is polystyrene-based UPS-923A, which provides high light output, low light attenuation, and long-term stability.13 Polystyrene’s relative stopping power is about 1.038, so the stage thickness should be about 50 mm. We chose 51 mm to fit a 2-in. photomultiplier. The lateral stage sensitive area must overlap fully that of the tracking system, which in turn is defined by the instrument aperture of 9 × 36 cm2. We used 10 × 40 × 5.1 cm scintillator slabs with edges on one side beveled at an angle of 35° to form a built-in light guide that fits the 2-in. square window of an R3318 Hamamatsu PMT. All scintillator sides were optically polished, and the PMTs were glued with optical epoxy to the scintillators as shown in the first pane of Fig. 5. Each scintillator-PMT assembly was cladded with reflective material as shown in the second pane. The material used was Vikuiti™ ESR film, 65 μm thick, with greater than 98% reflectance (improved VM2000 film). All five wrapped stages were stacked together, and the five PMTs were wired to be powered in parallel. The first seven PMT dynodes operate from a single −800 V supply that passes current through passive dividers using resistors and Zener diodes. These low current dividers are located on the PMTs and equipped with trimpots to equalize stage gains. The final three dynodes operate from a −365 V supply and a custom voltage-divider circuit, composed of high voltage transistors and Zener diodes, that supplies the three dynodes of each PMT with stable voltages and relatively high current, as is necessary when scintillation light from millions of protons per second is incident upon the PMT. The PMTs are covered with a combined mu-metal/soft-steel shielding as shown in the third pane of Fig. 5, and the complete five-stage assembly is enclosed in a steel housing with a 10 × 37 cm entrance window made of 50 μm thick blackened aluminum foil (last pane in Fig. 5).
FIG. 5.
Assembly of the five-stage detector.
2.B.3. WEPL detector readout
The five-stage WEPL detector readout was integrated into phase II pCT DAQ system, which has already been described elsewhere.1 A custom printed circuit board (PCB) was designed to digitize the PMT signals, process the results, and package the data for transmission to the event builder FPGA of the DAQ system. The raw PMT signal passes through a differential ADC driver (Analog Devices AD8138) and is digitized by a 14-bit pipeline ADC (Analog Devices AD9244) that operates at 65 MHz.
Sending the individual 15-bit samples (14 bits plus out-of-range indicator) to the event builder and the DAQ computer would require excessive data bandwidth. Therefore, logic was implemented to reduce the data by summing a certain number of samples (adjustable, usually one before the signal peak, one with the signal peak and four following the peak). The algorithm is implemented in a FPGA (Xilinx Spartan-6 XC6SLX25).
2.C. Experimental setup
Phase II pCT scanner was installed on the research beam line of the clinical proton synchrotron at Loma Linda University Medical Center, about 3 m downstream of the beam-line exit window. For the performance tests of the five-stage WEPL detector, a 200 MeV proton beam, scattered by two one-millimeter thick lead foils installed in front of the exit window, provided a cone beam with about 8 cm (one sigma) lateral Gaussian profile at the pCT scanner isocenter. For the experimental results of this work, the beam intensity varied from a maximum of a few million protons/s in the beginning of the spill down to a few hundreds of thousands of protons per second at the spill end. We have previously shown12 that we can operate the system with minimum pileup of events at sustained event rates of 1 MHz. Further, pileup events can be recognized and rejected as described in that reference.
2.D. Monte Carlo simulations
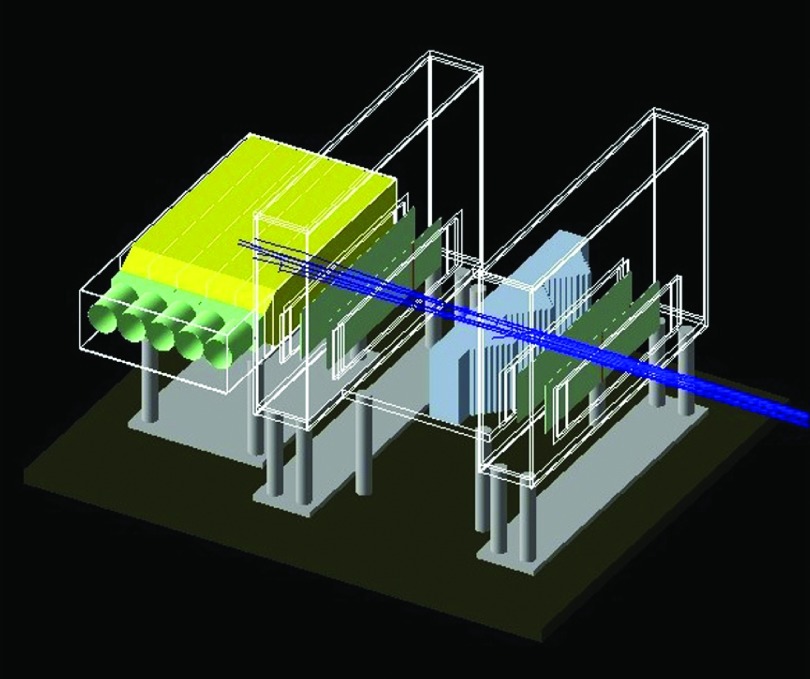
geant4 (Ref. 14) version 9.6 was used to study the performance of the five-stage WEPL detector incorporated in phase II scanner. The simulation geometry of the platform and a simulation example are shown in Fig. 6. A pencil beam of 200 MeV protons with 0.2 mm diameter was generated in vacuum and transported through a beam-pipe exit window, two 1 mm thick lead foils, and the tracker telescopes and phantom objects (or air) and was then stopped in the five-stage energy detector, which was simulated with all geometric and material details given. Usually a few million histories per run were simulated. The EMLivermorePhysics electromagnetic and QGSP_BIC_HP hadronic physics models were used in the geant4 simulation. The simulated hit positions of the tracker and the energy deposited in the detector stages were stored as n-tuples for further analysis. The analysis software runs under the root data analysis framework15 and includes scripts that smear the geant4 simulated data according to predefined detector parameters such as the known spatial and energy resolutions. The simulated data were treated with the same calibration and data analysis scripts we use for experimental data.
FIG. 6.
The geant4 model of pCT phase II scanner and a simulation example with ten 200 MeV protons crossing the calibration step phantom.
2.E. Detector response correction and calibration
To achieve good precision across the full aperture of the instrument, correction and calibration measures were implemented. The light collection by the PMT varies with the location of the proton path in the scintillator. Therefore, the first corrective measure was to parameterize the position dependence. For this purpose, track segments were extrapolated from the rear tracking module to the stage being corrected, and pulses were accumulated in 0.5 × 0.5 cm2 bins and averaged over a large sample of single-track events. The resulting 3D distributions showed spatial variations in the stage response of up to ±10%, which is much larger than the required 1%. To parameterize that position dependence, the 3D distribution for each stage was fitted with a quadratic function of T (horizontal) and V (vertical) coordinates as shown for the first stage in the left pane of Fig. 7. The fitted function was normalized to the energy deposition predicted by the geant4 model in order to convert ADC counts to energy units (MeV) and was used to correct the stage response for proton track location. The corrected 3D distribution is shown in the right pane of Fig. 7. This procedure reduced the spatial variation to 0.4% rms deviation over the entire sensitive area except for small regions close to the PMT, which are actually not used for image reconstruction. One should note that for the U coordinate (along the beam axis), the light collection uniformity should be much better, because along this axis the PMT window overlaps practically all scintillator depths, whereas along the V axis the PMT overlaps only half of the scintillator width.
FIG. 7.
Left pane: parameterization of the first stage response with quadratic functions of T and V coordinates. Right pane: the stage response in energy units, corrected for track position.
Using combinations of the 10 × 20 cm2 polystyrene plates of different uniform thickness as an energy degrader, we verified experimentally that the spatial variation of all detector stages did not exceed 0.5% RMS after applying the T–V correction. We also investigated the variation of the WEPL resolution with T and did not find a measurable dependence. This is explained by the usually very high photoelectron statistics. In case the statistics is low when protons stop near the proximal surface of the scintillator, the resolution is defined by energy/range straggling, which leads to much larger variation than that caused by photoelectron statistics variation with T.
In addition to correcting for the track position dependence, the system requires calibration to convert the corrected pulse sizes into WEPL values of the protons through the object being imaged. In phase I pCT scanner, the calibration of the single-stage calorimeter was performed in a few runs with a set of polystyrene plates of known thickness.2 The five-stage detector requires at least five times more calibration points (phantom thicknesses), which makes the previous procedure impractical and time consuming. Therefore, a new step phantom, combined with a method that uses tracking information, was introduced to facilitate and expedite the WEPL calibration procedure. The new calibration phantom was first implemented in the geant4 model of P-phase II scanner, and the calibration procedure was simulated in order to verify its performance and validate the corresponding calibration software.
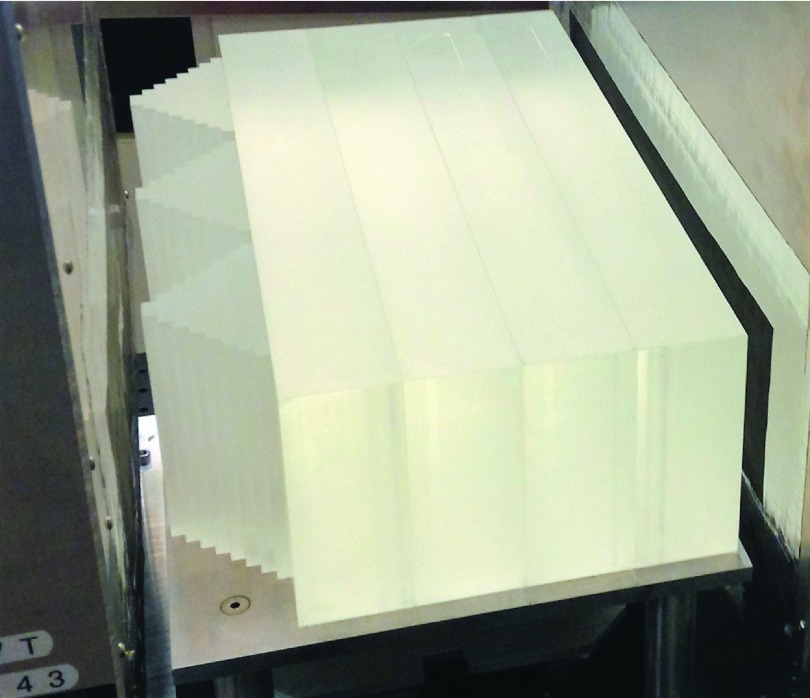
The calibration step phantom (Fig. 8) is made of polystyrene and contains three pyramids along the T direction with 6.35-mm steps, providing stepwise variation of polystyrene thickness from 0 to 50.8 mm in the beam direction. To cover the full range of WEPL that can be imaged with 200 MeV protons, four removable polystyrene bricks of 50.8 mm thickness are successively added to the variable part of the phantom. The maximum physical and water-equivalent polystyrene thickness traversed by protons is thus 254 and 263.7 mm, allowing calibration of the detector over this WEPL range.
FIG. 8.
WEPL calibration setup: the polystyrene step phantom with four additional polystyrene bricks installed between the tracking modules.
The calibration procedure is performed in five separate runs, both in simulations and in the beam experiment: in the first run, data are taken or simulated with just the step phantom installed, and in the following runs the bricks are added one by one. To establish a calibration curve, i.e., WEPL as a function of detector response, the data first are processed as follows:
-
1.
The path lengths in polystyrene and air traversed by a given proton in the reconstruction volume are reconstructed using tracking information.
-
2.
The WEPL value is calculated as the sum of air and polystyrene path lengths multiplied by their corresponding relative stopping powers.
-
3.
The corresponding detector response is recorded in terms of the five-stage signals corrected for track position dependence and converted to energy units.
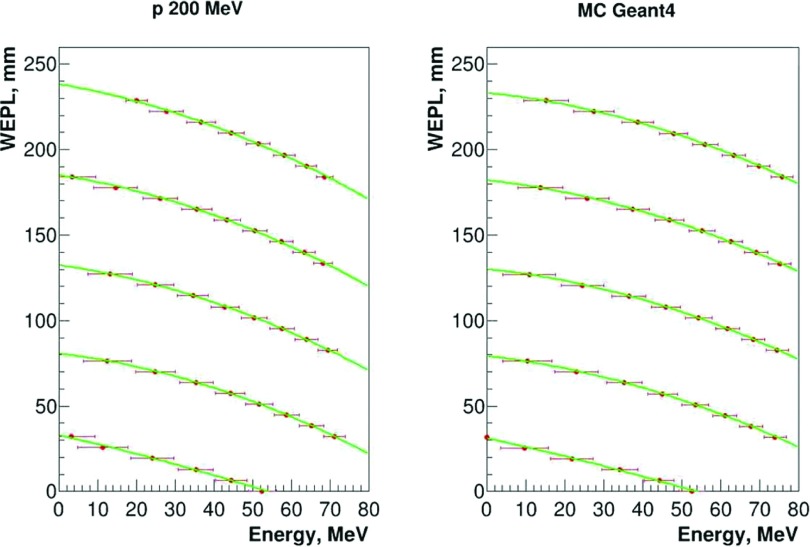
The preprocessed data are then used to generate WEPL calibration functions: for each WEPL value the response distribution of the detector stage where the proton stops was fitted with a Gaussian to find the mean value and variance of the stage response. The mean values in turn are fitted with second order polynomial function W = p0 + p1E + p2E2. The resulting calibration functions are shown in Fig. 9 for both the geant4 calibration model and the experimental calibration procedure.
FIG. 9.
Experimental (left) and simulated (right) calibration plots for the five consecutive stages: WEPL value (mm) versus deposited energy (MeV) in the stages where the proton stops. The green curve is a second order polynomial fit used to generate calibration functions.
3. RESULTS AND DISCUSSION
3.A. Detector intrinsic resolution and stability
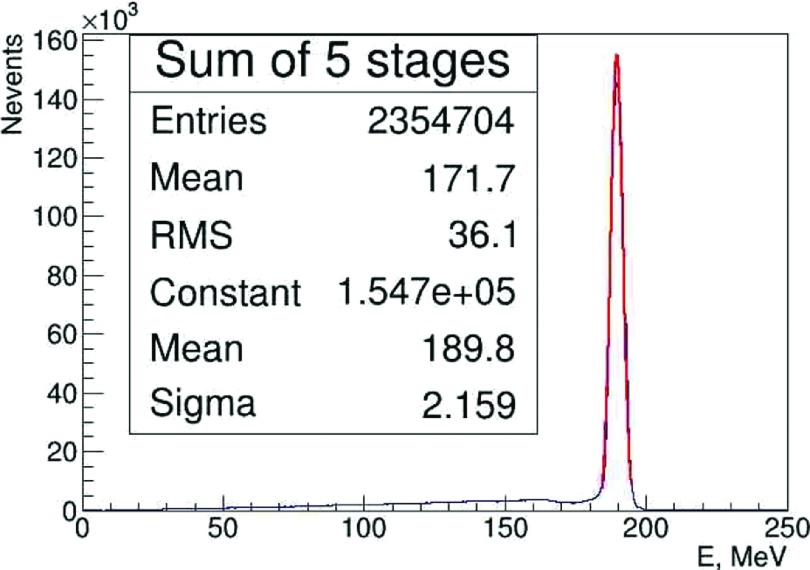
A set of experimental data was taken in a 200 MeV scattered proton cone beam without any phantom during the calibration runs, as shown in Fig. 4. Figure 10 shows the distribution of the residual proton energy measured by the five-stage detector for a sample of single-track events in which the 200 MeV proton passed through a 30 × 9 cm area of the detector aperture. The width of the Gaussian curve fit to the data is 1.1%. The distribution is slightly broadened by fluctuations in the actual energy deposition, which was estimated by Monte Carlo simulations. A simulation of the energy deposition by geant4 without inclusion of any detector measurement effects yields a width of 0.3%, suggesting that the system is capable of a close to 1% precision in its measurement of the energy deposited in the scintillators.
FIG. 10.
Sum of the energy depositions in the five stages for a large sample of 200 MeV protons incident upon the 9 × 30 cm area of the five-stage detector. The red curve is the Gaussian fit to the measurements with fitting parameters shown in the last three lines in the inset.
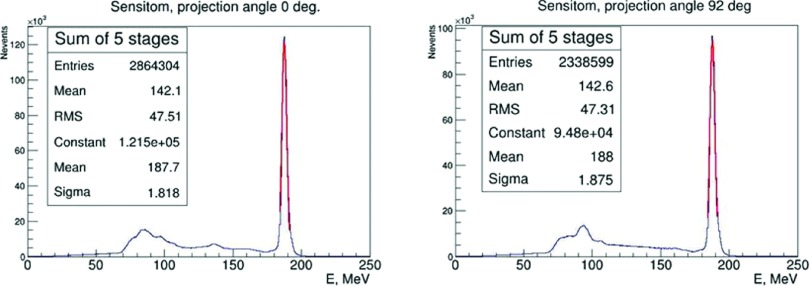
The five-stage WEPL detector has a lateral acceptance significantly larger than our imaging objects. Therefore, it registers many protons that miss the object and produce a high-energy peak in the energy distribution, which is useful for monitoring the WEPL detector PMTs short- and long-term gain stability. As an example, Fig. 11 shows residual energy distributions of 200 MeV protons during a pCT scan of the 4 × 15 cm CTP404 module of the Catphan® phantom, here called “Sensitom,” for two projections (0° and 92°) taken about 4 h after the WEPL detector calibration within a 20 min interval. The means of the Gaussian fits to the high-energy peaks show that over 4 h the drift of the gain is about 1.1%, while short-term gain stability is better than 0.2%. Using the high-energy peak position registered by the individual stages, one can correct for the PMT gain if the drift exceeds the accepted 1% limit.
FIG. 11.
Residual energy depositions of 200 MeV protons during a pCT scan of the Catphan® phantom at 0° (left) and 92° (right) orientation. The gain drift is evaluated by fitting a Gaussian to the high-energy peak (red curves).
3.B. Detector WEPL resolution and linearity
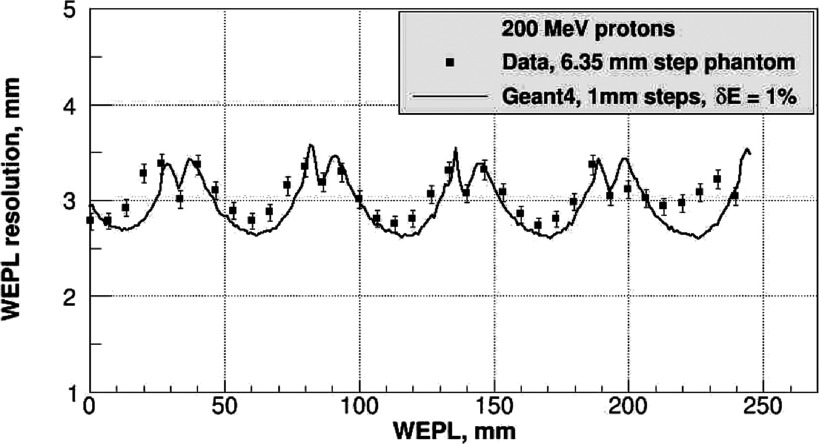
By using the established calibration functions to propagate the mean variance of the detector response into the variance of the WEPL, the uncertainties of the individual WEPL measurements were evaluated and compared with corresponding results obtained from the detailed geant4 simulation of the five-stage detector, assuming an intrinsic energy resolution of 1%. Generally good agreement was observed, as demonstrated in Fig. 12. The experimental WEPL resolution in stage 1 (WELP > 200 mm) was slightly worse than what one would expect based on the resolution of the other stages and the resolution predicted by simulation. We assume this is explained by the fact that the first stage formed the trigger response and a relatively high threshold was applied in the experimental scanner. Variation of this threshold during the scan may have led to additional fluctuations in the response of this stage and may have also led to additional inaccuracy of the calibration for this stage. This was not taken into account in the simulation.
FIG. 12.
Simulated and experimental WEPL resolution for the five-stage WEPL detector as a function of the WEPL of the object being imaged.
The simulations were performed for a set of water slabs of thickness from 0 to 250 mm in 1 mm increment to predict the detailed WEPL resolution curve, which can be compared to the simple analytical prediction presented in Fig. 2 for a five-stage detector. It should be noted that the curve in Fig. 12 is shifted along the WEPL axis with respect to the one in Fig. 2 by about 12 mm which is the water-equivalent thickness of the 2 mm lead foil present in the beam line. For the realistic detector, both simulated and experimental data yield an average WEPL resolution of 3 mm, whereas the theoretically predicted resolution is about 2.8 mm.
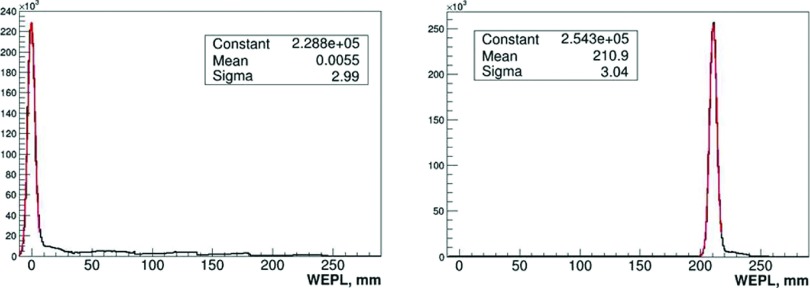
Some additional uncertainty arises from leakage of energy due to inelastic nuclear interactions in the phantom and the detectors, leading to overestimated WEPL values. This is illustrated in Fig. 13, where WEPL distributions reconstructed using the calibration functions are shown for 200 MeV protons traversing an air gap and an 8 ± 0.01 in. (203.2 ± 0.2 mm) thick polystyrene slab. Proton nuclear interactions mainly contribute to the high-WEPL tail visible in Fig. 13. Most of these events are removed during CT reconstruction by appropriate cuts, but they also skew and broaden the main peak to some degree.
FIG. 13.
Reconstructed WEPL distribution for 200 MeV protons traversing an air gap (left) and a 203.2 ± 0.2 mm thick (211.0 ± 0.2 mm water equivalent) polystyrene slab (right). The red curves are the Gaussian fits to the measurements with fitting parameters shown in the insets.
There is a specific source of additional uncertainty in the WEPL measurement with a multistage detector. It arises when a proton passes through one stage and stops in the wrapping material, or else, in the superficial layer of the next stage, producing a signal below a threshold introduced to distinguish signal from noise. These events cause a systematic shift (on average about +3 mm) to the reconstructed WEPL, because, in this case, the energy deposited in the last stage that fired is a few MeV less than the actual energy of the proton entering the stage. For a stage thickness of 51 mm, a wrapping thickness of 2 × 0.065 mm of polystyrene, and an energy threshold below 1 MeV, the fraction of such events is less than 0.3%. An excessively high threshold can raise the fraction of such events, but a threshold set too low might result in noise, causing the program to conclude falsely that the proton passed completely through the preceding stage. Moreover, a low energy proton stopping near the proximal surface in a stage produces fewer scintillation photons than expected, due to nonlinearity of the organic scintillator response to highly ionizing particles. Because of this and according to Birks’ formula,16 the effective threshold for 5 MeV protons in the polystyrene scintillator is raised by a factor of 2.
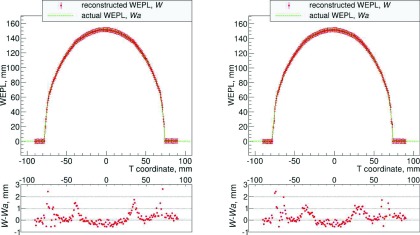
A test for systematic shifts in the WEPL reconstruction procedure was performed by acquiring a proton-radiographic image of an acrylic (PMMA) cylinder with 5 mm thick walls and a 75 mm outer radius, filled with distilled water, which was degassed in a vacuum chamber. Using the established calibration function, the WEPL values were reconstructed for a 2 cm high central slice of the phantom and are shown in the left pane of Fig. 14 as a function of the T coordinate together with actual WEPL. The actual WEPL, WA, of a proton traversing this phantom at a distance T from and perpendicular to the cylinder axis given in water-equivalent units is mm for |T| < 70 mm, and for mm, where the coefficient 1.16 is the ratio of PMMA stopping power to that of water for 100–200 MeV protons. The systematic deviation of the reconstructed from the true WEPL is shown in the bottom part of the figure. The WEPL measurement uncertainty per proton for the water phantom, shown as error bars in the top plots of Fig. 14, was evaluated as the sigma of a Gaussian fit to the W − WA distribution and was found to be 3.05 ± 0.3 mm per a single proton.
FIG. 14.
Reconstructed WEPL profile (red circles) and uncertainty per proton (red error bars) for 200 MeV protons traversing a cylindrical water phantom with an acrylic shell, compared with the true WEPL based on known geometry and RSP values of the phantom (green line). The bottom part shows the difference between reconstructed and true WEPL values. Left pane: Only energy deposited in the stopping stage was used for WEPL reconstruction. Right pane: The information from all stages was used for WEPL reconstruction.
In Fig. 14, the left pane shows the result when using the calibration curve established for the response of the stage where the proton stopped, as described above. A noticeable systematic deviation from true WEPL value, up to about 2 mm, occurs for T values where the Bragg peak of the protons is located in the vicinity of the interface between two stages. The plots of the right pane correspond to a modified calibration procedure using information not only from the stopping stage but also from the upstream stages: when the energy deposition of the proton was within a 3-sigma interval of the maximum energy, a weighted combination of the WEPL value derived from the stopping stage, the stage proximal to it, and the sum of all stages was used. In this case, the systematic error is mostly within 1 mm but has a broader geometric distribution.
4. SUMMARY
A novel multistage scintillator energy/range detector design was optimized to provide information about the WEPL for proton imaging. The operating principle of the detector is based on measuring the response of the stage in which the proton is stopped, thereby combining that calorimetric measurement with the proton range measured through the previous stages. We have shown that a detector with five stages is capable of achieving a WEPL resolution close to the limit due to proton range straggling without imposing demanding requirements on the intrinsic energy resolution of each stage. We simulated, built, and tested a five-stage energy/range detector, with each stage a polystyrene scintillator read out by a PMT, and integrated it with the tracking and data acquisition system of phase II pCT scanner, built by the pCT collaboration. The five-stage design was found to have better performance than more complex calorimeter and range-counter designs: the overall WEPL measurement accuracy achieved with the five-stage detector is about 3 mm/proton in the 0–260 mm WEPL range required for a pCT head scan with a 200 MeV proton beam.
ACKNOWLEDGMENTS
The authors would like to acknowledge Robert Jones of Inland Technical Service for mechanical engineering support. This work was supported in part by Award No. R01EB013118-01 from the National Institutes of Health and the National Science Foundation, and the Loma Linda University Medical Center, Department of Radiation Medicine. The content of this paper is solely the responsibility of the authors and does not necessarily represent the official views of NIBIB, NIH, and NSF.
REFERENCES
- 1.Sadrozinski H. F.-W., Johnson R. P., Macafee S., Plumb A., Steinberg D., Zatserklyaniy A., Bashkirov V. A., Hurley R. F., and Schulte R. W., “Development of a head scanner for proton CT,” Nucl. Instrum. Methods Phys. Res., Sect. A 699, 205–210 (2012). 10.1016/j.nima.2012.04.029 [DOI] [PMC free article] [PubMed] [Google Scholar]
- 2.Hurley R. F., Schulte R. W., Bashkirov V. A., Wroe A. J., Ghebremedhin A., Sadrozinski H. F.-W., Rykalin V., Coutrakon G., Koss P., and Patyal B., “Water-equivalent path length calibration of a prototype proton CT scanner,” Med. Phys. 39, 2438–2446 (2012). 10.1118/1.3700173 [DOI] [PMC free article] [PubMed] [Google Scholar]
- 3.Penfold S. N., Schulte R. W., Censor Y., and Rosenfeld A. B., “Total variation superiorization schemes in proton computed tomography image reconstruction,” Med. Phys. 37, 5887–5895 (2010). 10.1118/1.3504603 [DOI] [PMC free article] [PubMed] [Google Scholar]
- 4.Ulmer W. and Matsinos E., “Theoretical methods for the calculation of Bragg curves and 3D distributions of proton beams,” Eur. Phys. J.: Spec. Top. 190, 1–81 (2011). 10.1140/epjst/e2010-01335-7 [DOI] [Google Scholar]
- 5.Janni J. F., “Energy loss range path length time-of-flight straggling multiple scattering and nuclear interaction probability. In two parts. Part 1. For 63 compounds. Part 2. For elements 1 ⩽ Z ⩽ 92,” At. Data Nucl. Data Tables 27(2–3), 147–339 (1982). 10.1016/0092-640X(82)90005-5 [DOI] [Google Scholar]
- 6.Sadrozinski H. F.-W., “Particle detector applications in medicine,” Nucl. Instrum. Methods Phys. Res., Sect. A 732, 34–39 (2013). 10.1016/j.nima.2013.05.117 [DOI] [PMC free article] [PubMed] [Google Scholar]
- 7.Pemler P., Besserer J., de Boer J., Dellerta M., Gahna C., Moosburger M., Schneider U., Pedroni E., and Staeuble H., “A detector system for proton radiography on the gantry of the Paul-Scherrer-Institute,” Nucl. Instrum. Methods Phys. Res., Sect. A 432, 483–495 (1999). 10.1016/S0168-9002(99)00284-3 [DOI] [Google Scholar]
- 8.Amaldi U., Bianchi A., Chang Y.-H., Gob A., Hajdas W., Malakhov N., Samarati J., Sauli F., and Watts D., “Construction, test and operation of a proton range radiography system,” Nucl. Instrum. Methods Phys. Res., Sect. A 629, 337–344 (2011). 10.1016/j.nima.2010.11.096 [DOI] [Google Scholar]
- 9.Uzunyan S. A., Blazey G., Boi S., Coutrakon G., Dyshkant A., Erdelyi B., Gearhart A., Hedin D., Johnson E., Krider J., Zutshi V., Ford R., Fitzpatrick T., Sellberg G., Rauch J. E., Roman M., Rubinov P., Wilson P., Lalwani K., and Naimuddin M., “Development of a proton computed tomography (pCT) scanner at NIU,” in Proceedings of the New Trends in High Energy Physics Conference, Alushta, Crimea, September 2013 (2013), pp. 1–7, arXiv:1312.3977v1 [physics.ins-det]. [Google Scholar]
- 10.Zatserklyaniy A., Feng V., Johnson R. P., Lustig-Jaeger J., Macafee S., Plautz T., Plumb A., Sadrozinski H. F. W., Steinberg D., Bashkirov V., Hurley F., and Schulte R., “Development of a range counter with SiPM readout for proton CT,” in Proceedings of the IEEE NSS–MIC, Anaheim, CA, October 2012 (IEEE, Piscataway, NJ, 2012), pp. 1326–1330. [Google Scholar]
- 11.Hamamatsu Photonics K.K., Photomultiplier Tubes. Basics Applications, 3rd ed. (Hamamatsu Photonics K.K., 2007), available at http://www.hamamatsu.com/resources/pdf/etd/PMT_handbook_v3aE.pdf. [Google Scholar]
- 12.Johnson R. P., Bashkirov V., DeWitt L., Giacometti V., Hurley R. F., Piersimoni P., Plautz T. E., Sadrozinski H. F.-W., Schulte R., Schubert K., Schultze B., and Zatserklyaniy A., “A fast experimental scanner for proton CT: Technical performance and first experience with phantom scans,” Nuclear Science, IEEE Transactions on PP(99) (2015). 10.1109/TNS.2015.2491918 [DOI] [PMC free article] [PubMed] [Google Scholar]
- 13.Artikov A., Budagov J., Chirikov-Zorin I., Chokheli D., Lyablin M., Bellettini G., Menzione A., Tokar S., Giokaris N., and Manousakis-Katsikakis A., “Properties of the Ukraine polystyrene-based plastic scintillator UPS 923A,” Nucl. Instrum. Methods Phys. Res., Sect. A 555, 125–131 (2005). 10.1016/j.nima.2005.09.021 [DOI] [Google Scholar]
- 14.Agostinelliae S., Allison J., Amako K., Apostolakis J., Araujo H., Arce P., Asai M., Axeni D., Banerjee S., Barrand G., Behner F., Bellagamba L., Boudreau J., Broglia L., Brunengo A., Burkhardt H., Chauvie S., Chuma J., Chytracek R., Cooperman G., Cosmo G., Degtyarenko P., Dell’Acqua A., Depaola G., Dietrich D., Enami R., Feliciello A., Ferguson C., Fesefeldt H., Folger G., Foppiano F., Forti A., Garelli S., Giani S., Giannitrapani R., Gibin D., and Gómez Cadenas J. J., “ geant4—A simulation toolkit,” Nucl. Instrum. Methods Phys. Res., Sect. A 506, 250–303 (2003). 10.1016/S0168-9002(03)01368-8 [DOI] [Google Scholar]
- 15.Brune R. and Rademakers F., “ root—An object oriented data analysis framework,” Nucl. Instrum. Methods Phys. Res., Sect. A 389, 81–86 (1997), see also https://root.cern.ch.10.1016/S0168-9002(97)00048-X. 10.1016/S0168-9002(97)00048-X [DOI] [Google Scholar]
- 16.Birks J. B., The Theory and Practice of Scintillation Counting (Pergamon, Oxford, 1964). [Google Scholar]


