

Highlight
We studied the genome-wide distribution characteristics of 5-Hydroxymethylcytosine (5hmC) modification in young panicles of a superhybrid rice combination.
Key words: 5-hydroxymethylcytosine, 5hmC profiles, heterochromatin, rice, transposable element.
Abstract
5-Hydroxymethylcytosine (5hmC), a modified form of cytosine that is considered the sixth nucleobase in DNA, has been detected in mammals and is believed to play an important role in gene regulation. In this study, 5hmC modification was detected in rice by employing a dot-blot assay, and its levels was further quantified in DNA from different rice tissues using liquid chromatography-multistage mass spectrometry (LC-MS/MS/MS). The results showed large intertissue variation in 5hmC levels. The genome-wide profiles of 5hmC modification in three different rice cultivars were also obtained using a sensitive chemical labelling followed by a next-generation sequencing method. Thousands of 5hmC peaks were identified, and a comparison of the distributions of 5hmC among different rice cultivars revealed the specificity and conservation of 5hmC modification. The identified 5hmC peaks were significantly enriched in heterochromatin regions, and mainly located in transposable elements (TEs), especially around retrotransposons. The correlation analysis of 5hmC and gene expression data revealed a close association between 5hmC and silent TEs. These findings provide a resource for plant DNA 5hmC epigenetic studies and expand our knowledge of 5hmC modification.
Introduction
Being a conserved epigenetic mark, methylated cytosine (5-methylcytosine, 5mC) is involved in many important biological processes, including heterochromatin formation, defence against transposon proliferation, genomic imprinting, regulation of endogenous gene expression, and silencing of transgenes (Paszkowski and Whitham, 2001; Bender, 2004; Zhang et al., 2006; Zhang et al., 2014). Cytosine methylation occurs primarily at CG dinucleotide sites, although significant levels of methylation have also been found at CNG and CNN sites in plants (Cao and Jacobsen, 2002). DNA methylation in plants has been implicated in development and transcriptional regulation (Kondo et al., 2010; Marfil et al., 2012).
5-Hydroxymethylcytosine (5hmC), a recently identified epigenetic modification in mammals, is a base generated from the oxidation of 5mC by the TET (ten-eleven translocation) family of Fe2+- and 2-oxoglutarate-dependent enzymes (Münzel et al., 2011; Zhou et al., 2014), and is now widely considered as the sixth base in DNA (Song and He, 2011). 5hmC, as a new epigenetic mark, has received tremendous attention from epigenetic and other related communities. In mammals, 5hmC is a key intermediate in active DNA demethylation and can be enzymatically deaminated to 5-hydroxylmethyluracil (5hmU) or further oxidized to 5-formylcytosine (5fC) and 5-carboxylcytosine (5caC) by the TET family enzymes (Bhutani et al., 2010; Cortellino et al., 2011; Gong and Zhu, 2011; Guo et al., 2011; He et al., 2011). The distribution and function of 5hmC in mammals have also been widely studied. 5HmC mainly exists in promoter and intragenic regions, but is depleted from intergenic regions in human somatic neural tissue (Jin et al., 2011b ). Previous studies showed that 5hmC in gene bodies is preferentially localized to exons (Ficz et al., 2011; Pastor et al., 2011; Williams et al., 2011), and its level is positively correlated with the expression level of the corresponding genes (Laird et al., 2013; Pfeifer et al., 2014). Accumulating evidence reveals the importance of 5hmC in embryogenesis (Ito et al., 2010; Koh et al., 2011) and development (Ruzov et al., 2011; Yao and Jin, 2014). Moreover, 5hmC is strongly depleted in many human cancers relative to the corresponding normal tissue (Jin et al., 2011a ; Yang et al., 2013). Many studies have been conducted in mammals regarding profiling the genome-wide distribution of TET and/or 5hmC, as well as assessing the roles of 5hmC in the regulation of gene expression (Iqbal et al., 2011; Robertson et al., 2011; Stroud et al., 2011; Taylor et al., 2014) and in the maintenance of pluripotency and self-renewal of embryonic stem cells (Iyer et al., 2009; Ito et al., 2010; Koh et al., 2011). However, very little is known about the genome-wide distribution and the epigenetic roles of 5hmC in plants.
In the past few years, there has been a debate about whether 5hmC exists in the plant genome, as there are considered to be no functional counterparts of TET family enzymes in plants (Jang et al., 2014). Terragni et al. (2012) estimated the global 5hmC content in the genomes of various plants using recombinant β-GT (β-glucosyltransferase), and found very low levels of 5hmC (<0.07% of the total nucleotides) in Arabidopsis, soybean, and rice. This is the first report of the presence of 5hmC in plant genomes. By using two complementary dot-blot assays, Yao et al. (2012) subsequently reported that genomic DNA from Arabidopsis leaves and flowers contained low but measurable levels of 5hmC, representing ~0.068–0.075% of the total cytosine nucleotides.Moricová et al. (2013) detected 5hmC in DNA isolated from protoplasts of Cucumis sativus and Brassica oleracea, and experimentally proved that oxidative DNA damage was not the main source of 5hmC. Moreover, Liu et al. (2013) reported the detection of ~0.79 molecules of 5-hydroxymethyl-2′-deoxycytidine (5hmdC) per million nucleosides in Arabidopsis genomic DNA using a liquid chromatography-multistage mass spectrometry (LC-MS/MS/MS) method, although a recent study concluded that 5hmC is not present in appreciable quantities in Arabidopsis DNA (Erdmann et al., 2015). Therefore, 5hmC modification has been detected at low levels in plant genomes, but there is no detailed information about its distribution and function.
Current bisulphite conversion-based methodology fails to distinguish 5hmC from 5mC because 5hmC, similar to 5mC, does not undergo deamination during bisulphite treatment (Huang et al., 2010; Jin et al., 2010; Yu et al., 2012). With the development of 5hmC detection methods, such as the use of 5hmC-specific antibodies and chemical labelling (Song et al., 2011), it is feasible to profile the genome-wide distribution of 5hmC. Rice (Oryza sativa L.) is one of the most important world crops with a relatively small genome size (430Mb) (Zhao and Zhou, 2012). The availability of the complete genome sequence of japonica (cv Nipponbare) (Goff et al., 2002) and indica (cv 93-11) (Yu et al., 2002) subspecies of rice has enabled the high-resolution mapping of epigenetic modifications in chromosomes and the investigation of their regulatory roles in transcriptional activity. In this study, 5hmC modification in DNA isolated from different tissues and cultivars of rice was detected and quantified using dot-blot and LC-MS/MS/MS assays. The genome-wide distribution of 5hmC was also explored using a sensitive chemical labelling method (GLIB: glucosylation, periodate oxidation, and biotinylation) followed by NGS (next-generation sequencing). Together with transcriptome data obtained from RNA-sequencing (RNA-Seq), the potential epigenetic roles of 5hmC were further explored.
Materials and methods
Material samples
The material used in this study was Chinese superhybrid rice LYP9, an elite hybrid most widely grown in China, and its paternal lines 93-11, an indica rice (Oryza sativa ssp. indica) variety, and maternal lines PA64s. All three cultivars were planted in a test field of the China National Hybrid Rice R&D Center in Hunan Province in 2011. During the period of ear development, whole panicles at the same developmental stage were sampled using a magnifying lens based on their length (3–4mm) after removing leaves. Four types of tissues, namely leaf, root, stem, and panicle, of 93-11 were collected from a test field in Beijing. Materials were immersed in liquid nitrogen rapidly then stored in a –80 °C freezer.
5hmC detection by immuno-dot-blot assay and LC-MS/MS/MS
All genomic DNAs were extracted using a DNasecure Plant Kit (DP320-03) (TIANGEN, China). Genomic DNA from panicle and leaf was denatured at 95 °C for 10min, then immediately chilled on ice for 5min. The dot-blot analysis was performed on a bio-Dot Apparatus (#170–6545, Bio-Rad). The completely dried charged nylon-based membrane was baked at 80 °C for 2h, cross-linked with 254nm UV light for 10min, and blotted briefly with 5% non-fat milk at room temperature for 1.5h. The primary rabbit anti-5-hydroxymethylcytosine antibody (1:10k, #39769, Ative Motif) was applied to the membrane and incubated at room temperature for 1h or at 4 °C overnight, followed by peroxidase-conjugated anti-rabbit IgG secondary antibody. The signal was visualized by using ECL-Plus (Amersham Pharmacia Biotech).
Genomic DNA (6 μg) isolated from rice tissues was digested using a cocktail of four enzymes, and the 5hmC target nucleoside was enriched on a Beckman HPLC system and subjected to LC-MS/MS/MS analysis, following previously described procedures (Liu et al., 2013).
5hmC-specific chemical labelling and affinity purification
Purified genomic DNA was sonicated into short fragments (200–300bp) by Covaris DNA shearing with microTUBEs according to the manufacturer’s instructions. The 5hmC labelling reaction was performed in a 75 μl solution containing 50mM HEPES (pH 7.9), 250mM MgCl2, 100 μM UDP-6-N3-Glu, and 80U of β-GT, and then incubated at 37 °C for 2h. After the reaction was complete, the DNA substrates were purified and the buffer exchanged in H2O via Bio-Rad Micro Bio-Spin according to the manufacturer’s instructions. The click chemistry was performed with the addition of 150 μM biotin into the DNA solution and incubation at 37 °C for 2h. The DNA samples were then purified by Invitrogen DynabeadsMyOne™ Streptavidin C1.
Sequencing of 5hmC-enriched genomic DNA
5hmC-enriched genomic DNA libraries were generated following the Illumina protocol for ‘Preparing Samples for ChIP sequencing of DNA’. The above-mentioned 5hmC-enriched DNA fragments (50ng) were ligated with Illumina library adaptors following by a 16 cycle PCR amplification with multiplex PCR primers. The PCR products of 200–300bp were gel purified and then quantified on an Agilent 2100 BioAnalyzer and by quantitative PCR. The 100bp single-end sequencing was performed on an Illumina HiSeq 2000 system to obtain 5hmC-enriched DNA fragment sequences.
Read mapping and 5hmC modification peak calling
The adaptor sequences were removed with the FASTX toolkit (http://hannonlab.cshl.edu/fastx_toolkit/). Reads of <25 nucleotides in length or containing ambiguous nucleotides were discarded. The remaining clean reads were aligned to the rice genome sequences (O. sativa subsp. japonica version 6.1) with up to two mismatches allowed by BWA (Burrows–Wheeler Alignment Tool) (Li and Durbin, 2009). All non-redundant uniquely mapped reads were used for peak calling using MACS (P-value < 1×10⁻⁵) (Zhang et al., 2008). Annotation of 5hmC peaks was performed based on gene annotation in the TIGR 6.1 database. Genomic distribution of 5hmC peaks was plotted using the SVG program.
RNA-Seq library construction and sequencing
Total RNAs from panicles 3–4mm in length for LYP9 and its parental lines were isolated using Trizol reagent (Invitrogen). Poly(A)+ mRNAs were enriched, and strand-specific RNA-Seq libraries were constructed and sequenced using the Applied Biosystems SOLiD sequencing. The sequenced reads of 50bp length were aligned to reference sequences including the genome (O. sativa subsp. japonica, TIGR version 6.1) and the exon–exon junction sequences by SOLiD Corona_Lite software, where the junction references were constructed by joining all possible pairs of non-redundant exons that belong to the same gene. A recursive mapping strategy was adopted to improve the usable sequenced reads information. The sequenced raw reads were mapped simultaneously to reference sequences with at most five, four, four, three, three, and two colour-space mismatches for 50, 45, 40, 35, 30, and 25 mers, respectively. The 50-mer reads were first mapped to the genome and junction sequences with five mismatches. Reads that failed to be mapped were progressively trimmed off, five bases at a time, from the 3′ end, and mapped to the genome again until a match was found (unless the read had been trimmed by <25 bases). All mapping was carried out in colour-space; reads mapping to multiple genomic locations were discarded. All uniquely mapped reads were used for gene expression quantification by wapRNA (Zhao et al., 2011). RPKM values (measured in reads per kb of exon per million mapped sequence reads, which is a normalized measure of exonic read density) were defined. By calculating the read coverage of annotated introns and exons in the rice genome for each sample, an empirical cut-off value was arbitrarily determined and used as a cut-off for detection of gene expression in each mRNA-Seq sample (He et al., 2010).
Validation of 5hmC peaks by real-time PCR
Genomic DNA was extracted using the DNA Secure Plant Kit (TIANGEN, China) according to the manufacturer’s instructions. DNA was randomly sheared to an average length of 200–500bp by sonication. A hMeDIP (hydroxymethylcytosine DNA immunoprecipitation) assay was then performed using the hMeDIP Kit (Active Motif, USA) according to the manufacturers’ instructions. The immunoprecipitated products and 10% of the original input DNA were purified with the Chromatin IP DNA Purification Kit (Active Motif) in parallel. The purified DNA was analysed by real-time PCR on the CFX96™ Real-time system (Bio-Rad, USA) using SYBR® Select Master Mix (Life Technologies, USA). The enrichment of 5hmC in selected peaks was calculated by normalizing the amount of immunoprecipitated DNA to input DNA. Each sample was run in triplicate and the average was plotted. A list of the primers used is provided in Supplementary Table S1 available at JXB online; the online tool Primer3 (http://www.simgene.com/Primer3) was used to design real-time PCR primers.
Accession numbers
The high-throughput sequence data reported herein have been deposited in the Gene Expression Omnibus (GEO) with accession number GSE37242.
Results
A low level of 5hmC modification was detected and quantified in rice DNA, and its level exhibited large variation in different tissues
It has been reported that there is a limited amount of 5hmC in the Arabidopsis genome (Terragni et al., 2012; Yao et al., 2012). In this study, the existence of 5hmC in DNA of rice was detected by dot-blot assay using an anti-5hmC antibody and an LC-MS/MS/MS method. The 5hmC was first detected in leaves at the flowering stage and in panicles at the booting stage in the indica rice cultivar 93-11 (O. sativa L. ssp. indica) by a dot-blot assay. The immuno-dot-blot assay results (Fig. 1A) revealed low but measurable levels of 5hmC, and the abundance of 5hmC differed between the panicle and leaf. It was also verified that this antibody specifically immunoprecipitated oligonucleotides containing 5hmC but not the same sequence containing cytosine or 5mC (Fig. 1A). Using a previously published LC-MS/MS/MS method (Liu et al., 2013), 5hmdC was successfully detected in genomic DNA from rice leaf at a level of 1.39±0.16 modifications per million nucleosides (Fig. 1B), thereby directly verifying the presence of 5hmC in rice DNA.
Fig. 1.
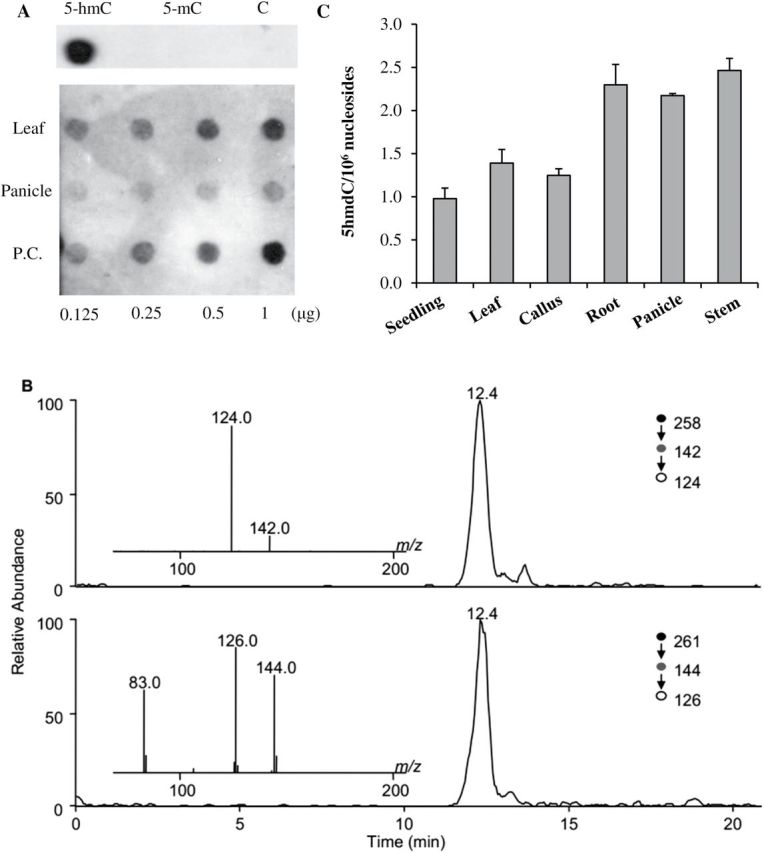
Detection and quantification of 5hmC from genomic DNA isolated from rice tissue. (A) Dot-blot detection of 5hmC in leaf and panicle DNAs from indica rice (93-11) with α-5hmC-specific antibodies. The upper panel indicates the specificity of the antibody for 5hmC. P.C., positive control; (B) Representative LC-MS/MS/MS results for the quantification of 5hmdC in rice leaf DNA. Shown in the panels are selected-ion chromatograms for monitoring the indicated transitions of 5hmdC (top panel) and [1,3-15N2, 2′-D]5hmdC (bottom panel), and in the insets are the MS/MS/MS results for the analyte and internal standard; (C) Quantification of 5hmdC in genomic DNA isolated from different rice tissues with the same LC-MS/MS/MS method. The y-axis shows the number of 5hmdC modifications per million nucleosides. The data represent the means and standard deviations of three independent LC-MS/MS/MS measurement results.
The contents of 5hmC in different rice tissues were further quantified using the same LC-MS/MS/MS method (Liu et al., 2013). The levels of 5hmdC were 1.39±0.16 and 2.17±0.03 modifications per million nucleosides in leaf and panicle, respectively, suggesting the tissue-specific occurrence of 5hmC in rice (Fig. 1C). This tissue-dependent distribution of 5hmC in rice is reminiscent of the findings in mammals (Kinney et al., 2011), where the levels varied from 0.01% to 0.7% per total nucleosides (Kriaucionis and Heintz, 2009; Globisch et al., 2010; Szwagierczak et al., 2010; Williams et al., 2012). It is obvious that the content of 5hmC in rice was significantly lower than that reported in mammals. In summary, the large intertissue variation in global 5hmC levels indicated that tissue type was a major modifier of 5hmC content, which is consistent with what has been observed in mammals (Li and Liu, 2011; Nestor et al., 2012).
Genome-wide profiling in three different rice cultivars revealed their specificity and conservation of 5hmC modification
To investigate whether 5hmC is a universal epigenetic mark in rice, 5hmC modification was compared among three different rice cultivars: the superhybrid rice LYP9, and its parental lines 93-11 and PA64s. To minimize systematic bias, immature panicles 3–4mm in length were simultaneously collected from the superhybrid rice group cultivars grown in a test field of the China National Hybrid Rice R&D Center in Hunan. DNA was extracted from each cultivar and an equal amount of DNA was used for the dot-blot assay. The dot-blot assay results showed large intercultivar variation in global 5hmC levels, which revealed 5hmC as a prevalent epigenetic modification in rice (Fig. 2A). By qualitatively comparing the levels among the three cultivars, it was found that 93-11 had the highest level of 5hmC. In addition, the level of 5hmC in LYP9 was more similar to that in 93-11 than to that in PA64s, and the former two lines exhibited significantly higher levels of 5hmC than did PA64s.
Fig. 2.

Specific and conservative distributions of 5hmC modification among cultivars. (A) Dot-blot results of genomic DNA samples from panicles 3–4mm in length from three rice cultivars with α-5hmC-specific antibodies; equal amounts of loaded DNAs were used for detection. (B) Number of identified 5hmC peaks in each cultivar (the right y-axis) and their number distribution in each class (the left y-axis). (C) An example showing marked intercultivar similarity of 5hmC modification in read levels among the three cultivars. (D) Overlap of identified 5hmC peaks among the three cultivars.
To obtain a global view of 5hmC modification in rice, high-throughput ChIP-seq (chromatin immunoprecipitation sequencing) analysis was performed using the Illumina HiSeq 2000 platform on 5hmC-specific chemically labelled and affinity-enriched DNA from immature panicles 3–4mm in length from the superhybrid rice LYP9 and its parental lines (93-11 and PA64s). An in-depth single-end ChIP-seq analysis was conducted and >22 million reads of 100bp in length were acquired for each sample. The total length of the reads was >2.4 Gb, representing ~7-fold the size of the rice genome. After removing adaptors, all clean reads from the three cultivars were aligned onto the TIGR O. sativa subsp. japonica genome reference (version 6.1) (Yuan et al., 2003; Ouyang et al., 2007), and it was found that ~64.6, 68.97, and 58.03% of the reads could be mapped to the reference genome for 93-11, PA64s, and LPY9, respectively, and ~74, 73.27, and 74.48% of the mapped reads could be uniquely aligned (Table 1). Using a model-based analysis of the ChIP-seq (MACS) software (Zhang et al., 2008), 3970, 2396, and 3489 significantly enriched genomic regions (peaks) associated with DNA 5hmC were identified in 93-11, PA64s, and LYP9, respectively (Fig. 2B). The average lengths of the defined peaks were 142, 141, and 139bp, and the average fold enrichments were ~10-, 9-, and 10-fold for 93-11, PA64s, and LYP9, respectively. There are ~30 distinct reads in each defined peak (Supplementary Fig. S1 at JXB online), and all of the identified 5hmC peaks are listed in Supplementary Tables S2–S4 for 93-11, LYP9, and PA64s, respectively. All peaks in each cultivar were further divided into four classes based on their statistical significance (i.e. P-value); class I was identified by a P-value between 1.0×10⁻⁵ and 1.0×10⁻¹⁰, class II by a P-value between 1.0×10⁻¹⁰ and 1.0×10⁻¹⁵, class III by a P-value between 1.0×10⁻¹⁵ and 1.0×10⁻²⁵, and class IV by a P-value <1.0×10⁻²⁵ (Fig. 2B; Table 2). Three 5hmC peak regions were randomly selected and the existence of 5hmC modification was confirmed in the panicle, leaf, sheath, and root of 93-11. The fold 5hmC enrichment results revealed that the hydroxymethylation level was different among various tissues at selected 5hmC peaks (Supplementary Fig. S2).
Table 1.
Statistics of sequenced reads and enriched 5hmC region number
| 93-11 | PA64s | LYP9 | |
|---|---|---|---|
| Total reads | 22 804 853 | 25 435 469 | 24 659 819 |
| Clean reads | 20 139 202 | 22 700 986 | 19 012 696 |
| Mapped reads | 14 733 064 | 17 541 625 | 14 310 180 |
| Mapped % | 64.60% | 68.97% | 58.03% |
| Unique mapped reads | 10 903 732 | 12 852 640 | 10 658 508 |
| Mapped % | 47.81% | 50.53% | 43.22% |
| Non-redundant reads | 10 007 175 | 11 948 233 | 10 078 316 |
| Non-redundant reads % | 91.78% | 92.96% | 94.56% |
| No. of peaks | 3970 | 2396 | 3489 |
| Intragenic peaks | 2964 | 1758 | 2619 |
| Intragenic peaks % | 74.66% | 73.37% | 75.06% |
Table 2.
5hmC peaks in each cultivar divided into four classes
| Class | 93-11 | LYP9 | PA64s |
|---|---|---|---|
| I | 1071 | 866 | 579 |
| II | 924 | 911 | 544 |
| III | 991 | 850 | 669 |
| IV | 984 | 862 | 604 |
The cultivar-specific 5hmC profiles were investigated both in the complete genome (Supplementary Fig. S3 at JXB online) and at specific loci (Fig. 2C) from the comparative analysis of the sequencing data. There were 40.88% peaks (1623 out of 3970) specific in the paternal line 93-11, 37.90% (908 out of 2396) in the maternal line PA64s, and 31.96% (1115 out of 3489) in the superhybrid rice LYP9. More than half of the 5hmC peaks were shared by two or three cultivars, while 1161 peaks were shared by all three cultivars (Fig. 2D), suggesting the similarity and conservation of cytosine hydroxymethylation in different rice cultivars. Further investigation revealed that 1036 peaks of 5hmC were common to LYP9 and its paternal line 93-11, a value which was much greater than the number shared between LYP9 and its maternal line PA64s (177 peaks of 5hmC). Previous studies showed that in both phenotype and gene expression in the panicle, the superhybrid F1 (LYP9) displays a higher level of similarity to the paternal line (93-11) (Song et al., 2007; Ge et al., 2008). The greater similarities of 5hmC content and gene expression between LYP9 and 93-11 indicated that further studies would be needed to explore whether 5hmC modification could regulate gene expression in rice, similar to its role in animals (Ficz et al., 2011).
Genome-wide distribution of 5hmC in three different rice cultivars revealed its preferential localization to heterochromatin regions
By dividing the whole genome into four parts: the promoter region which was defined as 1kb upstream of the TSS (transcriptional start site), the gene body, the transcriptional termination region (TTR, 1kb downstream of transcriptional termination site), and the intergenic region (Fig. 3A), all identified 5hmC peaks of 93-11 were annotated based on position, and it was found that 55.16% of these peaks occurred in the gene body, 11.18% in the promoter region, 8.31% in the TTR, and 25.35% in the intergenic region (Fig. 3A). To eliminate any effect of region length, the 5hmC average density was calculated by dividing the promoter, gene body, and TTR into 25, 35, and 25 equally sized bins from 5′ to 3′, respectively. It was found that 5hmC modification was apparently enriched in the gene body (Fig. 3B). The genome-wide distribution of 5hmC modification was significantly (P-value <1×10⁻¹²; χ2 test) different from the distribution of a randomly simulated data set (Supplementary Fig. S4 at JXB online). Most 5hmCs were targeted to gene regions (including the promoter, gene body, and TTR), especially to the gene body (Fig. 3A), a finding which is similar to the analysis of 5hmC distribution in human and mouse (Jin et al., 2011b ; Song et al., 2011; Stroud et al., 2011; Szulwach et al., 2011; Xu et al., 2011). Similar results were also observed in LYP9 and PA64s (Fig. 3A, B; Supplementary Fig. S4) even when different classes were investigated (Fig. 3C for 93-11 and Supplementary Fig. S5 for LYP9 and PA64s).
Fig. 3.

Genome-wide profiles of 5hmC modification among cultivars. (A) Distribution of 5hmC peaks in the whole genome. The left y-axis indicates the number of 5hmC peaks, and the right y-axis indicates th ecorresponding ratio in total peak number. (B) Average 5hmC enrichment over genes. The promoter, gene body, and TTR were divided into 25, 35, and 25 equally sized bins, respectively, from 5′ to 3′ to calculate the 5hmC average density in each bin. (C) 5Hmc peaks number distribution of 5hmC peaks in each class of 93-11 in the whole genome.
Analysis of the chromosome-level distributions of 5hmC peaks showed that chromosomes 4 and 10 had the highest number of peaks in all three lines (Fig. 4A). By further investigation, more 5hmC peaks were found on heterochromatin than on euchromatin. For example, in 93-11, 78% of the peaks were located on heterochromatin compared with 22% on euchromatin for chromosome 4, and similar results were observed in the other two lines. 5hmC in the two chromosomes covered heterochromatin regions at a remarkably large scale (Fig. 4B). When compared with a randomly simulated data set, it was significantly (P-value <2.2×10⁻¹⁶, Fisher’s exact test) enriched in heterochromatin in both chromosomes 4 and 10 (Fig. 4C), even if the raw peak numbers were normalized by the lengths of heterochromatin and euchromatin regions (Supplementary Fig. S6 at JXB online). 5-HmC peaks in each class were also enriched in the heterochromatin of each cultivar (Supplementary Fig. S7). The preferential distribution of 5hmC modification in heterochromatin suggested that 5hmC may affect chromatin structure.
Fig. 4.

Distribution of 5hmC peaks. (A) The number of 5hmC peaks in each chromosome in three cultivars. (B) Distributions of 5hmC peaks and annotated gene models in heterochromatin and euchromatin of chromosomes 4 and 10. (C) Distributions of 5hmC peaks in heterochromatin and euchromatin of chromosomes 4 and 10 compared with a random data set for 93-11, LYP9, and PA64s, respectively.
5hmC modification tends to be located in transcriptionally silent TE genes
Transposable element (TE) genes are known to be enriched in heterochromatin compared with euchromatin (Copenhaver et al., 1999; Turcotte et al., 2001). For example, there is a ~3-fold enrichment of TE genes in the heterochromatin of chromosome 4 of rice when compared with the euchromatin (Yan and Jiang, 2007). To examine the roles of 5hmC in TE genes, the study focused on those peaks that were targeted to genic regions, and it was found that 79.42, 82.77, and 81.67% of 5hmC peaks were located in TE genes in 93-11, PA64s, and LYP9, respectively (Fig. 5A); these values are significantly different from the random data set (P-value <2.2×10⁻¹⁶; Fisher’s exact test) (Supplementary Fig. S8 at JXB online). By surveying the distributions of targets for 5hmC peaks in each class, it was found that the percentages of TE and non-TE were consistent in classes II, III, and IV, but not in class I (Fig. 5B). To increase the reliability of the following results, the 5hmC peaks of class II, III, and IV were defined as being the more reliable peaks (MRPs). Based on the TIGR gene annotation, out of 41 415 (72%) non-TE genes, 187 genes containing 228 peaks of 5hmC (10.57% of genic-related peaks) were detected. In contrast, out of 16 209 (28%) TE genes, 1133 genes containing 1930 peaks of 5hmC (89.43% genic-related peaks) were detected in 93-11. Similar results were obtained for PA64s and LYP9. From the chromosome-level statistics, it was also obvious that 5hmC peaks were mostly located in TE genes (Supplementary Fig. S3), a result which was significantly different from the random data set (P-value <2.2×10⁻¹⁶; Fisher’s exact test) (Supplementary Fig. S9), especially on chromosomes 4 and 10. The close relationship between 5hmC modification and TE genes suggested that 5hmC may have a role in influencing the activity of TE genes.
Fig. 5.
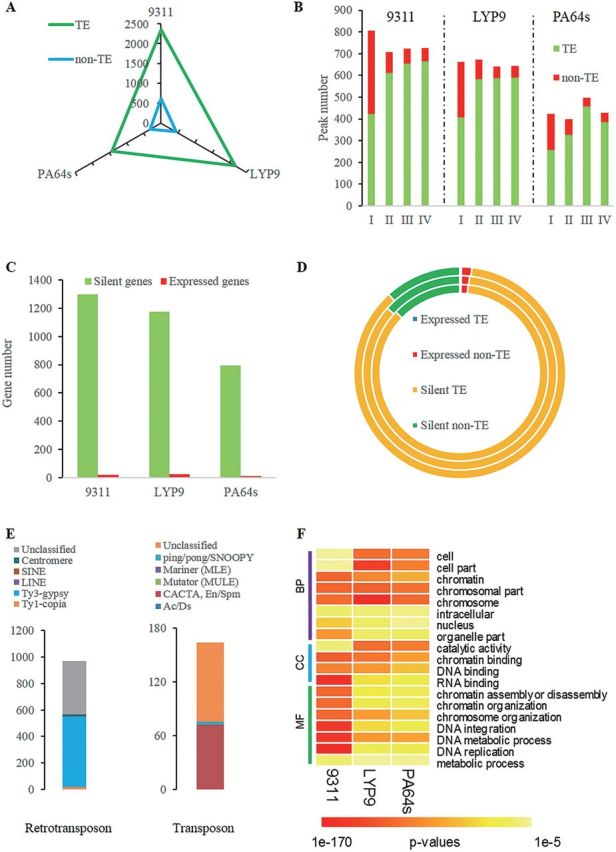
Predominance of 5hmC peaks to TE genes compared with non-TE genes. (A) The numbers of 5hmC peaks in TE genes and non-TE genes among the three cultivars. (B) The numbers of 5hmC peaks of each class in TE genes and non-TE genes. (C) The numbers of expressed and silent genes with more reliable peaks (MRPs). (D) The numbers of expressed and silent genes with MRPs (including TE and non-TE genes). The inner circle indicates genes with MRPs in 93-11, the outer LYP9, and the middle PA64s. (E) The numbers of retrotransposons and transposons with MRPs for 93-11. (F) Enriched GO annotation results (partial) of genes with MRPs using agriGO. BP, CC, and MF indicate the three categories: Biological Process, Cellular Component, and Molecular Function, respectively.
To clarify the influence of 5hmC in TE genes, gene expression information was obtained from RNA-Seq technology and expressed genes were defined by RPKM >1.99, 1.83, and 1.7 for 93-11, PA64s, and LYP9, respectively (Supplementary Fig. S10 at JXB online), which were calculated following the methods reported by He et al. (2010). The correlation analysis between 5hmC and RPKM revealed that only a small portion (e.g. 1.52%, 20 out of 1320 in 93-11) of genes with MRPs were actively expressed, and most genes (98.48%, 1300 out of 1320) with MRPs were transcriptionally silent (Table 3; Fig. 5C; typical examples are displayed in Supplementary Fig. S11). Among the 20 actively expressed MRP target genes, three (15%) were TE genes and 17 (85%) were non-TE genes. On the other hand, among the 1300 inactive MRP target genes, 1130 (86.92%) and 170 (13.08%) were TE genes and non-TE genes, respectively (Table 3; Fig. 5D). The correlation results indicated that 5hmC modification may play a different role in TE and non-TE genes, in concert with its dual roles reported in mammals (Wu et al., 2011). Among the 1133 TE genes with MRPs in 93-11, three (0.26%) genes were actively expressed, whereas 1130 (99.74%) were not expressed, and similar results were also observed in PA64s and LYP9 (Table 3). If 5hmC modification does have a role in TE genes, it might repress their activity.
Table 3.
A summary of the numbers of TE and non-TE genes with more reliable peaks (MRPs)
| 93-11 | PA64s | LYP9 | |
|---|---|---|---|
| Gene number with MRPs | 1320 | 807 | 1196 |
| TE genes | 1133 | 688 | 1037 |
| Non-TE genes | 187 | 119 | 159 |
| Expressed genes | 20 | 13 | 22 |
| TE genes | 3 | 2 | 3 |
| Non-TE genes | 17 | 11 | 19 |
| Repressed gene number | 1300 | 794 | 1174 |
| TE genes | 1130 | 686 | 1034 |
| Non-TE genes | 170 | 108 | 140 |
By further investigating 5hmC in different TE gene families, it was found that 5hmC peaks were significantly (P=1.03×10⁻⁷; Fisher’s exact test) enriched in retrotransposon genes, especially in the Ty3-gypsy family of 93-11 (Fig. 5E; Tables 4, 5), which was very much in agreement with LYP9 and PA64s (Tables 4, 5; Supplementary Fig. S12 at JXB online). All these results suggested that 5hmC may have roles in its direct target genes, especially in retrotransposon genes. Additionally, the Gene Ontology (GO) functional analysis indicated that MRP target genes were significantly enriched in the functional categories of chromatin assembly and chromatin organization (P-value <0.01, Fisher’s exact test) (Fig. 5F), suggesting that 5hmC may have effect on chromosome structure.
Table 4.
A summary of the numbers of MRPs targets, whole-genome and randomly simulated retrotransposon and transposon genes, and the P-values obtained from Fisher’s exact test
| Retrotransposon | Transposon | Fisher’s exact test | ||
|---|---|---|---|---|
| No. of TEs across the whole genome | 12 295 | 3914 | ||
| 93-11 | No. of MRP target TEs | 969 | 164 | 8.63E-15a |
| No. of TEs randomly simulated | 487 | 161 | 1.03E-07b | |
| LYP9 | No. of MRP target TEs | 886 | 151 | 1.85E-13a |
| No. of TEs randomly simulated | 440 | 146 | 3.42E-07b | |
| PA64s | No. of MRP target TEs | 583 | 105 | 2.75E-08a |
| No. of TEs randomly simulated | 307 | 101 | 1.61E-04b |
a The P-value was calculated using the number of whole-genome TEs and the number of retrotransposon and transposon MRP target TEs.
b The P-value was calculated using the number of randomly simulated TEs and and the number of retrotransposon and transposon MRP target TEs.
Table 5.
A summary of the numbers of MRPs targets, the whole-genome and randomly simulated retrotransposon and transposon genes in different species, and the P-values obtained from the χ2 test
| Retrotransposon | ||||||||
|---|---|---|---|---|---|---|---|---|
| Ty1-copia | Ty3-gypsy | LINE | SINE | Centromere-specific | Unclassified | χ2 test | ||
| No. of TEs across the whole genome | 798 | 3782 | 114 | 12 | 638 | 6951 | ||
| 93-11 | No. of MRP target TEs | 16 | 536 | 0 | 0 | 16 | 401 | 2.20E-16a |
| No. of TEs randomly simulated | 33 | 164 | 4 | 0 | 19 | 266 | NA | |
| LYP9 | No. of MRP target TEs | 18 | 522 | 1 | 0 | 13 | 332 | 2.20E-16a |
| No. of TEs randomly simulated | 30 | 148 | 4 | 0 | 17 | 241 | NA | |
| PA64s | No. of MRP target TEs | 9 | 355 | 0 | 0 | 8 | 211 | 2.20E-16a |
| No. of TEs randomly simulated | 21 | 104 | 3 | 0 | 12 | 167 | NA | |
| Transposon | ||||||||
| Ac/Ds | CACTA, En/Spm | Mutator | Mariner | ping/pong/SNOOPY | Unclassified | χ2 test | ||
| No. of TEs across the whole genome | 30 | 2129 | 63 | 43 | 114 | 1535 | ||
| 93-11 | No. of MRP target TEs | 0 | 72 | 0 | 0 | 3 | 89 | 0.0024a |
| No. of TEs randomly simulated | 1 | 93 | 3 | 1 | 3 | 60 | 0.0208b | |
| LYP9 | No. of MRP target TEs | 0 | 66 | 1 | 0 | 1 | 83 | 0.0025a |
| No. of TEs randomly simulated | 1 | 85 | 2 | 1 | 3 | 54 | 0.0379b | |
| PA64s | No. of MRPs target TEs | 0 | 41 | 3 | 0 | 2 | 59 | 0.0096a |
| No. of TEs randomly simulated | 0 | 59 | 2 | 0 | 2 | 37 | NA | |
NA indicatess that the R software could not calculate the P-value.
a The P-value was calculated using the number of whole-genome TEs and the number of MRP target TEs.
b The P-value was calculated using the number of randomly simulated TEs and the number of MRP target TEs.
Discussion
Recent studies have revealed that 5hmC is a bona fide constituent of mammalian DNA, owing to its presence at especially high levels in embryonic stem cells and Purkinje neurons (Globisch et al., 2010; Szulwach et al., 2011). However, the existence of 5hmC modification in plants is controversial. Although some studies have detected low levels of 5hmC in plants using various methods (such as dot-blot and mass spectrometry) (Terragni et al., 2012; Yao et al., 2012; Liu et al., 2013; Moricová et al., 2013), researchers are still doubtful about its existence and biological function because of its very low abundance and possible formation from endogenous reactive oxygen species (Liu et al., 2013; Jang et al., 2014). In this study, 5hmC modification in rice DNA was detected by dot-blot assay and its levels were quantified in various rice tissues using LC-MS/MS/MS. More importantly, thousands of 5hmC peaks were identified in panicles from three different rice cultivars using a GLIB method combined with NGS technology. The high-resolution maps of 5hmC in DNA of three different rice cultivars revealed a large number of cultivar-specific and conserved 5hmC-enriched regions, supporting the conclusion that 5hmC is an authentic DNA modification in rice. It is known that TETs are the writer and primary eraser of 5hmC in mammals (Tahiliani et al., 2009; Zhu, 2009; Law and Jacobsen, 2010; Song and He, 2011) and UHRF2 is a reader of 5hmC in mammals (Spruijt et al., 2013; Zhou et al., 2014). However, there is no functional counterpart of TETs and UHRF2 in the rice genome based on the present sequence comparative analysis. More studies are needed to explore the writer, eraser, and reader of 5hmC in plants.
The number of 5hmC peaks identified here is slightly higher than the number obtained from LC-MS/MS/MS. This inconsistency may be due to (i) the modification of 5mC to 5hmC may not be 100% at some loci; (ii) false-positive peaks introduced by the lack of specificity of the 5hmC antibody and/or bioinformatics analysis; or (iii) the inherent difference between the two techniques. In this vein, the conversion of 5mC to 5hmC at some loci may not be quantitative. Accordingly, the high confidence peaks (HCPs) were defined by setting the P-value to <10–25 which is supported by both LC-MS/MS/MS and sequencing.
The discovery of 5hmC, 5fC, and 5caC in mammals has revealed an active demethylation pathway by a successive oxidation process (Zhu, 2009; Gong and Zhu, 2011; Song et al., 2013). In plants, 5hmC may be involved in passive demethylation during cell division. First, it has been reported that Arabidopsis thaliana VIM1 protein could recognize 5hmC in vitro, and 5hmC at a CpG site may trigger VIM-mediated passive loss of cytosine methylation in vivo during Arabidopsis DNA replication (Yao et al., 2012). Second, unlike in mammals, the plant genome does not encode TET homologues that oxidize 5mC to 5hmC (Tahiliani et al., 2009; Ko et al., 2010; Wu and Zhang, 2011). Thirdly, plants possess DNA glycosylases that can cleave 5mC directly from the genome (Gehring et al., 2009; Law and Jacobsen, 2010; Jang et al., 2014). Finally, although both DME and ROS1 have glycosylase activities for 5hmC in vitro, DME exhibits higher activity toward 5mC than 5hmC, and the rate of DME-mediated excision of 5mC is 2.6-fold higher than that of 5hmC (Jang et al., 2014). Moreover, 5hmC is one of the numerous substrates of the DME/ROS1 family, just as most DNA glycosylases have a wide range of substrate specificity (Dizdaroglu et al., 1993; Bulychev et al., 1996; Schärer and Jiricny, 2001). In summary, the low abundance of 5hmC in rice may be an intermediate of passive demethylation in local regions.
5hmC is particularly enriched in gene body regions (2190, 1938, and 1326 peaks in the gene body for 93-11, LYP9, and PA64s, respectively), which is similar to the findings in animals (Song et al., 2011; Stroud et al., 2011; Szulwach et al., 2011; Xu et al., 2011). Moreover, most of those 5hmC peaks (1800, 1666, and 1114 for 93-11, LYP9, and PA64s, respectively) were in TE genes which were mainly located in heterochromatin. To increase the reliability of the results, targets of those MRPs were analysed by correlating with RNA-Seq data. It was found that only ~1.52% (20 out of 1320) of genes with MRPs were actively transcribed, and most of these expressed genes (17 out of 20) were non-TE genes. Previous studies of 5hmC in mouse embryonic stem cells revealed that 5hmC occurs on both transcriptionally active and inactive genes, and has dual functions in transcriptional regulation (Wu et al., 2011). The present results are partially in agreement with this finding at a genomic scale and extend to the plant kingdom. As is known, methylation is significantly enriched in repeated sequences such as TEs to preserve genome stability by suppressing TE activity (Zhu, 2009; Paszkowski and Whitham, 2001; Kakutani et al., 2004; Inagaki and Kakutani, 2010; Zhao and Zhou, 2012). Further work is needed to study whether 5hmC has a role in maintaining genome stability by co-operating with methylation to repress the activity of TEs.
In summary, 5hmC is a DNA modification of very low abundance in the plant genome. The detection of 5hmC modification in rice, as well as its intercultivar variation and enrichment in TE genes, will stimulate future investigations about its roles in development, maintenance of the repressive status of TEs, and cytosine demethylation.
Supplementary data
Supplementary data are available at JXB online.
Figure S1. Statistical properties of regions enriched for 5hmC modification.
Figure S2. Real-time PCR validations for three 5hmC peaks among four tissues of 93-11.
Figure S3. Comparative whole-genome distribution of 5hmC peaks among the three cultivars.
Figure S4. Genome-wide distribution of those detected 5hmC peaks compared with a 1000 times randomly simulated data set in 93-11 (A), LYP9 (B), and PA64s (C), respectively.
Figure S5. Distributions of 5hmC peaks in each class for LYP9 (A) and PA64s (B) in the whole genome.
Figure S6. Average number of 5hmC peaks per million bases in heterochromatin and euchromatin of chromosomes 4 and 10 compared with a random data set.
Figure S7. Enrichment of 5hmC in heterochromatin (HC) over euchromatin (EC) of chromosomes 4 and 10 in each class for three cultivars.
Figure S8. Distributions of 5hmC peaks in TE genes and non-TE genes compared with a random data set for 93-11 (A), PA64s (B). and LYP9 (C), respectively.
Figure S9. Distributions of 5hmC peaks in TE genes and non-TE genes in every chromosome of 93-11 (A), PA64s (B), and LYP9 (C) compared with a random data set, respectively.
Figure S10. Detection of gene expression in rice by mRNA-Seq.
Figure S11. Typical examples for expressed and silent genes with 5hmC peaks in read-level among three cultivars.
Figure S12. The numbers of retrotransposons and transposons with MRPs for LYP9 (A) and PA64s (B), respectively.
Table S1. A list of the primers used for real-time PCR.
Table S2. Identified 5hmC peaks for 93-1.
Table S3. Identified 5hmC peaks for LYP9.
Table S4. Identified 5hmC peaks for PA64s.
Acknowledegments
We would like to thank to Dr Ming Zhou and Dr Xiao-feng Cao for assistance with obtaining rice materials, Dr Li-huang Zhu for providing RNA-Seq data, and Dr Yun-gui Yang for helpful discussion. This work was supported by the National Natural Science Foundation of China [30900831, 31271372 to SS]; Beijing Nova Program [Z121105002512060 to SS]; Strategic Priority Research Program of the Chinese Academy of Science [XDA08020102 to HS]; and the National Institutes of Health of the US [R01 CA101864 to YW]. No conflict of interest is declared.
Glossary
Abbreviations:
- BWA
Burrows–Wheeler Alignment Tool
- 5caC
5-carboxylcytosine
- ChIP-seq
chromatin immunoprecipitation sequencing
- 5fC
5-formylcytosine
- β-GT
β-glucosyltransferase
- GLIB
glucosylation, periodate oxidation, biotinylation
- HCP
high confidence peak
- 5hmC
5-hydroxymethylcytosine
- 5hmdC
5-hydroxymethyl-2′-deoxycytidine
- 5hmU
5-hydroxyluracil
- 5mC
5-methylcytosine
- MRP
more reliable peak
- NGS
next-generation sequencing
- RPKM
reads per kilobase of exon model per million mapped reads
- TE
transposable element
- TET
ten-eleven translocation
- TIGR
The Institute of Genomic Research Database
- TTR
transcriptional termination regions.
References
- Bender J. 2004. DNA methylation and epigenetics. Annual Review of Plant Biology 55, 41–68. [DOI] [PubMed] [Google Scholar]
- Bhutani N, Brady JJ, Damian M, Sacco A, Corbel SY, Blau HM. 2010. Reprogramming towards pluripotency requires AID-dependent DNA demethylation. Nature 463, 1042–1047. [DOI] [PMC free article] [PubMed] [Google Scholar]
- Bulychev NV, Varaprasad CV, Dormán G, Miller JH, Eisenberg M, Grollman AP, Johnson F. 1996. Substrate apecificity of Escherichia coli MutY protein. Biochemistry 35, 13147–13156. [DOI] [PubMed] [Google Scholar]
- Cao X, Jacobsen SE. 2002. Locus-specific control of asymmetric and CpNpG methylation by the DRM and CMT3 methyltransferase genes. Proceedings of the National Academy of Sciences, USA 99, 16491–16498. [DOI] [PMC free article] [PubMed] [Google Scholar]
- Copenhaver GP, Nickel K, Kuromori T, et al. 1999. Genetic definition and sequence analysis of Arabidopsis centromeres. Science 286, 2468–2474. [DOI] [PubMed] [Google Scholar]
- Cortellino S, Xu J, Sannai M, et al. 2011. Thymine DNA glycosylase is essential for active DNA demethylation by linked deamination-base excision repair. Cell 146, 67–79. [DOI] [PMC free article] [PubMed] [Google Scholar]
- Dizdaroglu M, Laval J, Boiteux S. 1993. Substrate specificity of the Escherichia coli endonuclease III: excision of thymine- and cytosine-derived lesions in DNA produced by radiation-generated free radicals. Biochemistry 32, 12105–12111. [DOI] [PubMed] [Google Scholar]
- Erdmann RM, Souza AL, Clish CB, Gehring M. 2015. 5-Hydroxymethylcytosine is not present in appreciable quantities in Arabidopsis DNA. G3: Genes|Genomes|Genetics 5, 1–8. [DOI] [PMC free article] [PubMed] [Google Scholar]
- Ficz G, Branco MR, Seisenberger S, Santos F, Krueger F, Hore TA, Marques CJ, Andrews S, Reik W. 2011. Dynamic regulation of 5-hydroxymethylcytosine in mouse ES cells and during differentiation. Nature 473, 398–402. [DOI] [PubMed] [Google Scholar]
- Ge X, Chen W, Song S, Wang W, Hu S, Yu J. 2008. Transcriptomic profiling of mature embryo from an elite super-hybrid rice LYP9 and its parental lines. BMC Plant Biology 8, 114. [DOI] [PMC free article] [PubMed] [Google Scholar]
- Gehring M, Reik W, Henikoff S. 2009. DNA demethylation by DNA repair. Trends in Genetics 25, 82–90. [DOI] [PubMed] [Google Scholar]
- Globisch D, Münzel M, Müller M, Michalakis S, Wagner M, Koch S, Brückl T, Biel M, Carell T. 2010. Tissue distribution of 5-hydroxymethylcytosine and search for active demethylation intermediates. PLoS One 5, e15367. [DOI] [PMC free article] [PubMed] [Google Scholar]
- Goff SA, Ricke D, Lan T-H, Presting G, Wang R, Dunn M, Glazebrook J, Sessions A, Oeller P, Varma H. 2002. A draft sequence of the rice genome (Oryza sativa L. ssp. japonica). Science 296, 92–100. [DOI] [PubMed] [Google Scholar]
- Gong Z, Zhu J-K. 2011. Active DNA demethylation by oxidation and repair. Cell Research 21, 1649. [DOI] [PMC free article] [PubMed] [Google Scholar]
- Guo Junjie U, Su Y, Zhong C, Ming G-l, Song H. 2011. Hydroxylation of 5-methylcytosine by TET1 promotes active DNA demethylation in the adult brain. Cell 145, 423–434. [DOI] [PMC free article] [PubMed] [Google Scholar]
- He G, Zhu X, Elling AA, Chen L, Wang X, Guo L, Liang M, He H, Zhang H, Chen F. 2010. Global epigenetic and transcriptional trends among two rice subspecies and their reciprocal hybrids. The Plant Cell 22, 17–33. [DOI] [PMC free article] [PubMed] [Google Scholar]
- He Y-F, Li B-Z, Li Z, et al. 2011. Tet-mediated formation of 5-carboxylcytosine and its excision by TDG in,ammalian DNA. Science 333, 1303–1307. [DOI] [PMC free article] [PubMed] [Google Scholar]
- Huang Y, Pastor WA, Shen Y, Tahiliani M, Liu DR, Rao A. 2010. The behaviour of 5-hydroxymethylcytosine in bisulfite sequencing. PLoS One 5, e8888. [DOI] [PMC free article] [PubMed] [Google Scholar]
- Inagaki S, Kakutani T. 2010. Control of genic DNA methylation in Arabidopsis. Journal of Plant Research 123, 299–302. [DOI] [PubMed] [Google Scholar]
- Iqbal K, Jin S-G, Pfeifer GP, Szabó PE. 2011. Reprogramming of the paternal genome upon fertilization involves genome-wide oxidation of 5-methylcytosine. Proceedings of the National Academy of Sciences 108, 3642–3647. [DOI] [PMC free article] [PubMed] [Google Scholar]
- Ito S, D’Alessio AC, Taranova OV, Hong K, Sowers LC, Zhang Y. 2010. Role of Tet proteins in 5mC to 5hmC conversion, ES-cell self-renewal and inner cell mass specification. Nature 466, 1129–1133. [DOI] [PMC free article] [PubMed] [Google Scholar]
- Iyer LM, Tahiliani M, Rao A, Aravind L. 2009. Prediction of novel families of enzymes involved in oxidative and other complex modifications of bases in nucleic acids. Cell Ccycle 8, 1698–1710. [DOI] [PMC free article] [PubMed] [Google Scholar]
- Jang H, Shin H, Eichman BF, Huh JH. 2014. Excision of 5-hydroxymethylcytosine by DEMETER family DNA glycosylases. Biochemical and Biophysical Research Communications 446, 1067–1072. [DOI] [PMC free article] [PubMed] [Google Scholar]
- Jin S-G, Jiang Y, Qiu R, Rauch TA, Wang Y, Schackert G, Krex D, Lu Q, Pfeifer GP. 2011. a 5-Hydroxymethylcytosine is strongly depleted in human cancers but its levels do not correlate with IDH1 mutations. Cancer Research 71, 7360–7365. [DOI] [PMC free article] [PubMed] [Google Scholar]
- Jin S-G, Kadam S, Pfeifer GP. 2010. Examination of the specificity of DNA methylation profiling techniques towards 5-methylcytosine and 5-hydroxymethylcytosine. Nucleic Acids Research 38, e125–e125. [DOI] [PMC free article] [PubMed] [Google Scholar]
- Jin S-G, Wu X, Li AX, Pfeifer GP. 2011. b Genomic mapping of 5-hydroxymethylcytosine in the human brain. Nucleic Acids Research 39, 5015–5024. [DOI] [PMC free article] [PubMed] [Google Scholar]
- Kakutani T, Kato M, Kinoshita T, Miura A. 2004. Control of development and transposon movement by DNA Methylation in Arabidopsis thaliana. Cold Spring Harbor Symposia on Quantitative Biology 69, 139–144. [DOI] [PubMed] [Google Scholar]
- Kinney SM, Chin HG, Vaisvila R, Bitinaite J, Zheng Y, Esteve P-O, Feng S, Stroud H, Jacobsen SE, Pradhan S. 2011. Tissue-specific distribution and dynamic changes of 5-hydroxymethylcytosine in mammalian genomes. Journal of Biological Chemistry 286, 24685–24693. [DOI] [PMC free article] [PubMed] [Google Scholar]
- Ko M, Huang Y, Jankowska AM, Pape UJ, Tahiliani M, Bandukwala HS, An J, Lamperti ED, Koh KP, Ganetzky R. 2010. Impaired hydroxylation of 5-methylcytosine in myeloid cancers with mutant TET2. Nature 468, 839–843. [DOI] [PMC free article] [PubMed] [Google Scholar]
- Koh KP, Yabuuchi A, Rao S, et al. 2011. Tet1 and Tet2 regulate 5-hydroxymethylcytosine production and cell lineage specification in mouse embryonic stem cells. Cell Stem Cell 8, 200–213. [DOI] [PMC free article] [PubMed] [Google Scholar]
- Kondo H, Shiraya T, Wada KC, Takeno K. 2010. Induction of flowering by DNA demethylation in Perilla frutescens and Silene armeria: heritability of 5-azacytidine-induced effects and alteration of the DNA methylation state by photoperiodic conditions. Plant Science 178, 321–326. [Google Scholar]
- Kriaucionis S, Heintz N. 2009. The nuclear DNA base 5-hydroxymethylcytosine is present in Purkinje neurons and the brain. Science 324, 929–930. [DOI] [PMC free article] [PubMed] [Google Scholar]
- Laird A, Thomson JP, Harrison DJ, Meehan RR. 2013. 5-Hydroxymethylcytosine profiling as an indicator of cellular state. Epigenomics 5, 655–669. [DOI] [PubMed] [Google Scholar]
- Law JA, Jacobsen SE. 2010. Establishing, maintaining and modifying DNA methylation patterns in plants and animals. Nature Reviews Genetics 11, 204–220. [DOI] [PMC free article] [PubMed] [Google Scholar]
- Li H, Durbin R. 2009. Fast and accurate short read alignment with Burrows–Wheeler transform. Bioinformatics 25, 1754–1760. [DOI] [PMC free article] [PubMed] [Google Scholar]
- Li W, Liu M. 2011. Distribution of 5-hydroxymethylcytosine in different human tissues. Journal of Nucleic Acids 2011, 5. [DOI] [PMC free article] [PubMed] [Google Scholar]
- Liu S, Dunwell TL, Pfeifer GP, Dunwell JM, Ullah I, Wang Y. 2013. Detection of oxidation products of 5-methyl-2′-deoxycytidine in Arabidopsis DNA. PLoS One 8, e84620. [DOI] [PMC free article] [PubMed] [Google Scholar]
- Münzel M, Globisch D, Carell T. 2011. 5-Hydroxymethylcytosine, the sixth base of the genome. Angewandte Chemie International Edition 50, 6460–6468. [DOI] [PubMed] [Google Scholar]
- Marfil C, Asurmendi S, Masuelli R. 2012. Changes in micro RNA expression in a wild tuber-bearing Solanum species induced by 5-azacytidine treatment. Plant Cell Reports 31, 1449–1461. [DOI] [PubMed] [Google Scholar]
- Moricová P, Ondřej V, Navrátilová B, Luhová L. 2013. Changes of DNA methylation and hydroxymethylation in plant protoplast cultures. Acta Biochimica Polonica 60, 33–36. [PubMed] [Google Scholar]
- Nestor CE, Ottaviano R, Reddington J, Sproul D, Reinhardt D, Dunican D, Katz E, Dixon JM, Harrison DJ, Meehan R. 2012. Tissue type is a major modifier of the 5-hydroxymethylcytosine content of human genes. Genome Research 22, 467–477. [DOI] [PMC free article] [PubMed] [Google Scholar]
- Ouyang S, Zhu W, Hamilton J, Lin H, Campbell M, Childs K, Thibaud-Nissen F, Malek RL, Lee Y, Zheng L. 2007. The TIGR rice genome annotation resource: improvements and new features. Nucleic Acids Research 35, D883–D887. [DOI] [PMC free article] [PubMed] [Google Scholar]
- Pastor WA, Pape UJ, Huang Y, Henderson HR, Lister R, Ko M, McLoughlin EM, Brudno Y, Mahapatra S, Kapranov P. 2011. Genome-wide mapping of 5-hydroxymethylcytosine in embryonic stem cells. Nature 473, 394–397. [DOI] [PMC free article] [PubMed] [Google Scholar]
- Paszkowski J, Whitham SA. 2001. Gene silencing and DNA methylation processes. Current Opinion in Plant Biology 4, 123–129. [DOI] [PubMed] [Google Scholar]
- Pfeifer G, Xiong W, Hahn M, Jin S-G. 2014. The role of 5-hydroxymethylcytosine in human cancer. Cell and Tissue Research 356, 631–641. [DOI] [PMC free article] [PubMed] [Google Scholar]
- Robertson J, Robertson AB, Klungland A. 2011. The presence of 5-hydroxymethylcytosine at the gene promoter and not in the gene body negatively regulates gene expression. Biochemical and Biophysical Research Communications 411, 40–43. [DOI] [PubMed] [Google Scholar]
- Ruzov A, Tsenkina Y, Serio A, et al. 2011. Lineage-specific distribution of high levels of genomic 5-hydroxymethylcytosine in mammalian development. Cell Research 21, 1332–1342. [DOI] [PMC free article] [PubMed] [Google Scholar]
- Schärer OD, Jiricny J. 2001. Recent progress in the biology, chemistry and structural biology of DNA glycosylases. Bioessays 23, 270–281. [DOI] [PubMed] [Google Scholar]
- Song C-X, He C. 2011. The hunt for 5-hydroxymethylcytosine: the sixth base. Epigenomics 3, 521–523. [DOI] [PMC free article] [PubMed] [Google Scholar]
- Song C-X, Szulwach KE, Dai Q, Fu Y, Mao S-Q, Lin L, Street C, Li Y, Poidevin M, Wu H. 2013. Genome-wide profiling of 5-formylcytosine reveals its roles in epigenetic priming. Cell 153, 678–691. [DOI] [PMC free article] [PubMed] [Google Scholar]
- Song C-X, Szulwach KE, Fu Y, et al. 2011. Selective chemical labeling reveals the genome-wide distribution of 5-hydroxymethylcytosine. Nature Biotechnology 29, 68–72. [DOI] [PMC free article] [PubMed] [Google Scholar]
- Song S, Qu H, Chen C, Hu S, Yu J. 2007. Differential gene expression in an elite hybrid rice cultivar (Oryza sativa, L) and its parental lines based on SAGE data. BMC Plant Biology 7, 49. [DOI] [PMC free article] [PubMed] [Google Scholar]
- Spruijt Cornelia G, Gnerlich F, Smits Arne H, et al. 2013. Dynamic readers for 5-(hydroxy)methylcytosine and its oxidized derivatives. Cell 152, 1146–1159. [DOI] [PubMed] [Google Scholar]
- Stroud H, Feng S, Morey Kinney S, Pradhan S, Jacobsen SE. 2011. 5-Hydroxymethylcytosine is associated with enhancers and gene bodies in human embryonic stem cells. Genome Biology 12, R54. [DOI] [PMC free article] [PubMed] [Google Scholar]
- Szulwach KE, Li X, Li Y, Song C-X, Han JW, Kim S, Namburi S, Hermetz K, Kim JJ, Rudd MK. 2011. Integrating 5-hydroxymethylcytosine into the epigenomic landscape of human embryonic stem cells. PLoS Genetics 7, e1002154. [DOI] [PMC free article] [PubMed] [Google Scholar]
- Szwagierczak A, Bultmann S, Schmidt CS, Spada F, Leonhardt H. 2010. Sensitive enzymatic quantification of 5-hydroxymethylcytosine in genomic DNA. Nucleic Acids Research 38, e181–e181. [DOI] [PMC free article] [PubMed] [Google Scholar]
- Tahiliani M, Koh KP, Shen Y, Pastor WA, Bandukwala H, Brudno Y, Agarwal S, Iyer LM, Liu DR, Aravind L. 2009. Conversion of 5-methylcytosine to 5-hydroxymethylcytosine in mammalian DNA by MLL partner TET1. Science 324, 930–935. [DOI] [PMC free article] [PubMed] [Google Scholar]
- Taylor SE, Smeriglio P, Dhulipala L, Rath M, Bhutani N. 2014. A global increase in 5-hydroxymethylcytosine levels marks osteoarthritic chondrocytes. Arthritis and Rheumatology 66, 90–100. [DOI] [PubMed] [Google Scholar]
- Terragni J, Bitinaite J, Zheng Y, Pradhan S. 2012. Biochemical characterization of recombinant β-glucosyltransferase and analysis of global 5-hydroxymethylcytosine in unique genomes. Biochemistry 51, 1009–1019. [DOI] [PMC free article] [PubMed] [Google Scholar]
- Turcotte K, Srinivasan S, Bureau T. 2001. Survey of transposable elements from rice genomic sequences. The Plant Journal 25, 169–179. [DOI] [PubMed] [Google Scholar]
- Williams K, Christensen J, Helin K. 2012. DNA methylation: TET proteins—guardians of CpG islands? EMBO Reports 13, 28–35. [DOI] [PMC free article] [PubMed] [Google Scholar]
- Williams K, Christensen J, Pedersen MT, Johansen JV, Cloos PAC, Rappsilber J, Helin K. 2011. TET1 and hydroxymethylcytosine in transcription and DNA methylation fidelity. Nature 473, 343–348. [DOI] [PMC free article] [PubMed] [Google Scholar]
- Wu H, D’Alessio AC, Ito S, Wang Z, Cui K, Zhao K, Sun YE, Zhang Y. 2011. Genome-wide analysis of 5-hydroxymethylcytosine distribution reveals its dual function in transcriptional regulation in mouse embryonic stem cells. Genes and Development 25, 679–684. [DOI] [PMC free article] [PubMed] [Google Scholar]
- Wu H, Zhang Y. 2011. Tet1 and 5-hydroxymethylation: a genome-wide view in mouse embryonic stem cells. Cell Cycle 10, 2428–2436. [DOI] [PMC free article] [PubMed] [Google Scholar]
- Xu Y, Wu F, Tan L, Kong L, Xiong L, Deng J, Barbera AJ, Zheng L, Zhang H, Huang S. 2011. Genome-wide regulation of 5hmC, 5mC, and gene expression by Tet1 hydroxylase in mouse embryonic stem cells. Molecular Cell 42, 451–464. [DOI] [PMC free article] [PubMed] [Google Scholar]
- Yan H, Jiang J. 2007. Rice as a model for centromere and heterochromatin research. Chromosome Research 15, 77–84. [DOI] [PubMed] [Google Scholar]
- Yang H, Liu Y, Bai F, et al. 2013. Tumor development is associated with decrease of TET gene expression and 5-methylcytosine hydroxylation. Oncogene 32, 663–669. [DOI] [PMC free article] [PubMed] [Google Scholar]
- Yao B, Jin P. 2014. Cytosine modifications in neurodevelopment and diseases. Cellular and Molecular Life Sciences 71, 405–418. [DOI] [PMC free article] [PubMed] [Google Scholar]
- Yao Q, Song C-X, He C, Kumaran D, Dunn JJ. 2012. Heterologous expression and purification of Arabidopsis thaliana VIM1 protein: In vitro evidence for its inability to recognize hydroxymethylcytosine, a rare base in Arabidopsis DNA. Protein Expression and Purification 83, 104–111. [DOI] [PubMed] [Google Scholar]
- Yu J, Hu S, Wang J, Wong GK-S, Li S, Liu B, Deng Y, Dai L, Zhou Y, Zhang X. 2002. A draft sequence of the rice genome (Oryza sativa L. ssp. indica). Science 296, 79–92. [DOI] [PubMed] [Google Scholar]
- Yu M, Hon GC, Szulwach KE, Song C-X, Zhang L, Kim A, Li X, Dai Q, Shen Y, Park B. 2012. Base-resolution analysis of 5-hydroxymethylcytosine in the mammalian genome. Cell 149, 1368–1380. [DOI] [PMC free article] [PubMed] [Google Scholar]
- Yuan Q, Ouyang S, Liu J, Suh B, Cheung F, Sultana R, Lee D, Quackenbush J, Buell CR. 2003. The TIGR rice genome annotation resource: annotating the rice genome and creating resources for plant biologists. Nucleic Acids Research 31, 229–233. [DOI] [PMC free article] [PubMed] [Google Scholar]
- Zhang J-Z, Mei L, Liu R, Khan MRG, Hu C-G. 2014. Possible involvement of locus-specific methylation on expression regulation of LEAFY homologous gene (CiLFY) during Precocious trifoliate orange phase change process. PLoS One 9, e88558. [DOI] [PMC free article] [PubMed] [Google Scholar]
- Zhang X, Yazaki J, Sundaresan A, Cokus S, Chan SW-L, Chen H, Henderson IR, Shinn P, Pellegrini M, Jacobsen SE. 2006. Genome-wide high-resolution mapping and functional analysis of DNA methylation in Arabidopsis. Cell 126, 1189–1201. [DOI] [PubMed] [Google Scholar]
- Zhang Y, Liu T, Meyer CA, Eeckhoute J, Johnson DS, Bernstein BE, Nusbaum C, Myers RM, Brown M, Li W. 2008. Model-based analysis of ChIP-Seq (MACS). Genome Biology 9, R137. [DOI] [PMC free article] [PubMed] [Google Scholar]
- Zhao W, Liu W, Tian D, et al. 2011. wapRNA: a web-based application for the processing of RNA sequences. Bioinformatics 27, 3076–3077. [DOI] [PubMed] [Google Scholar]
- Zhao Y, Zhou D-X. 2012. Epigenomic modification and epigenetic regulation in rice. Journal of Genetics and Genomics 39, 307–315. [DOI] [PubMed] [Google Scholar]
- Zhou T, Xiong J, Wang M, Yang N, Wong J, Zhu B, Xu R-M. 2014. Structural basis for hydroxymethylcytosine recognition by the SRA domain of UHRF2. Molecular Cell 54, p879–886. [DOI] [PubMed] [Google Scholar]
- Zhu J-K. 2009. Active DNA demethylation mediated by DNA glycosylases. Annual Review of Genetics 43, 143. [DOI] [PMC free article] [PubMed] [Google Scholar]
Associated Data
This section collects any data citations, data availability statements, or supplementary materials included in this article.