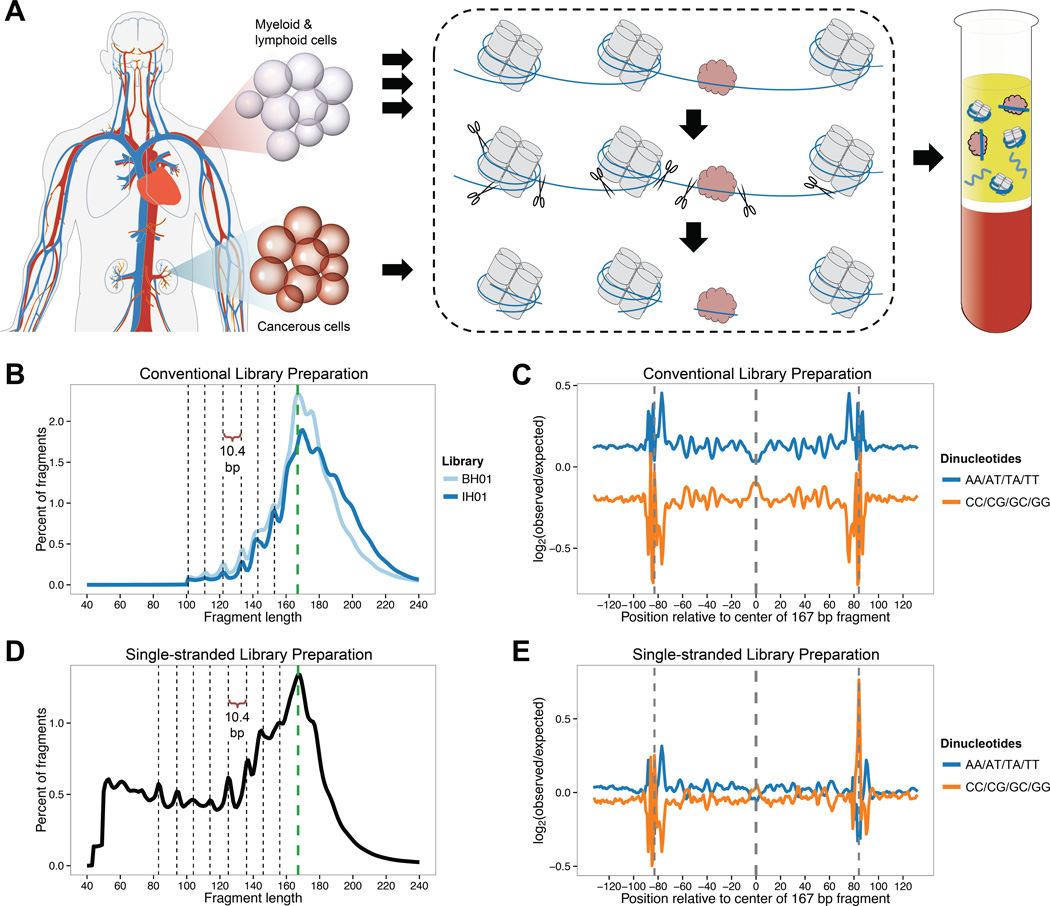
Figure 1. Origins and characteristics of cfDNA fragments in human plasma.
(A) Schematic overview of cfDNA fragmentation. Apoptotic or necrotic cell death results in near-complete digestion of native chromatin. Protein-bound DNA fragments, typically associated with histones or TFs, preferentially survive digestion and are released into the circulation, while naked DNA is lost. Fragments can be recovered from peripheral blood plasma following proteinase treatment. In healthy individuals, cfDNA is primarily derived from myeloid and lymphoid cell lineages, but contributions from one or more additional tissues may be present in certain medical conditions. (B) Fragment length of cfDNA observed with conventional sequencing library preparation, inferred from alignment of paired-end reads. A reproducible peak in fragment length at 167 bp (green dashed line) is consistent with association with chromatosomes. Additional peaks evidence ~10.4 bp periodicity, corresponding to the helical pitch of DNA on the nucleosome core. Enzymatic end-repair during library preparation removes 5’ and 3’ overhangs and may obscure true cleavage sites. (C) Dinucleotide composition of 167 bp fragments and flanking genomic sequence in conventional libraries. Observed dinucleotide frequencies in the BH01 library were compared to expected frequencies from simulated fragments. (D) Fragment length of cfDNA in single-stranded sequencing library preparation. No enzymatic end-repair is performed to template molecules during library preparation. Short fragments of 50–120 bp are highly enriched compared to conventional libraries. While ~10.4 bp periodicity remains, its phase is shifted by ~3 bp. (E) Dinucleotide composition of 167 bp fragments and flanking genomic sequence in single-stranded library IH02, calculated as in (C). The apparent difference in the background level of bias between BH01 and IH02 relate to differences between the simulations, rather than the real libraries (data not shown). See also Figure S1 and Table S1.

