Abstract
Background
High-density DNA microarrays require automatic feature extraction methodologies and softwares. These can be a potential source of non-reproducibility of gene expression measurements. Variation in feature location or in signal integration methodology may be a significant contribution to the observed variance in gene expression levels.
Results
We explore sources of variability in feature extraction from DNA microarrays on Nylon membrane with radioactive detection. We introduce a mathematical model of the signal emission and derive methods for correcting biases such as overshining, saturation or variation in probe amount. We also provide a quality metric which can be used qualitatively to flag weak or untrusted signals or quantitatively to modulate the weight of each experiment or gene in higher level analyses (clustering or discriminant analysis).
Conclusions
Our novel feature extraction methodology, based on a mathematical model of the radioactive emission, reduces variability due to saturation, neighbourhood effects and variable probe amount. Furthermore, we provide a fully automatic feature extraction software, BZScan, which implements the algorithms described in this paper.
Background
High-density DNA microarray technologies are now routinely used in medical and biological research [1-6]. They provide a systematic means of exploring metabolic pathways and also allow more accurate prognosis in complex diseases, typically cancer. However, the multiplicity of technological platforms used as well as the down-sizing of assays, which increases the noise over signal ratio, make reproducibility and comparability of results harder to achieve. Indeed, these have been put into question in recent publications [7,8]. In particular [8] suggests that data processing and feature extraction methodology are important sources of non-reproducibility. It is therefore important to provide algorithms and methods that reduce variability in measurements as well as reduce human intervention in the process of data acquisition. This is a prerequisite to the goals of data sharing as promoted by the MGED group [9-11].
In this paper we focus on cDNA spotted Nylon microarrays combined with radioactive labelling of target mRNA [12-27]. This DNA microarray technology is easy to set up, cheap and allows a sensitive detection without target amplification from lower amounts of mRNA target than most other technologies [13,25]. This technology suffers from a specific drawback, the overshining (or "neighbourhood") effect whereby signals from strong features and their neighbours may mix together, making individual features hard to discriminate. Less specific issues are also present with this detection technology: scanner saturation (signals may be stronger than the scanner's range upper limit), noise and variability of the measured signal as a function of the amount of spotted probe. However, radioactive detection is not impaired by the presence of dust on the array surface, unlike fluorescence detection. Another advantage of the radioactive signal which has been overlooked so far is the very distinctive shape of a radioactive spot, which can be theoretically modelled and experimentally fitted to extract the fundamental parameters of the signal source. In this paper, we take advantage of this approach to compute corrections to the various sources of variability identified above. In addition we provide a quantitative measure of signal quality and show how this can be used in gene expression data analysis.
Methodology
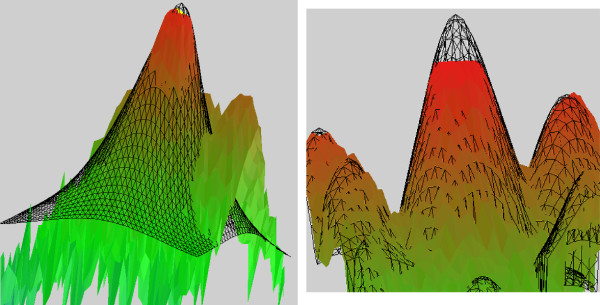
Our approach in this paper is based on a theoretical fit to the measured signal which has been deduced from a model of radioactive emission (see Figure 1). We therefore have an alternative way of quantifying a feature's signal: rather than integrating the measured intensities over the feature's surface, we integrate the fit function. A second ingredient of our methodology is the use of an automatically adjusted diameter for each feature, thereby modulating the surface over which signal or fit are integrated in the process of extracting a single intensity value for each feature. We also provide a qualitative (present/absent) flag for each spot which evaluates if the feature's shape is spot-like or not, and a quantitative quality metric QM on a 0 to 1 scale. This is used to evaluate the quality of the measured signal, compared to an ideal radioactive spot.
Figure 1.
3D representation of our algorithms. Vertical scale is signal intensity. The wireframe is the fit and the solid surface is the measured signal. Left: overshining correction scheme. The fit is extended under the neighbouring spot and determines the amount of signal due to overshining. Right: Saturation correction scheme. The fit extends beyond the saturation limit and reconstructs the expected shape of the spot.
Software Implementation
All the methods presented in this paper have been implemented in the software BZScan, which is an open source Java tool (under the X.org license http://www.x.org/Downloads_terms.html, a copy-left, GPL-compatible license): the Java code sources and the compiled jar file are available on the web site http://tagc.univ-mrs.fr/bioinformatics/bzscan and freely re-distributable. It can be run directly from the latter web site using Java Web Start.
BZScan is a fully automatic feature extraction platform in the sense that it locates and quantifies features corresponding to a predefined array design in a single operation. It detects and proposes corrections to all major biases: overshining, saturation, variable spot diameter. It provides analysis tools (quality flags and metrics, plots and statistics) for quality control, and it exports data in MAGE-ML format [9] for better interaction with third party software and databases. Furthermore, a whole set of images can be processed in walkaway "batch mode" without any user intervention (up to 300 images are processed in 24 hours in fully automatic mode on a standard PC). Automation improves reproducibility and standardisation by reducing user-dependent biases. BZScan is therefore well-suited to high-throughput MIAME-compliant [28] research projects.
BZScan is more automatic than Xdigitise [29] or FUJI's ArrayGauge (the latter does not provide batch quantification nor fully automatic feature location) and offers more analysis and correction functionalities. It is as complete a tool as GridGrinder http://gridgrinder.sourceforge.net/ but additionally offers radioactivity-specific insight and runs on all operating systems. While several different overshining correction schemes [17,21] have been proposed, few softwares offer variable spot diameter quantification and saturation correction.
Results and Discussion
We have designed a feature extraction benchmark based on several hybridisations, spotting patterns and scanning parameters. It provides data for a systematic exploration of saturation, overshining and spotting effects. Three array types have been used, named Array A1–A3 and described in the Methods section.
Comparison with alternative quantification softwares
We have compared quantifications of the same oligonucleotide hybridisation (Array A1) with FUJI's ArrayGauge software (which was routinely used in our laboratory) and with our method (BZScan software), see Figure 4. The correlation in log between the two outputs is 0.996 for the image intensity values and 0.964 for the fitted intensities.
Figure 4.
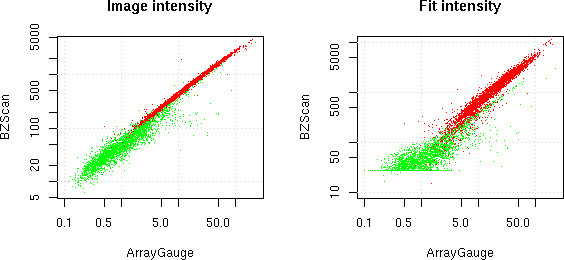
Software comparison. FUJI's ArrayGauge quantification against two BZScan quantification modes. Image intensities (left) and fit intensities (right). Well-shaped spots are in red, badly shaped spots in green.
Remark that using the intensity values amounts to using the same quantification method as in ArrayGauge. This correlation is therefore a test of the consistency between ArrayGauge's lengthy manual adjustment of spot positions and BZScan automatic feature location. The high correlation between the two outcomes confirms that all spots where rightly located by the automatic search. This is important for the quality of the fit. When using the fit for signal quantification, the correlation with ArrayGauge stays high because only few spots need any of the corrections discussed below. These few spots may however yield important biological information and reliable quantification of all of them is needed.
Correction of saturation
Scanners have a limited measurement range which a particular signal may exceed. This results in a saturation effect whereby some features are underestimated by conventional extraction methods [19], see Figure 1, right part. We propose to correct this effect by using a mathematical fit computed on unsaturated values only, and then integrating the values of the fit function, which are allowed to grow beyond the scanner limit. To demonstrate the validity of this approach, we have used increasing exposure times for the same hybridisation of Array A1. Figure 5 shows the effect of saturation by conventional methods and the efficiency of our correction scheme.
Figure 5.
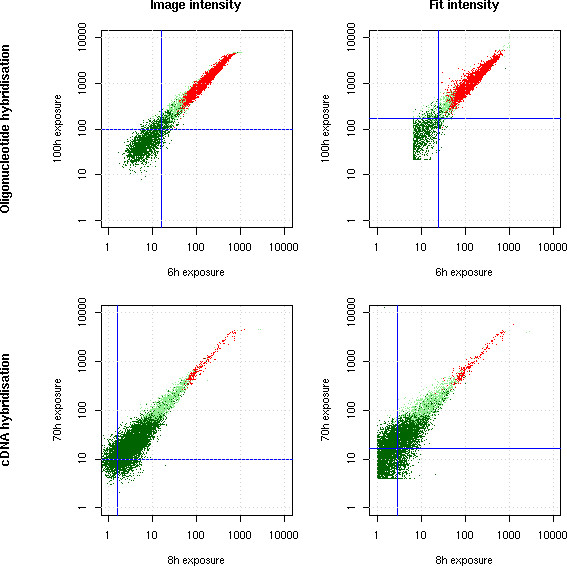
Saturation correction. Two hybridisations were scanned after two different exposure times each (6 h against 100 h for an oligonucleotide hybridisation and 8 h against 70 h for a cDNA hybridisation). The image quantification mode saturates while the fit quantification preserves a linear increase in signal. The red points are detected as present in both experiments, the light green in one of the experiments and the dark green in neither (see Image Processing section for a description of this flag). Blue lines indicate background levels (median background computed by the fit equation (1). Notice that saturated spots are detected as absent in the longer exposures because of their flat top.
Moreover, the spot quality factors QM (see Methods) show that longer exposures improve spot morphology (upper part of Figure 6). This means that we can improve signal quality of weak sources by using longer exposures without losing on strong features because of saturation. Remark that the minimum QM seems to be higher at higher densities. This is because the noise over signal ratio tends to be lower when signal plus background is high. Therefore spots near the background level have a higher QM if the background level is higher.
Figure 6.
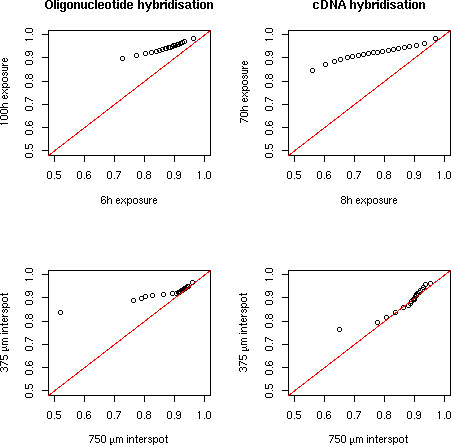
Distribution of QM values. Quantile plots (20 quantiles) of QM for the same hybridisation scanned after different exposure times (6 h against 100 h for an oligonucleotide hybridisation and 8 h against 70 h for a cDNA hybridisation) and for the hybridisation on the same spotting pattern replicated at two different densities (375 μm and 750 μm inter-spot distance).
Correction of overshining
The phenomenon of overshining, which is specific to the radioactive detection technology, is well-documented [17,19,21], see Figure 1, left part. In particular it is the main limitation on spotting density in such microarrays. Overshining is due to the slow spatial decay of radioactive signals (a power law, see equation (1)) which implies that a strong spot may produce a non-negligible signal over the surface area of its neighbours, resulting in an overestimation of the latter features. High-density spot patterns therefore yield measured signals which are convolutions of several independent sources, and the deconvolution, if required, is a non-trivial task (see [17] for a direct approach based on Fourier transform).
To investigate the overshining effect, we have used Array A2 on which the same 96 spot pattern was replicated five times at three different densities: 375 μm interspot distance (in triplicate), 750 μm and 1500 μm interspot distance. Comparison of the same spots at low and high density clearly shows the effect of overshining (Figure 7): some features are overestimated at the higher density, and they actually correspond to neighbours of very strong spots. We see in Figure 6 (lower part) that signal quality (as measured by the QM) is mostly unaffected by variations in spotting density.
Figure 7.
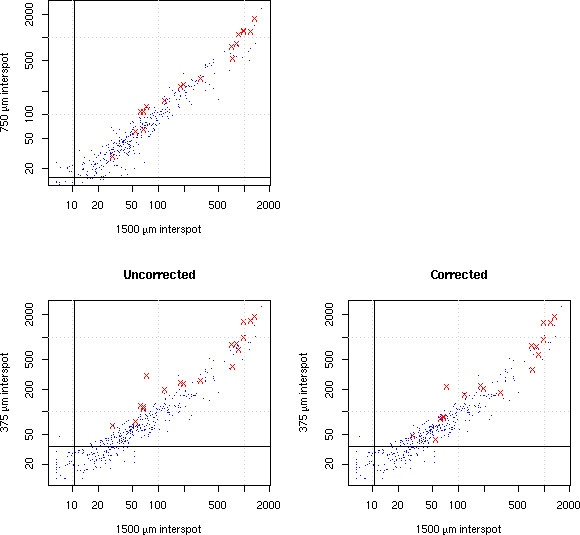
Overshining correction. The same spotting pattern at three different densities: 375 μm, 750 μm, and 1500 μm inter-spot distance. Comparison of the 375 μm pattern with the 1500 μm one shows a larger dispersion than the 750 μm/1500 μm comparison: this is the overshining effect. The red points are the spots detected as significantly affected by overshining in the 375 μm density. Applying a correction computed via the fit reduces the dispersion. Black lines indicate background levels.
We can detect and correct the overshining effect in the following way: feature F has four nearest neighbours. The fit to a neighbour's intensities is extended and integrated over the surface area of F, thereby defining the "potential correction" to F. If this correction is large relative to the maximal value of the neighbour's fit, the correction is subtracted to the quantification of F. This is repeated for each of the four neighbours of F. This scheme significantly reduces the variability (Figure 7). Out of the 384 spots of Array A2, 19 were detected as affected by overshining in the 375 μm density pattern. Correcting them as described above increases the correlation in log with the 1500 μm pattern from 0.940 to 0.942 (maximum correlation achievable by changing only those 19 data points is 0.947).
Other proposals have been made, for example [21] which is more empirical and less adaptive and therefore introduces more variability in the data, and [17] which iteratively applies Fast Fourier Transform (FFT) to the image data and is therefore computationally heavier for high-throughput studies (tens of hours per image according to their data).
Correction of variability in spotted probe amount
It is a known fact that the measured signal varies with the amount of probe fixed onto the array [19,21,30], although a strict proportionality is maybe not expected because of limited spotting and hybridisation efficiency and limited probe accessibility on the array surface. Some increase in the signal intensity should however be observed when a larger amount of probe has been spotted. However, the feature extraction does not always faithfully reflect this, resulting in a non-linear bias which is hard to correct by normalisation. We have used Array A3 as an experimental test of signal to probe amount dependence. Decreasing volumes of the same PCR product (30 μl to 0 μl) diluted in complementary amounts of water (0 μl to 30 μl) were spotted on the same array. Figure 8 shows that our fit improves on more direct methods. This is mostly due to the automatic diameter detection (equation (2), data not shown).
Figure 8.
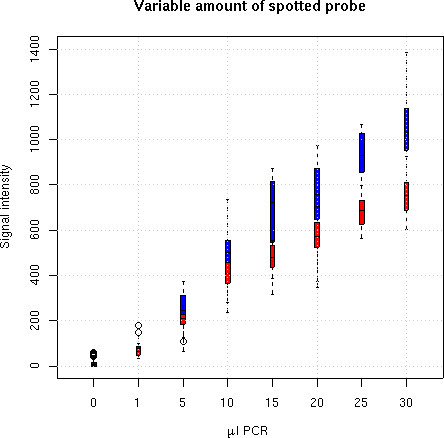
Effect of probe dilution. Variable dilutions of spotted material (dots are medians, bars are inter-quartiles). Using the fit (1) (blue) improves the positive correlation between the measured intensity and the spotted probe amount compared to traditional image (pixel value) quantification (red).
Quality Metric and clustering
We can use our QM formula (see Methods) to produce EWEIGHTs in clustering algorithms by taking the median QM over each array; similarly GWEIGHTs are computed by taking the median gene QM. Theses weights modify the measure of similarity used in clustering algorithms by giving more weight to well-measured genes and less to the noisier ones. This affects the clustering results as exemplified in Figure 9. We observe that clusters are much better delineated when using those weights, and that a noisy experiment has a lesser influence on clustering. EWEIGHTs appear to have more impact than GWEIGHTS in this particular experiment.
Figure 9.
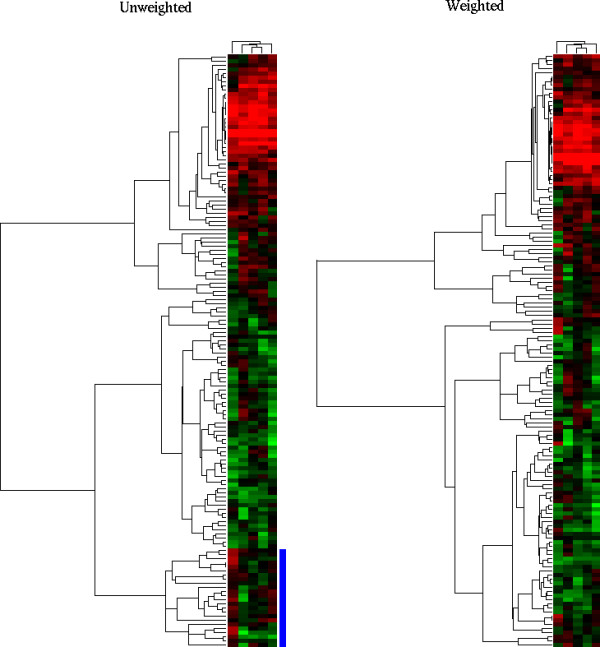
QM and clustering weights. Unweighted clustering (left) compared with weighted clustering (right), with weights defined as columns and row medians of QM. The data correspond to five different exposure of the same cDNA hybridisation. The leftmost array (the noisiest one, 8 h exposure) has a lesser influence on the determination of the clusters on the right-hand side, and these clusters appear more coherent. Note that samples (columns) are sorted in the same order on both clusterings.
See in particular the cluster highlighted in blue at the bottom of the "unweighted" figure: it is entirely determined by the first sample (column). This sample happens to have a low QM and no such cluster appears on the "weighted" figure. Since the different columns in the data actually represent the same measure, that cluster had to be spurious and caused by noise. The EWEIGHTs applied effectively down-weight columns with a higher average level of noise.
Nevertheless, the best use of the QM would be to weight each individual spot (not using a Gene/Sample median as was done here). Unfortunately most currently available software do not offer the choice of weighting each spot individually.
Conclusions
We have investigated several sources of non-reproducibility in gene expression measurement by cDNA microarrays on Nylon membrane with radioactive detection.
A mathematical modelling of the radioactive signals allows us to faithfully fit the signal. This fit provides a straightforward handle on several drawbacks of the technology: saturation (by reconstructing the missing signal beyond the saturation limit), overshining (by reconstructing the signal below the influenced feature) and spotting variability (by automatically adjusting the integration range to the source size). Additionally, it provides a direct method for estimating the measurement quality, which we have called QM. This can be used qualitatively (remove bad signals from the data) or quantitatively (by defining weights used in clustering algorithms).
Our methods have been successfully applied to microarrays from various commercial or home-made sources (see http://tagc.univ-mrs.fr/bioinformatics/bzscan). Moreover some of the methods presented in this paper can be readily applied to the more widely used glass slide arrays with fluorescent detection. It requires "blurring" the spots by convolution with a function such as equation (1). This preserves the integrity of the signal and smoothes out local irregularities and asymmetries. Feature detection and quantification can then be performed as described above, with the advantage that overshining rarely occurs, but noise, spotting effect and possibly saturation are as prominent as with any other technology.
Methods
Detailed protocols can be found in [14,23].
Array preparation
Spotting of PCR products from 384-well plates was done using either a GMS 427 (Affymetrix) or a MicroGrid II (BioRobotics) robot (see arrays details below), onto precut Nylon membranes (Pall) of size 72 × 18 mm2.
Target labelling and hybridisation
Two types of hybridisations were performed. The first, referred to as "oligonucleotide hybridisation" in the remainder of the paper, used the oligonucleotide LBP9: 5'-ACTGGCCGTCGTTTTACA-3' as target sample. This sequence is complementary to a sequence present in all PCR products spotted on our membranes. These hybridisations are normally used to calibrate the amount of PCR probe spotted at each feature location. These oligonucleotide samples were labelled with  ATP at the 5' end using T4 polynucleotide kinase.
The second kind of hybridisation performed, referred to as "cDNA hybridisation", used cDNA samples obtained by reverse transcription of mRNA (specific sample sources are detailed below). The labelling of cDNA samples is performed during reverse transcription with  dCTP.
dCTP.
Arrays and samples
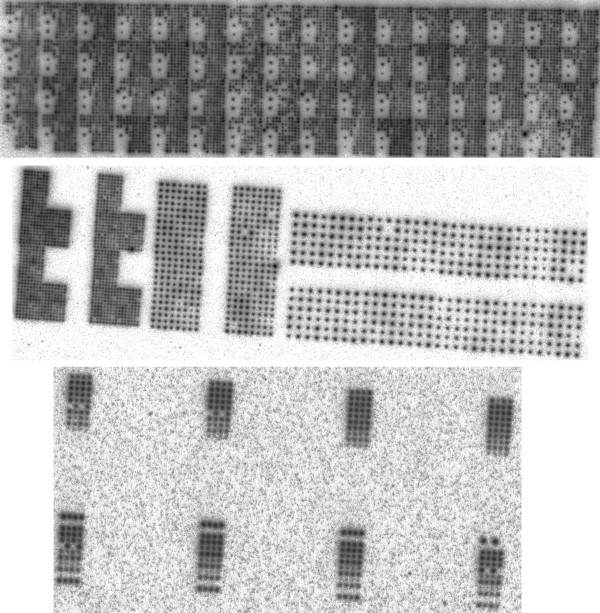
See Figure 2 for sample scans of oligonucleotide hybridisations, which reveal the spotting patterns.
Figure 2.
Array designs. From top to bottom: Array A1, Array A2 and Array A3 (oligonucleotide hybridisations).
Array A1 was spotted with the MicroGrid II robot. Each of its 64 pins spotted a 12 × 12 zone resulting in a pattern of 9216 spots. Both cDNA hybridisation (with MCF7 breast cancer cell line) and oligonucleotide hybridisation were performed.
Array A2 was spotted with the GMS 427 robot. A pattern of 384 spots was replicated 5 times at 3 different densities: 375 μm interspot distance (in triplicate), 750 μm interspot distance and 1500 μm interspot distance (see Figure 3). Both cDNA hybridisation (with Mouse Thymus extracts) and oligonucleotide hybridisation were performed.
Figure 3.

Spotting pattern for Array A2. Each color represents one complete 384 spot pattern.
Array A3 was spotted with the GMS 427 robot. All PCR products corresponded to the chlorophyll synthetase gene from Arabidopsis thaliana. A pattern of 16 × 24 spots was made. Its 24 columns corresponded to different concentrations of the same PCR product, while its 16 rows where all replicates of each other. The first 12 columns were ordered by decreasing concentration from left (30 μl PCR plus 0 μl water) to right (0 μl PCR plus 30 μl water), the remaining 12 columns were randomly re-ordered replicates of the previous 12. Only an oligonucleotide hybridisation was performed on Array A3.
Image processing
Hybridisation images were obtained using a FUJI BAS 5000 scanning system. Arrays were exposed onto a phosphoimaging plate for 6 to 100 hours (for testing purposes only, normal procedure uses 16 to 24 hours exposures) and the plate was then scanned at a resolution of 25 μm.
Automatic feature location on the image was performed using a novel dynamical algorithm: a virtual grid structure modelled on the spotting pattern is created in which each spot is replaced by a point mass tied to its four neighbours by nonlinear springs. The underlying image creates a force field equal to the image intensity gradients. A present/absent flag (taking values 1 or 0) is computed by evaluating if the falloff between the feature centre and its sides is large enough. It multiplies the gradient forces and therefore switches them off for absent or weak spots. The structure is then evolved under the action of these forces until equilibrium is reached. At equilibrium, absent spots lie midway between their neighbours. This method has been found to reduce human intervention in the quantification process, and therefore improves reproducibility of results. It is faster than previously proposed algorithms [16,31]. The present/absent flag is also useful in data analysis.
The algorithm also makes use of a present/absent flag (taking values 1 or 0) which is computed during alignment by evaluating if the falloff between the feature centre and its sides is large enough. This is used to avoid weak spots being attracted by strong neighbours during automatic alignment. It is also useful to remove absent spots from data analysis and to visually evaluate the quality of the alignment.
Signal fitting
We have computed the theoretical emission of a flat disk-shaped radioactive source. A good approximation to its emission intensity profile (above a uniform background C) is:
![]()
as a function of the distance r to to the spot centre. Figure 10 demonstrates that this is a better fit than the Gaussian used in [22,32,33], by comparison with both theoretically computed and experimentally measured data. The values of A, B and C are computed by non-linear least-square minimisation (Gauss-Newton algorithm) of the distance ∑r(F(r) - I(r))2 between the theoretical profile equation (1) and the measured pixel intensities I(r), at each feature location independently. The sum ranges over all non-saturated pixels in the feature area. The function F(r) is the theoretical fit to the measured intensity profile, C is the background noise, while A and B are related to its height and width. The fit also provides a natural length scale for the diameter of the feature:
Figure 10.
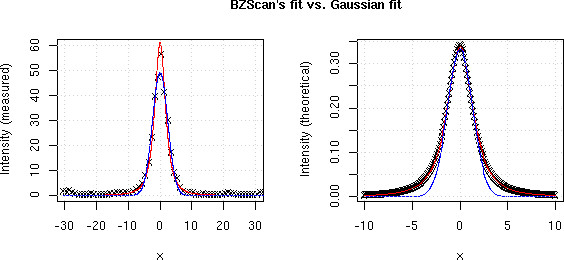
Signal fitting Comparison between BZScan's fit FPSL (red line), a Gaussian fit (blue line) and measured data (crosses on left plot) or theoretical data computed using ΦPSL (crosses on right plot).
![]()
where d0 can be tuned empirically. By "natural length scale", we mean that the ratio of integrated (theoretical) signal to total emitted signal depends on d0 only. We have compared two feature extraction methods, the "traditional" one which sums up the measured intensities Ik over the surface of a disk of fixed, predefined radius, and the new method which consists in summing the fit values Fk over the surface of a disk of diameter dfit which is different for each feature. We have found that the second method significantly reduces the main sources of variation.
Quality Metric
We compute a quality metric QM which measures how reliable a measured intensity level is, by comparing the profile of the measured signal with the theoretical function. Indeed experimental artifacts occasionally produce artificially high values in the quantification of a weak spot (radioactive specks), but this will usually have a very small QM, because this type of noise does not resemble in any way an expected signal morphology. The QM factor is used to deduce EWEIGHTs (weight of importance or quality of an experiment) and GWEIGHTs (similar measure for a gene) in subsequent clustering analysis (as in the Cluster software [34]). We use the following formula for the QM factor:
![]()
where Npix is the number of pixels in the feature area and Ik and Fk are the measured values and the fit values at each of those pixel positions. The rationale behind this formula is that we use 1 minus the noise over signal ratio rather than the more traditional signal over noise ratio. We therefore obtain a number between 0 and 1, which can be treated like a P-value. It is easy to see that a perfect feature (Ik = Fk for all k) gives a value QM = 1 and an empty feature (Ik = 0, FK > 0 for all k) gives QM = 0. This QM has been found to be a useful and reliable means of detecting measurement artifacts and reducing their influence in subsequent analysis.
Authors' contributions
SG initiated and supervised the study. FL and JR developed the methods. FL implemented the algorithms in Java, JR analysed the data. BL, AB and LL performed the experiments which were designed by BL and SG. FB, PH and RH provided feedback and biological insight, and contributed to the design of the study and of the methods. All authors read and approved the final manuscript.
Acknowledgments
Acknowledgements
Part of this research was supported by the Temblor project EU grant QLRT-2001-00015, by the CIT program of the Ligue Nationale Contre le Cancer and by Marseille-Genopole.
Contributor Information
F Lopez, Email: lopez@tagc.univ-mrs.fr.
J Rougemont, Email: Jacques.Rougemont@isb-sib.ch.
B Loriod, Email: loriod@tagc.univ-mrs.fr.
A Bourgeois, Email: bourgeois@tagc.univ-mrs.fr.
L Loï, Email: loi@tagc.univ-mrs.fr.
F Bertucci, Email: bertuccif@marseille.fnclcc.fr.
P Hingamp, Email: hingamp@tagc.univ-mrs.fr.
R Houlgatte, Email: houlgatte@tagc.univ-mrs.fr.
S Granjeaud, Email: granjeaud@tagc.univ-mrs.fr.
References
- Alizadeh A, Eisen M, Davis R, Lossos I, Rosenwald A, Boldrick J, Sabet H, Tran T, Yu X, Powell J, Yang L, Marti G, Moore T, Hudson J, Jr, Lu L, Lewis D, Tibshirani R, Sherlock G, Chan W, Greiner T, Weisenburger D, Armitage J, Warnke R, Levy R, Wilson W, Grever M, Byrd J, Botstein D, Brown P, Staudt L. Distinct types of diffuse large B-cell lymphoma identified by gene expression profiling. Nature. 2000;403:503–522. doi: 10.1038/35000501. [DOI] [PubMed] [Google Scholar]
- Beer D, Kardia S, Huang C, Giordano T, Levin A, Misek D, Lin L, Chen G, Gharib T, Thomas D, Lizyness M, Kuick R, Hayasaka S, Taylor J, Iannettoni M, Orringer M, Hanash S. Gene-expression profiles predict survival of patients with lung adenocarcinoma. Nat Med. 2002;8:816–824. doi: 10.1038/nm733. [DOI] [PubMed] [Google Scholar]
- Golub T, Slonim D, Tamayo P, Huard C, Gaasenbeek M, Mesirov J, Coller H, Loh M, Downing J, Caligiuri M, Bloomfield C, Lander E. Molecular Classification of Cancer: Class Discovery and Class Prediction by Gene Expression Monitoring. Science. 1999;286:531–537. doi: 10.1126/science.286.5439.531. [DOI] [PubMed] [Google Scholar]
- Bertucci F, Nasser V, Granjeaud S, Eisinger F, Adelaide J, Tagett R, Loriod B, Giaconia A, Benziane A, Devilard E, Jacquemier J, Viens P, Nguyen C, Birnbaum D, Houlgatte R. Gene expression profiles of poor-prognosis primary breast cancer correlate with survival. Hum Mol Genet. 2002;11:863–872. doi: 10.1093/hmg/11.8.863. [DOI] [PubMed] [Google Scholar]
- Sorlie T, Perou C, Tibshirani R, Aas T, Geisler S, Johnsen H, Hastie T, Eisen M, van de Rijn M, Jeffrey S, Thorsen T, Quist H, Matese J, Brown P, Botstein D, Eystein Lonning P, Borresen-Dale A. Gene expression patterns of breast carcinomas distinguish tumor subclasses with clinical implications. Proc Natl Acad Sci USA. 2001;98:10869–10874. doi: 10.1073/pnas.191367098. [DOI] [PMC free article] [PubMed] [Google Scholar]
- Russo G, Zegar C, Giordano A. Advantages and limitations of microarray technology in human cancer. Oncogene. 2003;22:6497–6507. doi: 10.1038/sj.onc.1206865. [DOI] [PubMed] [Google Scholar]
- Kothapalli R, Yoder S, Mane S, Loughran TJ. Microarray results: how accurate are they? BMC Bioinformatics. 2002;3:22. doi: 10.1186/1471-2105-3-22. [DOI] [PMC free article] [PubMed] [Google Scholar]
- Tan P, Downey T, Spitznagel EJ, Xu P, Fu D, Dimitrov D, Lempicki R, Raaka B, Cam M. Evaluation of gene expression measurements from commercial microarray platforms. Nucleic Acids Res. 2003;31:5676–5684. doi: 10.1093/nar/gkg763. [DOI] [PMC free article] [PubMed] [Google Scholar]
- Spellman P, Miller M, Stewart J, Troup C, Sarkans U, Chervitz S, Bernhart D, Sherlock G, Ball C, Lepage M, Swiatek M, Marks W, Goncalves J, Markel S, Iordan D, Shojatalab M, Pizarro A, White J, Hubley R, Deutsch E, Senger M, Aronow B, Robinson A, Bassett D, Stoeckert C, Jr, Brazma A. Design and implementation of microarray gene expression markup language (MAGE-ML) Genome Biology. 2002;3:research0046.1–0046.9. doi: 10.1186/gb-2002-3-9-research0046. [DOI] [PMC free article] [PubMed] [Google Scholar]
- Brazma A. On the importance of standardisation in life sciences. Bioinformatics. 2001;17:113–114. doi: 10.1093/bioinformatics/17.2.113. [DOI] [PubMed] [Google Scholar]
- Brazma A, Robinson A, Cameron G, Ashburner M. One-stop shop for microarray data. Nature. 2000;403:699–700. doi: 10.1038/35001676. [DOI] [PubMed] [Google Scholar]
- Bertucci F, van Hulst S, Bernard K, Loriod B, Granjeaud S, Tagett R, Starkey M, Nguyen C, Jordan B, Birnbaum D. Expression scanning of an array of growth control genes in human tumor cell lines. Oncogene. 1999;18:3905–3912. doi: 10.1038/sj.onc.1202731. [DOI] [PubMed] [Google Scholar]
- Bertucci F, Bernard K, Loriod B, Chang Y, Granjeaud S, Birnbaum D, Nguyen C, Peck K, Jordan B. Sensitivity issues in DNA array-based expression measurements and performance of nylon microarrays for small samples. Hum Mol Genet. 1999;8:1715–1722. doi: 10.1093/hmg/8.9.1715. [DOI] [PubMed] [Google Scholar]
- Loriod B, Victorero G, Nguyen C. cDNA Macroarrays and microarrays on Nylon Membranes with Radioactivite detection. In: Jordan B, editor. In DNA Microarrays: Gene Expression Applications. Berlin Heidelberg: Springer-Verlag; 2001. pp. 57–84. [Google Scholar]
- Cox J. Applications of nylon membrane arrays to gene expression analysis. J Immunol Methods. 2001;250:3–13. doi: 10.1016/S0022-1759(01)00302-7. [DOI] [PubMed] [Google Scholar]
- Audic S, Zanetti G. Automatic reading of hybridization filter images. Comput Appl Biosci. 1995;11:489–495. doi: 10.1093/bioinformatics/11.5.489. [DOI] [PubMed] [Google Scholar]
- Therneau T, Tschumper R, Jelinek D. Sharpening spots: correcting for bleedover in cDNA array images. Math Biosci. 2002;176:1–15. doi: 10.1016/S0025-5564(01)00101-8. [DOI] [PubMed] [Google Scholar]
- Herwig R, Aanstad P, Clark M, Lehrach H. Statistical evaluation of differential expression on cDNA nylon arrays with replicated experiments. Nucleic Acids Res. 2001;29:E117. doi: 10.1093/nar/29.23.e117. [DOI] [PMC free article] [PubMed] [Google Scholar]
- Schuchhardt J, Beule D, Malik A, Wolski E, Eickhoff H, Lehrach H, Herzel H. Normalization strategies for cDNA microarrays. Nucleic Acids Res. 2000;28:e47. doi: 10.1093/nar/28.10.e47. [DOI] [PMC free article] [PubMed] [Google Scholar]
- Beissbarth T, Fellenberg K, Brors B, Arribas-Prat R, Boer J, Hauser N, Scheideler M, Hoheisel J, Schutz G, Poustka A, Vingron M. Processing and quality control of DNA array hybridization data. Bioinformatics. 2000;16:1014–1022. doi: 10.1093/bioinformatics/16.11.1014. [DOI] [PubMed] [Google Scholar]
- Machl WA, Schaab C, Ivanov I. Improving DNA array data quality by minimising 'neighbourhood' effects. Nucleic Acids Res. 2002;30:e127. doi: 10.1093/nar/gnf127. [DOI] [PMC free article] [PubMed] [Google Scholar]
- Pelizzari C, Khodarev N, Gupta N, Calvin D, Weichselbaum R. Quantitative analysis of DNA array autoradiographs. Nucleic Acids Res. 2000;28:4577–4581. doi: 10.1093/nar/28.22.4577. [DOI] [PMC free article] [PubMed] [Google Scholar]
- Thieblemont C, Nasser V, Felman P, Leroy K, Gazzo S, Callet-Bauchu E, Loriod B, Granjeaud S, Gaulard P, Haioun C, Traverse-Glehen A, Baseggio L, Bertucci F, Birnbaum D, Magrangeas F, Minvielle S, Avet-Loiseau H, Salles G, Coiffier B, Berger F, Houlgatte R. Small lymphocytic lymphoma, marginal zone B-cell lymphoma, and mantle cell lymphoma exhibit distinct gene-expression profiles allowing molecular diagnosis. Blood. 2004;103:2727–2737. doi: 10.1182/blood-2003-06-2160. [DOI] [PubMed] [Google Scholar]
- el Atifi M, Dupre I, Rostaing B, Benabid A, Berger F. Quantification of DNA probes on nylon microarrays using T4 polynucleotide kinase labeling. Biotechniques. 2003;35:262–264. doi: 10.2144/03352bm03. [DOI] [PubMed] [Google Scholar]
- Nguyen C, Rocha D, Granjeaud S, Baldit M, Bernard K, Naquet P, Jordan B. Differential gene expression in the murine thymus assayed by quantitative hybridization of arrayed cDNA clones. Genomics. 1995;29:207–216. doi: 10.1006/geno.1995.1233. [DOI] [PubMed] [Google Scholar]
- Zuidervaart W, van der Velden P, Hurks M, van Nieuwpoort F, Out-Luiting C, Singh A, Frants R, Jager M, Gruis N. Gene expression profiling identifies tumour markers potentially playing a role in uveal melanoma development. Br J Cancer. 2003;89:1914–1919. doi: 10.1038/sj.bjc.6601374. [DOI] [PMC free article] [PubMed] [Google Scholar]
- Yoneda K, Peck K, Chang M, Chmiel K, Sher Y, Chen J, Yang P, Chen Y, Wu R. Development of high-density DNA microarray membrane for profiling smoke- and hydrogen peroxide-induced genes in a human bronchial epithelial cell line. Am J Respir Crit Care Med. 2001;164:S85–89. doi: 10.1164/ajrccm.164.supplement_2.2106062. [DOI] [PubMed] [Google Scholar]
- Brazma A, Hingamp P, Quackenbush J, Sherlock G, Spellman P, Stoeckert C, Aach J, Ansorge W, Ball C, Causton H, Gaasterland T, Glenisson P, Holstege F, Kim I, Markowitz V, Matese J, Parkinson H, Robinson A, Sarkans U, Schulze-Kremer S, Stewart J, Taylor R, Vilo J, Vingron M. Minimum information about a microarray experiment (MIAME)-toward standards for microarray data. Nat Genet. 2001;29:365–371. doi: 10.1038/ng1201-365. [DOI] [PubMed] [Google Scholar]
- Wruck W, Griffiths H, Steinfath M, Lehrach H, Radelof U, O'Brien J. Xdigitise: visualization of hybridization experiments. Bioinformatics. 2002;18:757–760. doi: 10.1093/bioinformatics/18.5.757. [DOI] [PubMed] [Google Scholar]
- Stillman B, Tonkinson J. Expression microarray hybridization kinetics depend on length of the immobilized DNA but are independent of immobilization substrate. Anal Biochem. 2001;295:149–157. doi: 10.1006/abio.2001.5212. [DOI] [PubMed] [Google Scholar]
- Granjeaud S, Nguyen C, Rocha D, Luton R, Jordan B. From hybridization image to numerical values: a practical, high throughput quantification system for high density filter hybridizations. Genet Anal. 1996;12:151–162. doi: 10.1016/1050-3862(95)00128-X. [DOI] [PubMed] [Google Scholar]
- Brändle N, Bischof H, Lapp H. A Generic and Robust Approach for the Analysis of Spot Array Images. In: Bittner M, Chen Y, Dorsel A, Dougherty E, editor. In Proc SPIE – Microarrays: Optical Technologies and Informatics. Vol. 4266. SPIE; 2001. pp. 1–12. [Google Scholar]
- Brändle N, Chen HY, Bischof H, Lapp H. Robust Parametric and Semi-parametric Spot Fitting for Spot Array Images. Proc Int Conf Intell Syst Mol Biol. 2000:46–56. [PubMed] [Google Scholar]
- Eisen M, Spellman P, Brown P, Botstein D. Cluster Analysis and Display of Genome-Wide Expression Patterns. Proc Natl Acad Sci USA. 1998;95:14863–14828. doi: 10.1073/pnas.95.25.14863. [DOI] [PMC free article] [PubMed] [Google Scholar]


