

Abstract
Much of what was assumed about the functional topography of the hippocampus was derived from a single case study over half a century ago. Given advances in the imaging sciences, a new era of discovery is underway, with potential to transform the understanding of healthy processing as well as the ability to treat disorders. Coactivation‐based parcellation, a meta‐analytic approach, and ultra‐high field, high‐resolution functional and structural neuroimaging to characterize the neurofunctional topography of the hippocampus was employed. Data revealed strong support for an evolutionarily preserved topography along the long‐axis. Specifically, the left hippocampus was segmented into three distinct clusters: an emotional processing cluster supported by structural and functional connectivity to the amygdala and parahippocampal gyrus, a cognitive operations cluster, with functional connectivity to the anterior cingulate and inferior frontal gyrus, and a posterior perceptual cluster with distinct structural connectivity patterns to the occipital lobe coupled with functional connectivity to the precuneus and angular gyrus. The right hippocampal segmentation was more ambiguous, with plausible 2‐ and 5‐cluster solutions. Segmentations shared connectivity with brain regions known to support the correlated processes. This represented the first neurofunctional topographic model of the hippocampus using a robust, bias‐free, multimodal approach. Hum Brain Mapp 36:5018–5037, 2015. © 2015 Wiley Periodicals, Inc.
Keywords: meta‐analysis, fMRI, 7T, high field, DTI
INTRODUCTION
Arguably one of the most phylogenetically conserved neural structures, the hippocampus has been a prime target for evolution theorists and cognitive neuroscientists alike. Theories regarding the functional specialization of the hippocampus date back to 1901, when Ramón y Cajal (1901) described the cytoarchitectonic differences between hippocampal subfields, yet the precise neurofunctional underpinnings have yet to be elucidated. In fact, to our knowledge, no study has performed a comprehensive, data‐driven examination of the human hippocampus, inclusive of identifying and characterizing neurofunctional subfields, despite the plethora of theories involving differentiation of the structure across species. Understanding the functional topography could lead to advances in our understanding of healthy cognitive processing, while also having transformative implications for diseases in which the hippocampus is implicated (e.g., post‐traumatic stress disorder [PTSD], temporal lobe epilepsy [TLE], depression) [Maneshi et al., 2014; Spielberg et al., 2015; Treadway et al., 2015].
One of the more predominant theories of functional differentiation within the hippocampus is a long‐axis segmentation. Moser and Moser (1998) were among the first to provide a comprehensive review of the most prominent evidence supporting the hippocampus having a dorsal (e.g., septal pole/analogous to the posterior portion of the human hippocampus)–ventral (e.g., temporal pole/analogous to the anterior portion of the human hippocampus) gradient, originally theorized because of the afferent and efferent connectivity observed in the rodent and nonhuman primate, but further reinforced through a series of behavioral studies. Furthermore, they speculated that the ventral (anterior in humans) portion was more engaged in limbic processes (i.e., “hot” processing), and the dorsal (posterior in humans) was preferentially activated during tasks such as spatial navigation, or learned associations (i.e., “cold” processes). This proposed segmentation has been given new life in recent years, with investigations into cell organization and gene expression [Fanselow and Dong, 2010; Poppenk et al., 2013], all supporting a potential differentiation along an anterior to posterior gradient. Corroborating evidence has also emerged from the fields of magnetic resonance spectroscopy (MRS) [King et al., 2008] and functional magnetic resonance imaging (fMRI) [Duarte et al., 2014; Duncan et al., 2014; Greve et al., 2011; Prince et al., 2005; Strange et al., 2005]. For example, Prince et al. (2005) demonstrated strong evidence for an anterior–posterior parcellation that corresponded to an encoding‐retrieval gradient. Similarly, Duncan et al. (2014) recently demonstrated functional connectivity differentiation between encoding and retrieval processes within specific hippocampal subfields. Together, these results support the fundamental argument that the hippocampus maintains a neurofunctional topographical organization, but they do not address the question of whether other neurocognitive processes utilize these subregions, as all of the aforementioned studies used a single paradigm in which variables were parametrically manipulated to examine one specific aspect of memory formation.
Further complicating this field of research is the notion that much of what we assume about human memory and hippocampal functioning has been derived from a case study over half a century ago, when patient H.M. underwent a bilateral hippocampal resection [Scoville and Milner, 1957]. It was not until the early 1990s that H.M. received a magnetic resonance imaging scan that revealed potential discrepancies in the neurosurgical account of his lesions, which were confirmed following his death when more sophisticated imaging procedures could be carried out [Annese et al., 2014; Augustinack et al., 2014]. Additionally, most, if not all, studies of hippocampal subspecialization limit their investigations to a single behavioral domain (e.g., cognition) or a single paradigm that compares specific neurocognitive processes (i.e., encoding versus retrieval) [Duarte et al., 2014; Duncan et al., 2014; Prince et al., 2005]. Thus, we have relied on inferences about hippocampal topography drawn from data in non‐human species, from case studies, and/or from focused cognitive processing (i.e., memory or spatial navigation) studies. Here, we attempt to overcome these shortcomings using a multimodal approach that capitalizes on the big‐data resources available via neuroimaging databases. In a robust and unbiased methodological approach, we used coactivation‐based parcellation (CBP) [Cieslik et al., 2013; Clos et al., 2013; Eickhoff et al., 2011], a meta‐analytic technique, to elucidate the functional cluster profile of the left and right hippocampus. We then used high‐resolution functional (fMRI) and structural magnetic resonance imaging to examine the validity of the resultant cluster solutions. Understanding the complete neurofunctional profile, uninhibited by single paradigm study designs, or focused on specific neurocognitive processes, is pivotal for our understanding of hippocampal topography. Furthermore, understanding the functional relationships of the topographical organization with regard to cognitive processes could lead to transformative computational models of how the brain works under hippocampal‐dependent cognitive and emotive processing.
METHODS
Meta‐Analytic Methodology
Region of interest selection
We used the Harvard–Oxford Structural Probability Atlas distributed with the FSL neuroimaging analysis software package (http://www.fmrib.ox.ac.uk/fsl/fslview/atlas-descriptions.html#ho) [Jenkinson et al., 2012; Smith et al., 2004] to define right and left hippocampal ROIs for inclusion in our analyses (Fig. 1). Each ROI was thresholded at 75%, yielding a conservative anatomical representation, assuring that the ROI captured and confined the brain structure of interest, with the added benefit of being easily described to the neuroimaging community. The mean probability for the left (M ± SD: 86.41% ± 7.10%) and right hippocampus (87.75% ± 7.39%) was over 87%, and the centroid for each was over 97% (left: 97.1% at MNI coordinates [x,y,z] −26, −18.8, −17.2; right: 97.3% at MNI coordinates 27.52, −18.2, −16.8). The total volume for the left hippocampus was 1,880 mm3, and for the right 2,072 mm3.
Figure 1.
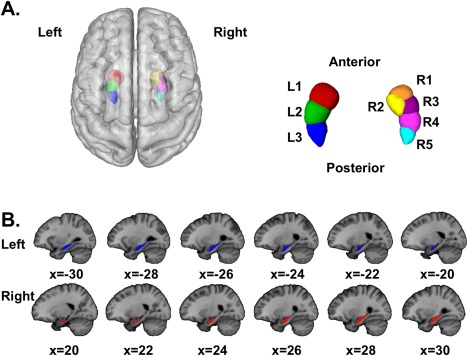
(A) Three‐dimensional (3D) rendering of the hippocampal ROIs used in this study with CBP segmentation results. The left hippocampus segmented into 3 clusters, while the right segmented into 5‐clusters. (B) Mosaic of the hippocampal ROI used for the CBP analysis. Coordinates are in MNI space. [Color figure can be viewed in the online issue, which is available at http://wileyonlinelibrary.com.]
Meta‐analytic connectivity mapping (MACM)
The BrainMap database was used to compute whole‐brain coactivation maps for every voxel within each ROI [http://www.brainmap.org; Fox and Lancaster, 2002; Laird et al., 2005, 2009], using methodology previously described in detail [Bzdok et al., 2013; Cieslik et al., 2013; Clos et al., 2013; Eickhoff et al., in press]. BrainMap archives functional neuroimaging studies by coding statistically significant results, in the form of stereotactic coordinates, with associated meta‐data such as behavioral domain, paradigm class, and subject population (for a full list of meta‐data and operational definitions, please see the BrainMap lexicon at http://www.brainmap.org/scribe/BrainMapLex.xls). At the present time, the database is comprised of 2,630 papers, representing 12,623 experiments, 100 paradigm classes, and 52,289 subjects. Coactivation maps were determined based on the criteria of normal mapping (e.g., no group comparisons or interventions) in healthy subjects, with no restrictions with regard to behavioral domain or paradigm class, allowing for the development of an unconstrained model of neurofunctional topography for the left and right hippocampus independently.
Coactivation‐based parcellation (CBP)
MACM identifies regions of convergence across the entire brain amongst all studies reporting activation for a given region of interest [Cauda et al., 2012; Clos et al., 2013; Eickhoff et al., 2011; Robinson et al., 2010, 2012]. In this application, however, since we are examining every voxel within our ROIs, it is expected that not every voxel will be activated by a sufficiently high number of experiments. As such, we pooled across the neighborhood of each seed voxel and identified those experiments from the BrainMap database that reported activation closest to the voxel by calculating and sorting the Euclidian distances between it and any activation reported in the BrainMap database. Analyses were run using several filters to allow for different degrees of association, assigning 20 through 200 experiments for each voxel in increments of 5 (please see Fig. 2 for an overview of our meta‐analytic approach). Methodology used here is identical to that reported previously [Chase et al., 2015; Clos et al., 2013]. Stable filters were selected for the left (90–180 experiments) and right (100–160 experiments) hippocampus based on filters with the lowest number of deviants (i.e., numbers of voxels that were assigned differently compared with the solution from the majority of filters; we used z‐scores to objectively guide this selection procedure). K‐means clustering was then performed. K‐means clustering is a non‐hierarchical clustering method that uses an iterative algorithm to separate the voxels in the ROI into k non‐overlapping clusters [Forgy, 1965; Hartigan and Wong, 1979], by minimizing the variance within clusters and maximizing the variance between clusters. To do this, the algorithm computes the centroid of each cluster, and subsequently reassigns voxels to the clusters such that their difference from the centroid is minimal [Bzdok et al., 2012, 2013; Cieslik et al., 2013; Clos et al., 2013; Eickhoff et al., 2011]. Centroids are chosen at random for each new iteration. In our search, we chose 1,000 iterations to provide increased confidence at finding the optimal solution. In short, each voxel within the ROI is assigned to one of k clusters based on the coactivation profile to every other brain voxel. K‐values of 2 through 7 were performed for each ROI. Stable solutions were chosen using cluster profiling for right and left hippocampal volumes, respectively. Specifically, we examined characteristics reflecting topological, information‐theoretical, and cluster separation properties. The most consistent four criteria used to identify our parcellations are represented in Figure 3. First, the low percentage of misclassified voxels provided evidence for stable solutions, where the optimal k parcellations were those where the percentage of deviants was not significantly increased compared with the k − 1 solution, and ideally where the k + 1 solution leads to a significant increase. Second, we examined the proportion of the minimum cluster size (in red) to the mean cluster size (in blue). Good solutions are those where the size of the minimum cluster size is more than half of the average cluster size within a given k solution. Finally, the change in inter‐/intracluster distance is demonstrated. Optimal solutions are those where the subsequent k + 1 solution does not show a significantly larger increase in intercluster to intracluster distance. Combining this information, the most stable cluster solution for the left hippocampus appeared to be 3, and for the right, 5.
Figure 2.
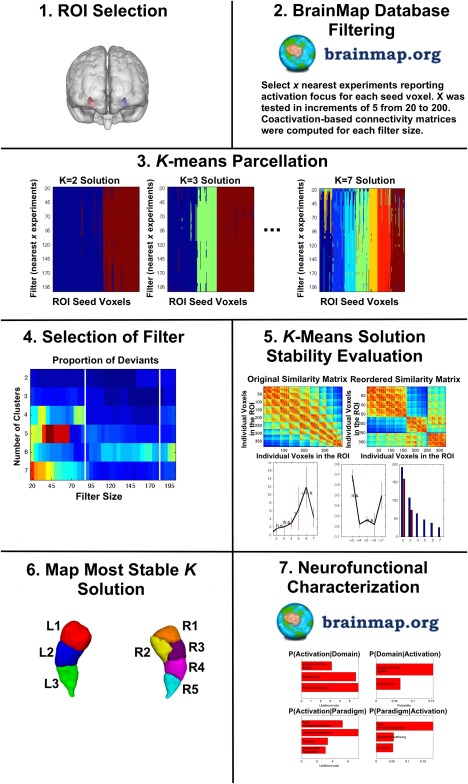
Overview of the meta‐analytic methodology. [Color figure can be viewed in the online issue, which is available at http://wileyonlinelibrary.com.]
Figure 3.
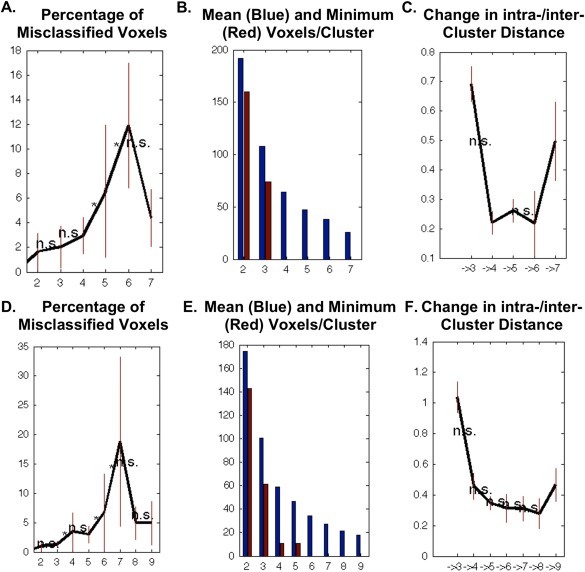
Clustering profiles from the CBP analysis. Top panels are results for the left hippocampus, bottom panels are for the right hippocampus. Panels A&D depict the percentage of misclassified voxels, demonstrating a stable cluster solutions of 2–4 for the left hippocampus and 2, 3, and 5 for the right. Good solutions are considered those K parcellations where percentages of deviants are not significantly increased compared with the K ‐ 1 solution, especially if the K + 1 solution leads to a significantly higher percentage of deviants (as is the case for K = 4 for the left and K = 5 for the right). Panels B&E depict the proportion of the minimum cluster size (in red) to the mean cluster size (in blue). Good solutions are those where the size of the minimum cluster size is more than half of the average cluster size within a given K solution. Here, cluster solutions K = 2 and K = 3 are ideal for both the left and right hippocampus. Finally, in panels C&F, the change in inter‐/intracluster distance is demonstrated. Here, optimal solutions are those where the subsequent K+1 solution does not show a significantly larger increase in intercluster to intracluster distance. The K = 3 solution is ideal for the left hippocampus, and the K = 2 and 5 solutions are ideal for the right hippocampus. Please note that the y‐scales for these figures have slightly different scaling to optimize visualization. [Color figure can be viewed in the online issue, which is available at http://wileyonlinelibrary.com.]
Post‐hoc meta‐analytic connectivity modeling
Coactivation profiles were then performed on each of the resultant clusters within the left and right hippocampus. This was computed by creating activation likelihood estimation (ALE) maps for each of the clusters, which compared the ALE scores to a null‐distribution reflecting random spatial associations between experiments with a fixed within‐experiment distribution of foci, yielding a P‐value based on the proportion of equal or higher random values [Eickhoff et al., 2009, 2012]. By using this random effects inference approach, we assessed the above‐chance convergence between experiments, converted the non‐parametric P‐values to z‐scores, and thresholded the results using a FWE‐corrected threshold of P < 0.05.
Post‐hoc functional decoding
In addition to looking at the functional connectivity of each cluster, we also characterized the neurofunctional profiles as determined by how they were coded in the BrainMap database with respect to the eliciting tasks' behavioral domain and paradigm class. To do this, forward and reverse inference approaches were applied as described in previous studies [Bzdok et al., 2013; Clos et al., 2013; Eickhoff et al., 2011]. For the forward inference approach, a cluster's neurofunctional profile was determined by computing the disparity between the probability of finding activation associated to a specific taxonomic label within the boundaries of the each cluster, compared with the probability of activation for that same taxonomic label across the entire database. A significant difference [using a binomial test—i.e., P(Activation|Task) > P(Activation)] favoring probability within the cluster would constitute a behavioral/paradigm classification for that cluster. For the reverse inference approach, the neurofunctional profiles were determined by identifying the most likely behavioral domain and paradigm class given activation within the cluster [i.e., P(Task|Activation > P(Task)]. Significance was assessed using χ2.
Ultra‐High Field Magnetic Resonance Imaging Methods
Functional magnetic resonance imaging (fMRI)
We performed high resolution resting state fMRI to further characterize the neurofunctional segments identified by CBP. Twenty‐three healthy individuals (21 right‐handed, 7 males, 16 females, M ± SD = 21.17 ± 1.44)1 were scanned using an EPI sequence, optimized for the hippocampus (37 slices acquired parallel to the AC‐PC line, 0.85 mm × 0.85 mm × 1.5 mm voxels, TR/TE: 3,000/28 ms, 70° flip angle, base/phase resolution 234/100, A > P phase encode direction, iPAT GRAPPA acceleration factor = 3, interleaved acquisition, 100 time points, total acquisition time 5:00). Participants were asked to rest with their eyes closed for the duration of the scan. Data were acquired on the Auburn University MRI Research Center (AUMRIRC) Siemens 7T MAGNETOM outfitted with a 32‐channel head coil by Nova Medical (Wilmington, MA). A whole‐brain high‐resolution three‐dimensional (3D) MPRAGE image (256 slices, 0.63 mm × 0.63 mm × 0.60 mm, TR/TE: 2,200/2.8, 7° flip angle, base/phase resolution 384/100%, collected in an ascending fashion, acquisition time = 14:06) was also acquired for registration purposes. Data were analyzed in SPM8 [Ashburner, 2012] and the “conn” connectivity toolbox [Whitfield‐Gabrieli and Nieto‐Castanon, 2012] using standard resting state fMRI pre‐processing steps (i.e., brain extraction, slice timing correction, Gaussian smoothing [5 mm FWHM], band‐pass filtering [0.008–0.09], regression of motion and physiological artifacts, registration to anatomical space, normalization to MNI standard space). Each segmentation identified by CBP was used as a “seed” and functional connectivity was determined across the entire brain. Seed‐to‐voxel connectivity maps were thresholded at FWE‐corrected P < 0.05 at the cluster‐level (two‐tailed).
Diffusion tensor imaging (DTI)
Data from 31 healthy individuals were acquired on the AUMRIRC Siemens7T MAGNETOM scanner (26 right‐handed, 12 males, 19 females, M ± SD = 21.13 ± 1.43; inclusive of all resting state participants). A high resolution DTI scan (40 slices, 2mm3 isotropic voxels, TR/TE: 5,200/94 ms, base/phase resolution 122/100%, GRAPPA acceleration factor of 3, b = 0 and 1,000, 30 directions, 3 averages, collected in an interleaved fashion, acquisition time = 8:21) was acquired. DTI analyses and probabilistic tractography were carried out using FSL's Diffusion Toolbox 3.0 (FDT) as described previously [Behrens et al., 2003a, 2003c; Jenkinson et al., 2012; Robinson et al., 2012]. In short, data were eddy‐current corrected, diffusion tensors were fit to the corrected data, and probabilistic diffusion models were generated. Two analytic techniques were used. First, we used PROBTRACKX to calculate the tractography between the clusters in the left and right hippocampus and the rest of the brain [Behrens et al., 2003a, 2003b; Johansen‐Berg et al., 2005]. Data were thresholded to reflect only those paths present in more than 15% of the sample, and inclusive of tracts with connection probabilities more than 10%. Second, we examined the anatomical connectivity between the rest of the brain and the clusters, independently. Specifically, we estimated connectivity probabilities between the seed masks (defined as each CBP segment separately) and target masks (defined as the 55 subcortical and cortical ROIs within the Harvard‐Oxford Subcortical and Cortical Probability Atlases, thresholded to 50%, and applied to both left and right hemispheres for a total of 110 total masks) by repeatedly sampling the connected pathways through the probability distribution function. Target ROIs were transformed into each subject's space using registration tools provided in FSL [Jenkinson et al., 2002, 2012; Jenkinson and Smith, 2001]. Anatomical connectivity of the hippocampal regions was quantified by classifying each seed voxel within the cluster mask as connecting to the cortical or subcortical mask with the highest connectivity probability (please see Supporting Information, Fig. 1 for a full listing of masks). The number of seed mask voxels whose highest connectivity was determined to each target mask was then tabulated to estimate the population's greatest white matter tracts from each cluster.
RESULTS
Co‐activation Based Parcellation (CBP)
We identified neurofunctional topography of the left hippocampus, comprised of three anterior to posterior segmentations, consistent with previous research [Fanselow and Dong, 2010; King et al., 2008]. The anterior‐most segmentation was associated with face monitoring/discrimination, cued explicit recall, and encoding. The middle segment was significantly associated with paired associate recall, cued explicit recognition, and encoding. The most posterior segment was associated with perceptual functioning (Table 1, Fig. 1). The right hippocampus segmented into five distinct regions. However, the neurofunctional substrates of these five regions were not as well defined compared with the left hippocampus. It appears that many of the segmentations are most closely associated with emotional processing, with two segmentations (R2 and R3) having associations with specific cognitive functions, explicit memory, and delayed match to sample, respectively. It is important to note that these functions did not survive FDR correction, thus the right behavioral substrates are interpreted with caution. An alternative solution to the 5‐cluster model is a 2‐cluster solution, which was found to be slightly less favorable. For the 2‐cluster solution, an anterior and posterior segment emerged, with the anterior segment associated with face monitoring/discrimination, affective pictures, encoding, and cued explicit recognition, all thresholded at FDR‐corrected P < 0.05. The posterior segment was associated with imagined objects/scenes and explicit memory.
Table 1.
Behavioral characterization of the neurofunctional segmentation of the hippocampi [Color table can be viewed in the online issue, which is available at http://wileyonlinelibrary.com.]
| P(Activation|Domain) | P(Domain|Activation) | P(Activation|Paradigm) | P(Paradigm|Activation) | |
|---|---|---|---|---|
| L1 | Cognition.Memory.Explicit | Cognition.Memory.Explicit | Face Monitor/Discrimination | Face Monitor/Discrimination |
| Emotion.Fear | Emotion | Classical Conditioning | Passive Viewing | |
| Emotion.Happiness | Emotion.Fear | Encoding | Cued Explicit Recognition | |
| Emotion.Happiness | Cued Explicit Recognition | Classical Conditioning | ||
| Passive Viewing | Encoding | |||
| Paired Associate Recall | Paired Associate Recall | |||
| Semantic Monitor/Discrimination | ||||
| L2 | Cognition.Memory.Explicit | Cognition.Memory.Explicit | Episodic Recall | Semantic Monitor/Discrimination |
| Cognition.Langauge.Semantics | Paired Associate Recall | Paired Associate Recall | ||
| Encoding | Encoding | |||
| Cued Explicit Recognition | Episodic Recall | |||
| Passive Viewing | Cued Explicit Recognition | |||
| Semantic Monitor/Discrimination | Passive Viewing | |||
| Face Monitor/Discrimination | ||||
| L3 | Perception.Vision.Shape | Perception.Vision.Shape | None | None |
| Cognition.Language.Semantics | ||||
| R1 | Perception.Vision.Shape | Emotion | Face Monitor/Discrimination | Face Monitor/Discrimination |
| Emotion | Cognition | Cued Explicit Recognition | Reward | |
| Perception.Vision.Shape | Cued Explicit Recognition | |||
| R2 | Cognition.Memory.Explicit | Cognition.Memory.Explicit | None | None |
| Perception.Audition | Emotion | |||
| Perception.Audition | ||||
| R3 | Emotion | Emotion | Face Monitor/Discrimination | Face Monitor/Discrimination |
| Cognition.Memory.Explicit | Cognition.Memory.Explicit | Reward | ||
| Cognition | Delayed Match to Sample | |||
| R4 | Emotion | Emotion | None | None |
| Cognition.Memory.Explicit | Cognition.Memory.Explicit | |||
| Cognition | ||||
| R5 | Emotion | Emotion | None | None |
Color shaded cells indicate significance that surpassed FDR correction. All others are significant at an uncorrected P < 0.05.
Resting State Functional Connectivity
In addition to strong connectivity to the left amygdala, L1 demonstrated functional connectivity to several contralateral limbic structures, including the parahippocampal gyrus (BA27) and the anterior and posterior cingulate (BA32/30, respectively) (Fig. 4, Table 2). These regions have all been implicated in affective processing and are likely to support functions such as face monitoring/discrimination. Additionally, the right precentral gyrus (BA4), which has been noted to support verbal encoding [Baker et al., 2001], was also functionally connected, potentially supporting the encoding processes attributed to L1. L2 demonstrated the most diverse connectivity profile, with a distributed network throughout the entire brain inclusive of cognitive and affective regions (left inferior frontal gyrus [BA47], bilateral anterior cingulate) as well as perceptual processing regions (bilateral inferior parietal lobule [BA40], bilateral superior temporal gyrus, and bilateral middle temporal gyrus). This neural network supports cognitive processes such as recognition and recall. L3 demonstrated functional connectivity to frontal regions, including the left inferior frontal gyrus (BA47), which has been putatively linked to a variety of language and memory processes, including semantic encoding [Demb et al., 1995; Li et al., 2000], recall, and retrieval [Demb et al., 1995; Smith et al., 1998; Zhang et al., 2004]. In addition, L3 had functional connectivity to several parietal regions including the right precuneus (BA39) and the left angular gyrus. This distributed brain network would be ideal to support perceptual processes, particularly as they interface with memory processes.
Figure 4.
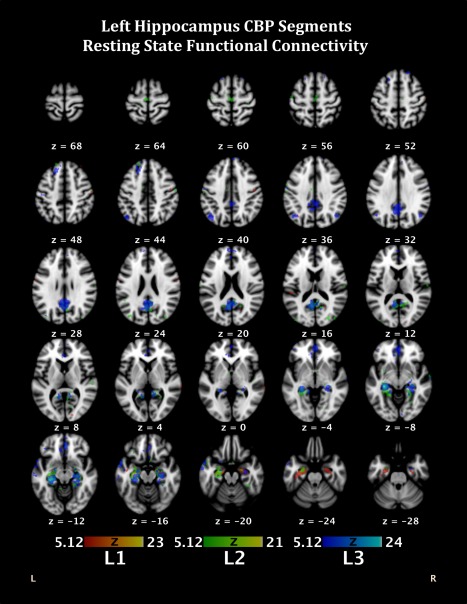
Functional connectivity during resting state fMRI of the segmentations from the CBP analysis of the left hippocampus. Colors correspond to segment colors in Figure 1A. [Color figure can be viewed in the online issue, which is available at http://wileyonlinelibrary.com.]
Table 2.
Resting state functional connectivity of each CBP segmentation of the left hippocampus
| Region | x | y | z | Lobe | Description | BA |
|---|---|---|---|---|---|---|
| L1 | −57 | −9 | 26 | Frontal | Left Precentral Gyrus | |
| 43 | −17 | 39 | Right Precentral Gyrus | 4 | ||
| 52 | −10 | 26 | ||||
| 32 | 29 | 51 | Right Superior Frontal Gyrus | 8 | ||
| 25 | −35 | −2 | Limbic | Right Parahippocampal Gyrus | 27 | |
| 19 | −59 | 13 | Right Posterior Cingulate | 30 | ||
| 3 | 39 | −6 | Right Anterior Cingulate | 32 | ||
| −23 | −11 | −17 | Left Amygdala | |||
| 27 | −13 | −15 | Right Hippocampus | |||
| 13 | −87 | 5 | Occipital | Right Lingual Gyrus | 17 | |
| 50 | −21 | 48 | Parietal | Right Postcentral Gyrus | 2 | |
| −35 | −66 | 32 | Left Precuneus | 39 | ||
| −42 | −9 | −14 | Temporal | Left Sub‐Gyral | 21 | |
| 64 | −32 | 4 | Right Middle Temporal Gyrus | 22 | ||
| −48 | −31 | 15 | Left Superior Temporal Gyrus | 41 | ||
| L2 | −17 | −35 | 57 | Frontal | Left Paracentral Lobule | 3 |
| −55 | −20 | 37 | Left Precentral Gyrus | 4 | ||
| −4 | −24 | 56 | Left Medial Frontal Gyrus | 6 | ||
| −16 | 33 | 50 | Left Superior Frontal Gyrus | 8 | ||
| −30 | 33 | −9 | Left Inferior Frontal Gyrus | 47 | ||
| −6 | 33 | 0 | Limbic | Left Anterior Cingulate | 24 | |
| −9 | −9 | 41 | Left Cingulate Gyrus | |||
| 3 | 9 | −9 | Right Anterior Cingulate | 25 | ||
| 5 | 35 | −5 | 32 | |||
| −27 | −21 | −13 | Left Hippocampus | |||
| 25 | −80 | 12 | Occipital | Right Cuneus | 17 | |
| 15 | −79 | 21 | 18 | |||
| 10 | −71 | 3 | Right Lingual Gyrus | |||
| −35 | −78 | 20 | Left Middle Occipital Gyrus | 19 | ||
| 32 | −81 | 21 | Right Middle Occipital Gyrus | |||
| 50 | −21 | 50 | Parietal | Right Postcentral Gyrus | 2 | |
| −46 | −18 | 52 | Left Postcentral Gyrus | 3 | ||
| 32 | −31 | 54 | Right Postcentral Gyrus | |||
| −57 | −20 | 19 | Left Postcentral Gyrus | 40 | ||
| 56 | −19 | 27 | Right Inferior Parietal Lobule | |||
| 54 | −16 | 14 | Right Postcentral Gyrus | 43 | ||
| 43 | −17 | 3 | Sub‐lobar | Right Insula | 13 | |
| −7 | −3 | 2 | Left Thalamus | |||
| −46 | −48 | 21 | Temporal | Left Superior Temporal Gyrus | 13 | |
| 55 | −14 | −12 | Right Middle Temporal Gyrus | 21 | ||
| 58 | −12 | −5 | Right Superior Temporal Gyrus | |||
| −45 | 8 | −14 | Left Superior Temporal Gyrus | 38 | ||
| 47 | −68 | 26 | Right Middle Temporal Gyrus | 39 | ||
| −51 | −36 | 11 | Left Superior Temporal Gyrus | 41 | ||
| 53 | −25 | 10 | Right Superior Temporal Gyrus | |||
| L3 | −55 | −12 | 35 | Frontal | Left Precentral Gyrus | 4 |
| 58 | −7 | 35 | Right Precentral Gyrus | 6 | ||
| 19 | 31 | 56 | Right Superior Frontal Gyrus | |||
| 12 | 45 | 43 | 8 | |||
| −23 | 8 | −13 | Left Subcallosal Gyrus | 34 | ||
| −40 | 33 | −4 | Left Inferior Frontal Gyrus | 47 | ||
| −40 | 44 | 2 | ||||
| 1 | 35 | −1 | Limbic | Right Anterior Cingulate | 24 | |
| 13 | −61 | 15 | Right Posterior Cingulate | 30 | ||
| −29 | −29 | −10 | Left Hippocampus | |||
| −46 | −24 | 44 | Parietal | Left Postcentral Gyrus | 2 | |
| −42 | −67 | 33 | Left Angular Gyrus | 39 | ||
| 41 | −67 | 31 | Right Precuneus | |||
| 8 | −83 | −12 | Posterior | Right Declive | ||
| 62 | −14 | −3 | Temporal | Right Superior Temporal Gyrus | 21 | |
| −54 | 8 | −12 | Left Superior Temporal Gyrus | 38 |
Descriptive labels and Brodmann areas (BA) were determined by the Talairach Demon labels associated with the coordinates.
For the right segmentations, R1 demonstrated functional connectivity to bilateral superior frontal gyri (BA8), which have been noted in several memory related processes, including working memory [Babiloni et al., 2005; Rämä et al., 2001], perceptual priming [Bunzeck et al., 2006], and memory retrieval [Rugg et al., 1996]. Interestingly, R1 also demonstrated contralateral connectivity to the left hippocampus. R2 had contralateral connectivity to key limbic structures such as the amygdala and cingulate (BA 24/31), as well as cognitive processing hubs. Ipsilateral connections were also demonstrated, particularly throughout the temporal lobe. R3 demonstrated a distributed network of functional connectivity inclusive of cognitive processing centers (i.e., bilateral inferior frontal gyri [BA47]), limbic structures (i.e., left parahippocampal gyrus [BA35] and left posterior cingulate [BA29]), and perceptual processing regions (i.e., bilateral middle temporal gyri [BA21], and the left inferior and middle occipital gyrus [BA19 and BA18], respectively). The contralateral connectivity to key structures in the left hemisphere may help to support the functions of working memory, as R3 was associated with delayed match to sample operations. Of all the right hippocampal segmentations, R4 demonstrated the most diverse functional connectivity profile. R4 was found to be functionally connected to several contralateral structures including the left superior frontal gyrus (BA8), medial frontal gyrus (BA6), anterior cingulate (BA24/32), parahippocampal gyrus (including the amygdala), fusiform gyrus (BA19), and middle and superior temporal gyri. Ipsilateral connectivity was determined primarily in perceptual processing regions, such as the right lingual gyrus (BA18), inferior temporal gyrus, postcentral gyrus (BA3), and fusiform gyrus (BA37). These structures likely support a variety of cognitive processes, thus lending support for our conclusion that increasing power by increasing the number of studies activating the right hippocampus in the BrainMap database, may be necessary to fully delineate the topography of the right hippocampus. Finally, R5 primarily had functional connectivity limited to the limbic and temporal regions, inclusive of bilateral parahippocampal gyri and cingulate regions, the left hippocampus, as well as bilateral superior temporal gyri. Please see Table 3 and Figure 5 for resting‐state connectivity data regarding the 5‐cluster solution of the right hippocampus.
Table 3.
Resting state functional connectivity of each CBP segmentation of the right hippocampus 5−cluster solution
| Region | x | y | z | Lobe | Description | BA |
|---|---|---|---|---|---|---|
| R1 | −12 | 45 | 43 | Frontal | Left Superior Frontal Gyrus | 8 |
| 6 | 41 | 50 | Right Superior Frontal Gyrus | |||
| 20 | −7 | −18 | Limbic | Right Amygdala | ||
| −25 | −13 | −17 | Left Hippocampus | |||
| R2 | 19 | −40 | −8 | Anterior | Right Culmen | |
| 41 | −15 | 41 | Frontal | Right Precentral Gyrus | 4 | |
| −4 | −22 | 58 | Left Medial Frontal Gyrus | 6 | ||
| −33 | 6 | 57 | Left Middle Frontal Gyrus | |||
| −24 | 36 | 45 | Left Superior Frontal Gyrus | 8 | ||
| 19 | 22 | 48 | Right Superior Frontal Gyrus | |||
| 21 | −15 | −15 | Limbic | Right Parahippocampal Gyrus | 28 | |
| 4 | −57 | 10 | Right Posterior Cingulate | 30 | ||
| −20 | −63 | 14 | Left Posterior Cingulate | 31 | ||
| 0 | −5 | 33 | Left Cingulate Gyrus | 24 | ||
| −7 | −57 | 28 | 31 | |||
| −21 | −13 | −12 | Left Amygdala | |||
| 55 | 2 | −16 | Temporal | Right Middle Temporal Gyrus | 21 | |
| 55 | −9 | −1 | Right Superior Temporal Gyrus | 22 | ||
| 36 | −47 | −12 | Right Fusiform Gyrus | 37 | ||
| 45 | 5 | −7 | Right Superior Temporal Gyrus | 38 | ||
| R3 | −5 | −67 | −6 | Anterior | Left Culmen | |
| −2 | −29 | 50 | Frontal | Left Paracentral Lobule | 5 | |
| 0 | 25 | 57 | Left Superior Frontal Gyrus | 6 | ||
| −5 | 50 | 36 | Left Medial Frontal Gyrus | 9 | ||
| 5 | 15 | −12 | Right Subcallosal Gyrus | 25 | ||
| −40 | 28 | −8 | Left Inferior Frontal Gyrus | 47 | ||
| 40 | 31 | −7 | Right Inferior Frontal Gyrus | |||
| −11 | −47 | 9 | Limbic | Left Posterior Cingulate | 29 | |
| −19 | −19 | −12 | Left Parahippocampal Gyrus | 35 | ||
| 27 | −15 | −17 | Right Hippocampus | |||
| −26 | −91 | 13 | Occipital | Left Middle Occipital Gyrus | 18 | |
| −44 | −76 | −2 | Left Inferior Occipital Gyrus | |||
| 2 | −85 | 30 | Right Cuneus | 19 | ||
| 37 | −80 | 14 | Right Middle Occipital Gyrus | |||
| 41 | −65 | 10 | Right Middle Temporal Gyrus | 37 | ||
| 32 | −24 | 40 | Parietal | Right Postcentral Gyrus | 3 | |
| 29 | −1 | −8 | Sub‐lobar | Right Putamen ‐ Lentiform Nucleus | ||
| −60 | −30 | −14 | Temporal | Left Middle Temporal Gyrus | 21 | |
| 53 | −16 | −9 | Right Middle Temporal Gyrus | |||
| 51 | −55 | −16 | Right Fusiform Gyrus | 37 | ||
| R4 | 38 | −43 | −17 | Anterior | Right Culmen | |
| 48 | −15 | 40 | Frontal | Right Precentral Gyrus | 4 | |
| 19 | −41 | 55 | Right Paracentral Lobule | 5 | ||
| 0 | −18 | 53 | Left Medial Frontal Gyrus | 6 | ||
| −22 | 17 | 49 | Left Superior Frontal Gyrus | 8 | ||
| −13 | 35 | 49 | ||||
| −5 | 25 | 1 | Limbic | Left Anterior Cingulate | 24 | |
| −2 | −13 | 43 | Left Cingulate Gyrus | |||
| −9 | −40 | 6 | Left Parahippocampal Gyrus | 30 | ||
| 1 | 40 | 4 | Left Anterior Cingulate | 32 | ||
| −21 | −17 | −12 | Left Parahippocampal Gyrus | 35 | ||
| −27 | −2 | −9 | Left Amygdala | |||
| 29 | −21 | −12 | Right Hippocampus | |||
| −27 | −81 | −8 | Occipital | Left Middle Occipital Gyrus | ||
| 22 | −86 | 23 | Right Cuneus | 18 | ||
| 10 | −86 | 14 | ||||
| 2 | −75 | 3 | Right Lingual Gyrus | |||
| −21 | −59 | −9 | Left Fusiform Gyrus | 19 | ||
| −34 | −75 | −11 | ||||
| 40 | −67 | −5 | Right Inferior Temporal Gyrus | |||
| 35 | −29 | 53 | Parietal | Right Postcentral Gyrus | 3 | |
| −44 | −72 | 35 | Left Precuneus | 39 | ||
| −36 | −22 | 21 | Sub‐lobar | Left Insula | 13 | |
| −23 | 5 | −5 | Left Putamen ‐ Lentiform Nucleus | |||
| −54 | −4 | −13 | Temporal | Left Middle Temporal Gyrus | 21 | |
| −51 | −45 | 6 | ||||
| −53 | 7 | −3 | Left Superior Temporal Gyrus | 22 | ||
| −56 | −3 | −4 | ||||
| −38 | −49 | −15 | Left Fusiform Gyrus | 37 | ||
| 45 | −57 | −11 | Right Fusiform Gyrus | |||
| 39 | −38 | 12 | Right Superior Temporal Gyrus | 41 | ||
| R5 | 27 | −29 | −7 | Limbic | Right Parahippocampal Gyrus | 27 |
| −14 | −51 | 5 | Left Parahippocampal Gyrus | 30 | ||
| 6 | −50 | 21 | Right Posterior Cingulate | |||
| −11 | −55 | 30 | Left Cingulate Gyrus | 31 | ||
| −31 | −29 | −10 | Left Hippocampus | |||
| −40 | −59 | 32 | Parietal | Left Angular Gyrus | 39 | |
| 56 | −11 | −1 | Temporal | Right Superior Temporal Gyrus | 22 | |
| −55 | −21 | 7 | Left Superior Temporal Gyrus | 41 |
Descriptive labels and Brodmann areas (BA) were determined by the Talairach Demon labels associated with the coordinates.
Figure 5.
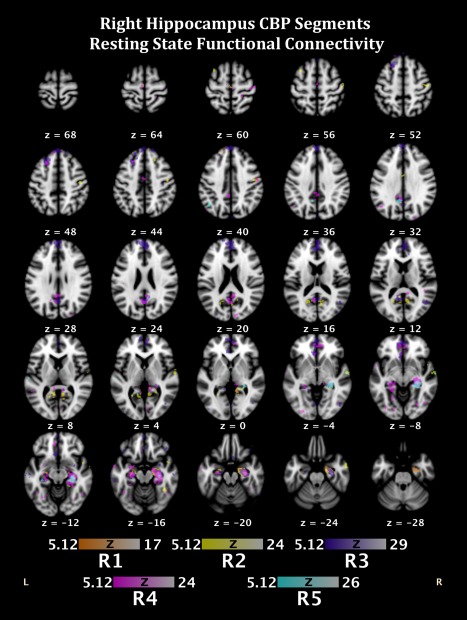
Functional connectivity during resting state fMRI of the segmentations from the CBP analysis of the right hippocampus. Colors correspond to segment colors in Figure 1A. [Color figure can be viewed in the online issue, which is available at http://wileyonlinelibrary.com.]
The 2‐cluster solution for the right hippocampus was also examined. The anterior cluster (Cluster 1) demonstrated functional connectivity to the left amygdala, hippocampus, anterior and posterior cingulate cortices (BA32 and 29, respectively), in addition to the left inferior frontal gyrus (BA47) and insula (BA13) (Table 4). Ipsilateral functional connectivity was noted to regions of the inferior frontal gyrus (BA47), parahippocampus (BA28), anterior cingulate (BA32), and superior temporal gyrus (BA21/22). These data suggest a strong support system for affective processes, in line with the behavioral profile attributed to this cluster. The posterior cluster (Cluster 2) also exhibited contralateral functional connectivity to the left inferior frontal gyrus (BA47) and insula (BA13), but also exhibited a unique pattern of connectivity with associations to the left fusiform gyrus (BA19/37) and postcentral gyrus (BA3). The ipsilateral functional connectivity observed was primarily within the limbic system (anterior cingulate, posterior cingulate, hippocampus), and portions of the cortex devoted to sensory processing (superior temporal gyrus and fusiform gyrus) as well as with sub‐lobar structures such as the insula and caudate. Several regions of the precentral gyrus were also functionally connected. These data suggest that the posterior cluster has ample functional support to carry out the operations identified by the behavioral analysis (i.e., imagined objects and scenes).
Table 4.
Resting state functional connectivity of each CBP segmentation of the right hippocampus 2‐cluster solution
| Region | x | y | z | Lobe | Description | BA |
|---|---|---|---|---|---|---|
| Cluster1 | 14 | −55 | −24 | Anterior | Right Dentate | |
| 2 | 27 | 57 | Frontal | Right Superior Frontal Gyrus | 6 | |
| −22 | 36 | 45 | Left Superior Frontal Gyrus | 8 | ||
| 3 | 53 | 22 | Right Medial Frontal Gyrus | 9 | ||
| −16 | 58 | 13 | Left Medial Frontal Gyrus | 10 | ||
| −38 | 46 | 15 | Left Middle Frontal Gyrus | |||
| −41 | 31 | −6 | Left Inferior Frontal Gyrus | |||
| 38 | 29 | −7 | Right Inferior Frontal Gyrus | 47 | ||
| 36 | 15 | −17 | ||||
| 21 | −13 | −15 | Limbic | Right Parahippocampal Gyrus | 28 | |
| −11 | −48 | 12 | Left Posterior Cingulate | 29 | ||
| −3 | 47 | 2 | Left Anterior Cingulate | 32 | ||
| 5 | 31 | −7 | Right Anterior Cingulate | |||
| −23 | −11 | −13 | Left Amygdala | |||
| −41 | −67 | 35 | Parietal | Left Precuneus | 39 | |
| −36 | −18 | 22 | Sub‐lobar | Left Insula | 13 | |
| 55 | −6 | −17 | Temporal | Right Middle Temporal Gyrus | 21 | |
| 58 | −11 | −1 | Right Superior Temporal Gyrus | |||
| 47 | 5 | −5 | 22 | |||
| −29 | −27 | −10 | Left Hippocampus | |||
| Cluster2 | 35 | −28 | 58 | Frontal | ||
| 47 | −17 | 38 | Right Precentral Gyrus | 4 | ||
| 34 | −20 | 50 | ||||
| −6 | −24 | 60 | Left Medial Frontal Gyrus | |||
| 0 | −10 | 65 | Right Medial Frontal Gyrus | 6 | ||
| 22 | 21 | 57 | ||||
| 49 | −6 | 28 | Right Precentral Gyrus | |||
| −26 | 19 | 47 | Left Middle Frontal Gyrus | 8 | ||
| −34 | 27 | −5 | Left Inferior Frontal Gyrus | 47 | ||
| −36 | 22 | −10 | ||||
| −2 | −15 | 41 | Limbic | Left Cingulate Gyrus | 24 | |
| −3 | −10 | 32 | ||||
| 30 | −72 | 14 | Right Posterior Cingulate | 30 | ||
| 1 | 40 | 4 | Right Anterior Cingulate | 32 | ||
| 29 | −21 | −12 | Right Hippocampus | |||
| −7 | −89 | 16 | Occipital | Left Cuneus | ||
| 24 | −87 | 25 | Right Cuneus | 18 | ||
| 2 | −75 | 3 | Right Lingual Gyrus | |||
| −34 | −77 | −13 | Left Fusiform Gyrus | |||
| 40 | −66 | −9 | Right Fusiform Gyrus | 19 | ||
| 27 | −66 | −11 | ||||
| −29 | −31 | 50 | Parietal | Left Postcentral Gyrus | 3 | |
| −50 | −18 | 40 | ||||
| −44 | −65 | 33 | Left Angular Gyrus | 39 | ||
| 36 | −28 | 24 | Sub‐lobar | Right Insula | 13 | |
| −44 | −27 | 14 | Left Insula | 41 | ||
| 5 | 4 | −2 | Right Caudate Head | |||
| −58 | −2 | −13 | Temporal | Left Middle Temporal Gyrus | 21 | |
| −48 | −45 | 6 | ||||
| −62 | −21 | 7 | Left Superior Temporal Gyrus | 22 | ||
| 53 | −9 | −1 | Right Superior Temporal Gyrus | |||
| 45 | −40 | 5 | ||||
| −44 | −62 | −15 | Left Fusiform Gyrus | 37 | ||
| 46 | 9 | −12 | Right Superior Temporal Gyrus | 38 |
Descriptive labels and Brodmann areas (BA) were determined by the Talairach Demon labels associated with the coordinates.
Diffusion Tensor Imaging
DTI analyses demonstrated strong ipsilateral structural connectivity with limited contralateral connectivity. L1's strongest connectivity was to the left amygdala, thalamus, and the parahippocampal gyrus, with a moderate portion of our sample also demonstrating connections to the posterior portion of the temporal fusiform gyrus (Supporting Information, Fig. 2). L2 had a similar pattern of anatomical connectivity, but also had voxels whose strongest connectivity was to portions of the occipital lobe. Both L1 and L2 were found to have connections to the brainstem in the majority of our sample, suggesting their roles may be more aligned to implicit processes, or to more “hot” processing. L3 was found to be anatomically connected to the posterior portion of the parahippocampal gyrus and the posterior cingulate in addition to the amygdala, but also had connections to the occipital lobe, specifically the lingual gyrus and the occipital pole. Interestingly, L3 did not demonstrate the strong sub‐lobar connectivity. This distributed connectivity pattern would support more perceptual processing as indicated by our CBP analysis. Both L2 and L3 demonstrated interhemispheric connectivity via the posterior portion of the corpus callosum (Fig. 4). For the right hemisphere, R1 and R2 had a very similar profile to L1, with the amygdala, parahippocampal gyrus, and the thalamus being the primary anatomical connections. R3, R4, and R5 had substantial connectivity patterns to regions of the temporal (posterior portion of the fusiform gyrus) and occipital (lingual gyrus, occipital pole, superior portion of the lateral occipital cortex) lobes, suggesting an increased capability to handle perceptual processes. In addition, R4 and R5 had anatomical connections to the precuneus in both the left and right hemispheres (Supporting Information, Fig. 3). The 2‐cluster solution for the right hippocampus revealed similar connectivity patterns, with the anterior segment having structural paths to the limbic system, predominantly, with some individuals showing connectivity to the right precuneus and portions of the occipital lobe. The posterior cluster had a much more distributed pattern, heavily concentrated in the occipital and limbic lobes, with an interhemispheric connection to the left precuneus (Supporting Information, Fig. 4).
For probabilistic tracking of the left and right clusters, we found a pattern of increased interhemispheric connections toward the posterior portions of both the left and right hippocampus (Fig. 6). Interestingly, there appeared to be differences in the intrahemispheric breadth of connections between R1 and R2 despite their proximity. This may suggest that R2, which is slightly more medial and closer to the amygdala, may have a very specialized role, as its connectivity was the most confined. Similarly, the connections in the posterior segments of the left and right hippocampus are more diffuse throughout the occipital cortices, supporting their perceptual roles. Interestingly, R1 also demonstrates connectivity to these regions.
Figure 6.
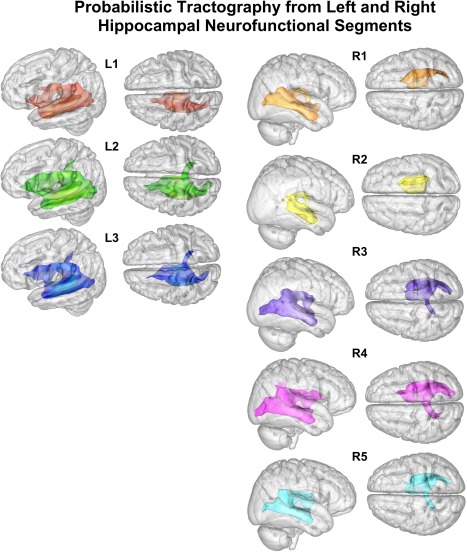
Diffusion tensor imaging (DTI) probabilistic tractography of the left and right hippocampus. [Color figure can be viewed in the online issue, which is available at http://wileyonlinelibrary.com.]
DISCUSSION
The apparent preservation of hippocampal topography across species suggests that there may be an important underlying neurofunctional basis. The specific cognitive attributes of this topography have been elusive due to a proclivity to draw conclusions based on single processes, case‐studies, and non‐human animal research. Using a robust methodological approach, we sought to address this gap in the literature by combining meta‐analytic techniques and ultra‐high field MRI. Specifically, we capitalized on the meticulous coding structure of the BrainMap database to create unbiased neurofunctional maps of the left and right hippocampus. Then, we used meta‐analytic and functional connectivity methods to characterize the resultant segmentation. Finally, we examined the underlying neural architecture supporting each cluster. Taken together, our data provide a preliminary neurofunctional topography of the left and right hippocampus with converging functional and structural support.
Long‐Axis Parcellation
Our results yield a consistent anterior to posterior long‐axis segmentation with qualitative differences between hemispheres. Recent evidence has suggested that there are distinct neurogenetic and precursor cell differences in dorsal–ventral axes (akin to anterior–posterior in humans) in non‐human species [Fanselow and Dong, 2010; Klur et al., 2009; Lowe et al., 2015], which lend support for a functional differentiation. The results from our meta‐analytic methods provided support for a 3‐cluster solution for the left hippocampus, in which the anterior‐most cluster was associated with emotional processes as well as neurocognitive processes such as encoding. Additionally, this cluster was significantly associated with salient stimuli (i.e., faces), which have important biological relevance [Stoeckel et al., 2014; Tsukiura and Cabeza, 2008]. This is in line with Moser and Moser's (1998) view of the anterior‐most portions of the hippocampus primarily engaging in “hot” processing and complements Kim's (2015) more recent hippocampal encoding/retrieval network (HERNET) model with the strong behavioral association to encoding. The middle cluster was associated with more cognitive‐based processes such as paired associate recall, explicit recognition and encoding, while the posterior‐most cluster was associated with perception‐based functions. Thus, these more posterior clusters could be considered to be aligned more with “cold” processing functions and/or the retrieval network in Kim's (2015) model. For the right hippocampus, a 5‐cluster solution emerged as the strongest; however, the behavioral meta‐data associated with each cluster are interpreted with caution due to insufficient power, providing an avenue for further investigation. Alternatively, the right hippocampus may not function under rigorous behavioral or stimulus specific features, thus the topography is less concrete, and may have a more gradient‐like quality. The only significant behavioral association was within R1, which was linked to face monitoring/discrimination, in line with the posited anterior “hot” processing.
In a recent study by Chase et al. (2015) using nearly identical methodology, but examining only the subiculum, they demonstrated a 5‐cluster anterior–posterior solution along the long‐axis. This may provide support for our 5‐cluster solution, but it could also be interpreted in such a way as to suggest that we need to examine CBP models within hippocampal subfields. Two avenues of additional work are necessary to uncover the right hemisphere's ambiguous results, particularly in light of the subfield (i.e., subiculum) finding: (a) increasing the number of papers in the BrainMap database, and (b) using ultra‐high field submillimeter fMRI specifically targeting the hippocampus to yield data with the spatial specificity necessary to delineate the neurofunctional attributes.
Concordance Across Modalities
For both the left and right hippocampus, the anterior‐most portions were consistently associated with face monitoring/discrimination and emotion, which was supported throughout resting state connectivity and DTI analyses. Not surprisingly, given the anatomical locality, we found strong structural connectivity support to the amygdala. However, we also demonstrated anatomical connectivity between these regions and the parahippocampal gyrus, as well as the thalamus. For resting state connectivity, we showed that R1 was functionally connected to the left hippocampus and right amygdala, while L1 had functional connectivity with the left amygdala and right hippocampus. Similarly, R2 also demonstrated functional connectivity to the left limbic system, including the amygdala and cingulate. Additionally, R2 was functionally connected to the posterior cingulate, suggesting that this region may have a slight differentiation from R1, potentially related to internal attention states or the default mode network [Greicius et al., 2003]. These results support the cognitive and affective processes associated with the clusters by the CBP analysis, with additional data being needed to parse the exact functionality of R2 from R1.
The middle clusters (L2, and R3/4) had a more diversified connectivity profile, both structurally and functionally. For L2, we found functional connectivity in the right anterior cingulate region (BA25/32), the left anterior cingulate (BA24), and bilaterally in the superior temporal gyrus and the parietal lobe (BA40). BA40 has been associated with recollection of previously experience events, as well as retrieval of unpleasant experiences [Collins, 2014; Freeman et al., 2004], while BA24 and BA32 have been associated with successful memory retrieval and episodic memory encoding [Rugg et al., 1996; Zhang et al., 2014]. R3 was functionally connected to regions of the left posterior cingulate, parahippocampal gyrus, and prefrontal cortex, in addition to the middle temporal gyri and inferior frontal gyri (BA47) bilaterally. R4 had the most diverse functional connectivity profile of all the clusters. These data suggest that these clusters are well suited to carry out a diverse set of cognitive processes given their anatomical and structural connectivity to not only the limbic system, but also regions of the prefrontal, temporal, and parietal cortices.
The posterior portions of the hippocampus (L3 and R5) exhibited less similarity. For example, R5 had limited functional connectivity (left hippocampus and bilateral parahippocampal gyrus and left cingulate) compared with L3, which demonstrated functional connectivity throughout the prefrontal cortex, including the right anterior and posterior cingulate (BA24/30, respectively) and bilaterally within the superior temporal gyrus. However, in both cases, these segments were anatomically connected to similar regions, including the occipital lobe. These data suggest that these segmentations likely perform different operations given their functional and structural connectivity profiles, but both are likely to contribute to perceptual processes as they relate to other hippocampal‐reliant processing.
Hemispheric Specialization
Very few studies address the issue of lateralization when discussing the long‐axis anterior–posterior gradient, despite strong evolutionary and functional neuroimaging evidence suggesting that the right and left hippocampus likely have functional differences [Churchwell and Kesner, 2011; Gagliardo et al., 2005; Hami et al., 2014; Klur et al., 2009; Persson et al., 2013]. Most have theorized that the right hippocampus is primarily engaged in spatial processing (i.e., 3D spatial navigation, or remembering an object location), while the left is more attuned to verbal information [Duarte et al., 2014; Greve et al., 2011]. Additionally, lateralization appears to be preserved (i.e., dissociable roles of the hippocampus have been hypothesized in spatial navigation across species [Copara et al., 2014; Ekstrom et al., 2003; Gagliardo et al., 2005; Hami et al., 2014; Herold et al., 2014; Klur et al., 2009]), and has been linked to gender differences in humans [Persson et al., 2013]. Therefore, the current study allows for an objective assessment of the neurofunctional differences between the left and right hippocampus, void of reliance on any prior speculations with regard to laterality.
Our investigation supports lateralization differences given the different clustering profiles between the left and right hippocampus. The right hippocampus appears to be more functionally heterogeneous, as suggested by the post‐hoc functional decoding. This is likely also the reason for the less stable cluster solution. In addition, there were marked differences in the neurocognitive processes attributed to the anterior and posterior portions of the left and right hippocampus. For example, only L3 was associated with perceptual processing, while in the right hemisphere the anterior‐most clusters were associated with perceptual functions. This could potentially support previous findings of a preferential responding to spatial navigation and perceptual cues in the right hippocampus [Duarte et al., 2014], which appears to have an evolutionary basis [Burgess et al., 2002; Gagliardo et al., 2005; Klur et al., 2009; Mehlhorn et al., 2010]. Our DTI findings also provide evidence of neural architecture supporting a perceptual component for R1. Thus, we support the findings from previous studies suggesting a lateralized specialization of the hippocampi.
Theoretical Implications
Combined with evidence across studies, our data largely corroborate existing research, but also provide avenues for future research. For example, we have shown an anterior–posterior segmentation, that differs between hemispheres, which has not been noted previously. Our study provides motivation to revisit how hippocampal subfields may contribute to neurocognitive processes, especially in light of the study by Chase et al. (2015), by demonstrating strong evidence for an anterior–posterior gradient, consistent with the subiculum segmentation using similar methodology. Finally, our data are in partial concordance with the Moser and Moser (1998) model as well as the HERNET model. Specifically, with regard to the latter, our study revealed that the posterior portions of the hippocampus have interhemispheric connectivity leading to the posterior cingulate cortex, a pivotal hub of the default mode network. Kim (2015) posits that the posterior portions of the hippocampus, when activated, also recruit the default mode network as they are partially mediated by an internal attention network, with our DTI findings providing supportive evidence of this relationship. However, we find less support for the notion that the anterior hippocampus recruits the dorsal attention network in accordance with external attention. With regard to the Moser and Moser (1998) model, we find support for “hot” and “cold” processing along the anterior–posterior axis, but we also show that the anterior portions, particularly in the right hemisphere, appear to be engaged in “cold” processes as well.
The results from our study provide an initial model of hippocampal topography that is data‐driven, and accounts for cognitive and affective processes outside of just memory. One of the limitations of the existing research study is the need for additional data to fully parse the segmentation of the right hippocampus. Here, we presented both a 5‐cluster and a 2‐cluster solution, as the 5‐cluster solution was deemed to be marginally better than the 2‐cluster solution. However, as more data is added to the database, it may become clearer as to which solution is ideal. Furthermore, it is important to note that hippocampal subfields have been, and continue to be, studied extensively, and future studies should examine the relationship between these subfields and the hippocampus, as noted above. Finally, another theoretical consideration is that we have defined segmentation in terms of distinct clusters. It is plausible, and likely, that there is a gradient component to processing within the hippocampus that our current method cannot account for. Therefore, future studies should examine the possibility of a gradient‐like neurofunctional topography, and test for other potential features outside of paradigm class that may contribute to the topography (i.e., stimulus‐specific features, context‐dependency, familiarity, delay length for retrieval processes).
Finally, there are some limitations to our research. First, the data are reliant on the BrainMap database, which heavily favors cognition‐based functional neuroimaging studies. While this is representative of the field as a whole, having a more balanced behavioral domain representation may yield additional insights regarding neurofunctional contributions to each topographical segment. This may be partially underlying our right hippocampal results, where an obvious cluster solution did not emerge. Second, the use of ultra high field fMRI is a substantial advancement, but additional subjects may help to strengthen our understanding of the connectivity of the topographical segments. Furthermore, leveraging the spatial and temporal resolution advantages of ultra high field imaging may delineate relationships not otherwise afforded by conventional MRI studies using 3T (or lower) machines. Unfortunately, these high‐resolution methods are lacking, at the moment, with regard to important connectivity indices, such as those provided by DTI.
CONCLUSION
In summary, we used a combination of big data resources (i.e., the BrainMap database), advanced analytic strategies (i.e., co‐activation based parcellation and ALE), and state‐of‐the‐art technology (ultra high field, high‐resolution fMRI, and DTI data collection) to unpack the neurofunctional contributions of the hippocampus. Our data reveal a pattern of phylogenetically preserved lateralization differences that corroborate models of evolutionary development and neuroscience findings [Allen and Fortin, 2013; Manns and Eichenbaum, 2006]. Furthermore, the data provide a more detailed account of the potential topographical organization of the hippocampus in healthy individuals, using completely noninvasive methodology. This model should be further investigated by examining the roles of hippocampal subfields in the context of the neurofunctional topography proposed in the present study. Elucidating the neurofunctional geography could lead to transformative computational models of how the brain works under hippocampal‐dependent cognitive and emotive processes. Understanding these functional relationships should provide avenues for prevention and treatment of disorders involving the hippocampus.
Supporting information
Supporting Information
All authors report no conflicts of interest.
Footnotes
For both resting state and DTI, we carried out analyses with and without the left‐handed individuals. There were no statistically significant differences and only minor qualitative (i.e., size of cluster) differences that did not affect the results, thus we chose to include these data in our analyses. Our participants scored 7 and 10 out of 15 on a handedness questionnaire for the resting state analysis and for DTI we had participants with scores of 4, 7, 8, and 10 s, indicating that these participants were not exclusively left handed.
REFERENCES
- Allen TA, Fortin NJ (2013): The evolution of episodic memory. Proc Natl Acad Sci 110:10379–10386. [DOI] [PMC free article] [PubMed] [Google Scholar]
- Annese J, Schenker‐Ahmed NM, Bartsch H, Maechler P, Sheh C, Thomas N, Kayano J, Ghatan A, Bresler N, Frosch MP, Klaming R, Corkin S (2014): Postmortem examination of patient H.M.'s brain based on histological sectioning and digital 3D reconstruction. Nat Commun 5:3122. [DOI] [PMC free article] [PubMed] [Google Scholar]
- Ashburner J (2012): SPM: A history. NeuroImage 62:791–800. [DOI] [PMC free article] [PubMed] [Google Scholar]
- Augustinack JC, van der Kouwe AJW, Salat DH, Benner T, Stevens AA, Annese J, Fischl B, Frosch MP, Corkin S (2014): H.M.'s contributions to neuroscience: A review and autopsy studies. Hippocampus 24(11):1267–1286. [DOI] [PMC free article] [PubMed] [Google Scholar]
- Babiloni C, Ferretti A, Del Gratta C, Carducci F, Vecchio F, Romani GL, Rossini PM (2005): Human cortical responses during one‐bit delayed‐response tasks: An fMRI study. Brain Res Bull 65:383–390. [DOI] [PubMed] [Google Scholar]
- Baker JT, Sanders AL, Maccotta L, Buckner RL (2001): Neural correlates of verbal memory encoding during semantic and structural processing tasks. Neuroreport 12:1251–1256. [DOI] [PubMed] [Google Scholar]
- Behrens TEJ, Johansen‐Berg H, Woolrich MW, Smith SM, Wheeler‐Kingshott CAM, Boulby PA, Barker GJ, Sillery EL, Sheehan K, Ciccarelli O, Thompson AJ, Brady JM, Matthews PM (2003a): Non‐invasive mapping of connections between human thalamus and cortex using diffusion imaging. Nat Neurosci 6:750–757. [DOI] [PubMed] [Google Scholar]
- Behrens TEJ, Woolrich MW, Jenkinson M, Johansen‐Berg H, Nunes RG, Clare S, Matthews PM, Brady JM, Smith SM (2003b): Characterization and propagation of uncertainty in diffusion‐weighted MR imaging. Magn Reson Med 50:1077–1088. [DOI] [PubMed] [Google Scholar]
- Behrens TEJ, Woolrich MW, Jenkinson M, Johansen‐Berg H, Nunes RG, Clare S, Matthews PM, Brady JM, Smith SM (2003c): Characterization and propogation of uncertainty in diffusion‐weight MR imaging. Magn Reson Med 50:1077–1088. [DOI] [PubMed] [Google Scholar]
- Bunzeck N, Schütze H, Düzel E (2006): Category‐specific organization of prefrontal response‐facilitation during priming. Neuropsychologia 44:1765–1776. [DOI] [PubMed] [Google Scholar]
- Burgess N, Maguire EA, O'Keefe J (2002): The human hippocampus and spatial and episodic memory. Neuron 35:625–641. [DOI] [PubMed] [Google Scholar]
- Bzdok D, Laird AR, Zilles K, Fox PT, Eickhoff SB (2012): An investigation of the structural, connectional, and functional subspecialization in the human amygdala. Hum Brain Mapp 34:3247–3266. [DOI] [PMC free article] [PubMed] [Google Scholar]
- Bzdok D, Langner R, Schilbach L, Jakobs O, Roski C, Caspers S, Laird AR, Fox PT, Zilles K, Eickhoff SB (2013): Characterization of the temporo‐parietal junction by combining data‐driven parcellation, complementary connectivity analyses, and functional decoding. NeuroImage 81:381–392. [DOI] [PMC free article] [PubMed] [Google Scholar]
- Cajal SR (1901): Significación probable de las células de axón corto. Trab Lab Investig Biol 1:151–157. [Google Scholar]
- Cauda F, Costa T, Torta DME, Sacco K, D'Agata F, Duca S, Geminiani G, Fox PT, Vercelli A (2012): Meta‐analytic clustering of the insular cortex: Characterizing the meta‐analytic connectivity of the insula when involved in active tasks. NeuroImage 62:343–355. [DOI] [PMC free article] [PubMed] [Google Scholar]
- Chase HW, Clos M, Dibble S, Fox P, Grace AA, Phillips ML, Eickhoff SB (2015): Evidence for an anterior–posterior differentiation in the human hippocampal formation revealed by meta‐analytic parcellation of fMRI coordinate maps: Focus on the subiculum. NeuroImage 113:44–60. [DOI] [PMC free article] [PubMed] [Google Scholar]
- Churchwell JC, Kesner RP (2011): Hippocampal‐prefrontal dynamics in spatial working memory: Interactions and independent parallel processing. Behav Brain Res 225:389–395. [DOI] [PMC free article] [PubMed] [Google Scholar]
- Cieslik EC, Zilles K, Caspers S, Roski C, Kellermann TS, Jakobs O, Langner R, Laird AR, Fox PT, Eickhoff SB (2013): Is There “one” DLPFC in cognitive action control? Evidence for heterogeneity from co‐activation‐based parcellation. Cereb Cortex 23:2677–2689. [DOI] [PMC free article] [PubMed] [Google Scholar]
- Clos M, Amunts K, Laird AR, Fox PT, Eickhoff SB (2013): Tackling the multifunctional nature of Broca's region meta‐analytically: Co‐activation‐based parcellation of area 44. NeuroImage 83:174–188. [DOI] [PMC free article] [PubMed] [Google Scholar]
- Collins F (2014): BRAIN: Launching America's Next Moonshot. NIH Director's Blog. Washington, D.C: National Institutes of Health. [Google Scholar]
- Copara MS, Hassan AS, Kyle CT, Libby LA, Ranganath C, Ekstrom AD (2014): Complementary roles of human hippocampal subregions during retrieval of spatiotemporal context. J Neurosci 34:6834–6842. [DOI] [PMC free article] [PubMed] [Google Scholar]
- Demb JB, Desmond JE, Wagner AD, Vaidya CJ, Glover GH, Gabrieli JD (1995): Semantic encoding and retrieval in the left inferior prefrontal cortex: A functional MRI study of task difficulty and process specificity. J Neurosci 15:5870–5878. [DOI] [PMC free article] [PubMed] [Google Scholar]
- Duarte IC, Ferreira C, Marques J, Castelo‐Branco M (2014): Anterior/posterior competitive deactivation/activation dichotomy in the human hippocampus as revealed by a 3D navigation task. PLoS ONE 9:e86213. [DOI] [PMC free article] [PubMed] [Google Scholar]
- Duncan K, Tompary A, Davachi L (2014): Associative encoding and retrieval are predicted by functional connectivity in distinct hippocampal area CA1 pathways. J Neurosci 34:11188–11198. [DOI] [PMC free article] [PubMed] [Google Scholar]
- Eickhoff SB, Laird AR, Grefkes C, Wang LE, Zilles K, Fox PT (2009): Coordinate‐based activation likelihood estimation meta‐analysis of neuroimaging data: A random‐effects approach based on empirical estimates of spatial uncertainty. Hum Brain Mapp 30:2907–2926. [DOI] [PMC free article] [PubMed] [Google Scholar]
- Eickhoff SB, Bzdok D, Laird AR, Roski C, Caspers S, Zilles K, Fox PT (2011): Co‐activation patterns distinguish cortical modules, their connectivity and functional differentiation. NeuroImage 57:938–949. [DOI] [PMC free article] [PubMed] [Google Scholar]
- Eickhoff SB, Bzdok D, Laird AR, Kurth F, Fox PT (2012): Activation likelihood estimation meta‐analysis revisited. NeuroImage 59:2349–2361. [DOI] [PMC free article] [PubMed] [Google Scholar]
- Eickhoff SB, Laird AR, Fox PT, Bzdok D, Hensel L (in press): Functional segregation of the human dorsomedial prefrontal cortex. Cereb Cortex. Available at http://www.ncbi.nlm.nih.gov/pubmed/25331597 [DOI] [PMC free article] [PubMed] [Google Scholar]
- Ekstrom AD, Kahana MJ, Caplan JB, Fields TA, Isham EA, Newman EL, Fried I (2003): Cellular networks underlying human spatial navigation. Nature 425:184–188. [DOI] [PubMed] [Google Scholar]
- Fanselow MS, Dong HW (2010): Are the dorsal and ventral hippocampus functionally distinct structures? Neuron 65:7–19. [DOI] [PMC free article] [PubMed] [Google Scholar]
- Forgy EW (1965): Cluster analysis of multivariate data: Efficiency versus interpretability of classifications. Biometrics 21:768–769. [Google Scholar]
- Fox PT, Lancaster JL (2002): Mapping context and content: The BrainMap model. Nat Rev Neurosci 3:319–321. [DOI] [PubMed] [Google Scholar]
- Freeman HD, Cantalupo C, Hopkins WD (2004): Asymmetries in the hippocampus and amygdala of chimpanzees (Pan troglodytes). Behav Neurosci 118:1460–1465. [DOI] [PMC free article] [PubMed] [Google Scholar]
- Gagliardo A, Vallortigara G, Nardi D, Bingman VP (2005): A lateralized avian hippocampus: Preferential role of the left hippocampal formation in homing pigeon sun compass‐based spatial learning. Eur J Neurosci 22:2549–2559. [DOI] [PubMed] [Google Scholar]
- Greicius MD, Krasnow B, Reiss AL, Menon V (2003): Functional connectivity in the resting brain: A network analysis of the default mode hypothesis. Proc Natl Acad Sci 100:253–258. [DOI] [PMC free article] [PubMed] [Google Scholar]
- Greve A, Evans CJ, Graham KS, Wilding EL (2011): Functional specialisation in the hippocampus and perirhinal cortex during the encoding of verbal associations. Neuropsychologia 49:2746–2754. [DOI] [PubMed] [Google Scholar]
- Hami J, Kheradmand H, Haghir H (2014): Gender differences and lateralization in the distribution pattern of insulin‐like growth factor‐1 receptor in developing rat hippocampus: An immunohistochemical study. Cell Mol Neurobiol 34:215–226. [DOI] [PMC free article] [PubMed] [Google Scholar]
- Hartigan JA, Wong MA (1979): A k‐means clustering algorithm. Appl Stat 28:100–108. ( [Google Scholar]
- Herold C, Bingman VP, Ströckens F, Letzner S, Sauvage M, Palomero‐Gallagher N, Zilles K, Güntürkün O (2014): Distribution of neurotransmitter receptors and zinc in the pigeon (Columba livia) hippocampal formation: A basis for further comparison with the mammalian hippocampus. J Comp Neurol 522(11):2553−2575. [DOI] [PubMed] [Google Scholar]
- Jenkinson M, Smith SM (2001): A global optimisation method for robust affine registration of brain images. Med Image Anal 5:143–156. [DOI] [PubMed] [Google Scholar]
- Jenkinson M, Bannister PR, Brady JM, Smith SM (2002): Improved optimisation for the robust and accurate linear registration and motion correction of brain images. NeuroImage 17:825–841. [DOI] [PubMed] [Google Scholar]
- Jenkinson M, Beckmann CF, Behrens TEJ, Woolrich MW, Smith SM (2012): FSL. NeuroImage 62:782–790. [DOI] [PubMed] [Google Scholar]
- Johansen‐Berg H, Behrens TEJ, Sillery E, Ciccarelli O, Thompson AJ, Smith SM, Matthews PM (2005): Functional–anatomical validation and individual variation of diffusion tractography‐based segmentation of the human thalamus. Cereb Cortex 15:31–39. [DOI] [PubMed] [Google Scholar]
- Kim H (2015): Encoding and retrieval along the long axis of the hippocampus and their relationships with dorsal attention and default mode networks: The HERNET model. Hippocampus 25:500–510. [DOI] [PubMed] [Google Scholar]
- King KG, Glodzik L, Liu S, Babb JS, de Leon MJ, Gonen O (2008): Anteroposterior hippocampal metabolic heterogeneity: Three dimensional multivoxel proton 1H MR sprectroscopic imaging ‐ Initial findings. Radiology 249:242–250. [DOI] [PMC free article] [PubMed] [Google Scholar]
- Klur S, Muller C, Pereira de Vasconcelos A, Ballard T, Lopez J, Galani R, Certa U, Cassel J‐C (2009): Hippocampal‐dependent spatial memory functions might be lateralized in rats: An approach combining gene expression profiling and reversible inactivation. Hippocampus 19:800–816. [DOI] [PubMed] [Google Scholar]
- Laird AR, Lancaster JL, Fox PT (2005): BrainMap: The social evolution of a human brain mapping database. Neuroinformatics 3:65–78. [DOI] [PubMed] [Google Scholar]
- Laird AR, Eickhoff SB, Kurth F, Fox PM, Uecker AM, Turner JA, Robinson JL, Lancaster JL, Fox PT (2009): ALE meta‐analysis workflows via the BrainMap database: Progress towards a probabilistic functional brain atlas. Front Neuroinform 3:1–11. [DOI] [PMC free article] [PubMed] [Google Scholar]
- Li PC, Gong H, Yang JJ, Zeng SQ, Luo QM, Guan LC (2000): Left prefrontal cortex activation during semantic encoding accessed with functional near infrared imaging. Space Med Med Eng 13:79–83. [PubMed] [Google Scholar]
- Lowe A, Dalton M, Sidhu K, Sachdev P, Reynolds B, Valenzuela M (2015): Neurogenesis and precursor cell differences in the dorsal and ventral adult canine hippocampus. Neurosci Lett 593 :107–113. ( [DOI] [PubMed] [Google Scholar]
- Maneshi M, Vahdat S, Fahoum F, Grova C, Gotman J (2014): Specific resting‐state brain networks in mesial temporal lobe epilepsy. Front Neurol 5:127. [DOI] [PMC free article] [PubMed] [Google Scholar]
- Manns JR, Eichenbaum H (2006): Evolution of declarative memory. Hippocampus 16:795–808. [DOI] [PubMed] [Google Scholar]
- Mehlhorn J, Haastert B, Rehkämper G (2010): Asymmetry of different brain structures in homing pigeons with and without navigational experience. J Exp Biol 213:2219–2224. [DOI] [PubMed] [Google Scholar]
- Moser MB, Moser EI (1998): Functional differentiation in the hippocampus. Hippocampus 8:608–619. [DOI] [PubMed] [Google Scholar]
- Persson J, Herlitz A, Engman J, Morell A, Sjölie D, Wikström J, Söderlund H (2013): Remembering our origin: Gender differences in spatial memory are reflected in gender differences in hippocampal lateralization. Behav Brain Res 256:219–228. [DOI] [PubMed] [Google Scholar]
- Poppenk J, Evensmoen HR, Moscovitch M, Nadel L (2013): Long‐axis specialization of the human hippocampus. Trends Cogn Sci 17:230–240. [DOI] [PubMed] [Google Scholar]
- Prince SE, Daselaar SM, Cabeza R (2005): Neural correlates of relational memory: Successful encoding and retrieval of semantic and perceptual associations. J Neurosci 25:1203–1210. [DOI] [PMC free article] [PubMed] [Google Scholar]
- Rämä P, Martinkauppi S, Linnankoski I, Koivisto J, Aronen HJ, Carlson S (2001): Working memory of identification of emotional vocal expressions: An fMRI study. NeuroImage 13:1090–1101. [DOI] [PubMed] [Google Scholar]
- Robinson JL, Laird AR, Glahn DC, Lovallo WR, Fox PT (2010): Metaanalytic connectivity modeling: Delineating the functional connectivity of the human amygdala. Hum Brain Mapp 31:173–184. [DOI] [PMC free article] [PubMed] [Google Scholar]
- Robinson JL, Laird AR, Glahn DC, Blangero J, Sanghera MK, Pessoa L, Fox PM, Uecker A, Friehs G, Young KA, Griffin JL, Lovallo WR, Fox PT (2012): The functional connectivity of the human caudate: An application of meta‐analytic connectivity modeling with behavioral filtering. NeuroImage 60:117–129. [DOI] [PMC free article] [PubMed] [Google Scholar]
- Rugg MD, Fletcher PC, Frith CD, Frackowiak RSJ, Dolan RJ (1996): Differential activation of the prefrontal cortex in successful and unsuccessful memory retrieval. Brain 119:2073–2083. [DOI] [PubMed] [Google Scholar]
- Scoville WB, Milner B (1957): Loss of recent memory after bilateral hippocampal lesions. J Neurol Neurosurg Psychiatry 20:11–21. [DOI] [PMC free article] [PubMed] [Google Scholar]
- Smith EE, Jonides J, Marshuetz C, Koeppe RA (1998): Components of verbal working memory: Evidence from neuroimaging. Proc Natl Acad Sci 95:876–882. [DOI] [PMC free article] [PubMed] [Google Scholar]
- Smith SM, Jenkinson M, Woolrich MW, Beckmann CF, Behrens TEJ, Johansen‐Berg H, Bannister PR, De Luca M, Drobnjak I, Flitney DE, Niazy RK, Saunders J, Vickers J, Zhang Y, De Stefano N, Brady JM, Matthews PM (2004): Advances in functional and structural MR image analysis and implementation as FSL. NeuroImage 23:S208–S219. [DOI] [PubMed] [Google Scholar]
- Spielberg JM, McGlinchey RE, Milberg WP, Salat DH (2015): Brain network disturbance related to posttraumatic stress and traumatic brain injury in veterans. Biol Psychiatry 78(3):210–216. [DOI] [PubMed] [Google Scholar]
- Stoeckel LE, Palley LS, Gollub RL, Niemi SM, Evins AE (2014): Patterns of brain activation when mothers view their own child and dog: An fMRI study. PLoS ONE 9:e107205. [DOI] [PMC free article] [PubMed] [Google Scholar]
- Strange BA, Hurlemann R, Duggins A, Heinze H‐J, Dolan RJ (2005): Dissociating intentional learning from relative novelty responses in the medial temporal lobe. NeuroImage 25:51–62. [DOI] [PubMed] [Google Scholar]
- Treadway MT, Waskom ML, Dillon DG, Holmes AJ, Park MTM, Chakravarty MM, Dutra SJ, Polli FE, Iosifescu DV, Fava M, Gabrieli JD, Pizzagalli DA (2015): Illness progression, recent stress, and morphometry of hippocampal subfields and medial prefrontal cortex in major depression. Biol Psychiatry 77(3):285–294. [DOI] [PMC free article] [PubMed] [Google Scholar]
- Tsukiura T, Cabeza R (2008): Orbitofrontal and hippocampal contributions to memory for face–name associations: The rewarding power of a smile. Neuropsychologia 46:2310–2319. [DOI] [PMC free article] [PubMed] [Google Scholar]
- Whitfield‐Gabrieli S, Nieto‐Castanon A (2012): Conn: A functional connectivity toolbox for correlated and anticorrelated brain networks. Brain Connect 2:125–141. [DOI] [PubMed] [Google Scholar]
- Zhang JX, Zhuang J, Ma L, Yu W, Peng D, Ding G, Zhang Z, Weng X (2004): Semantic processing of Chinese in left inferior prefrontal cortex studied with reversible words. NeuroImage 23:975–982. [DOI] [PubMed] [Google Scholar]
- Zhang Z, Lovato J, Battapady H, Davatzikos C, Gerstein HC, Ismail‐Beigi F, Launer LJ, Murray A, Punthakee Z, Tirado AA, Williamson J, Bryan RN, Miller ME (2014): Effect of hypoglycemia on brain structure in people with Type 2 diabetes: Epidemiological analysis of the ACCORD‐MIND MRI trial. Diabetes Care 37(12):3279–3285. [DOI] [PMC free article] [PubMed] [Google Scholar]
Associated Data
This section collects any data citations, data availability statements, or supplementary materials included in this article.
Supplementary Materials
Supporting Information