Abstract
The presence of an anatomical connection between the orbitofrontal cortex and ventral striatum, forming a so‐called reward network, is well established across species. This connection has important implications for reward processing and is relevant to a number of neuropsychiatric disorders. Moreover, white matter (WM) is known to continue to mature across adolescence and into early adulthood, and developmental change in the reward network is an important component of models of decision making and risk taking. Despite the importance of this connection, the underlying WM has only recently been characterized in humans histologically, and not yet in‐vivo using brain imaging. Here, we implemented diffusion tensor imaging (DTI) in a large cross‐sectional sample of 295 healthy individuals ages 8–68 to further characterize the WM of this connection and its development from childhood into adulthood. We demonstrate that the accumbofrontal tract, connecting the orbitofrontal cortex and nucleus accumbens, can be identified using standard DTI sequences. Using Poisson modeling, we show that the accumbofrontal tract undergoes significant change across the lifespan, with males showing a higher and earlier peak compared to females. Moreover, the change occurs in a pattern consistent with developmental models of decision‐making. These findings support the hypothesis that developmental differences in WM integrity may be a contributing factor to the observed risk taking that occurs in adolescence. The accumbofrontal tract is not yet included in standard WM atlases, but may be important for inclusion in studies investigating fronto‐striatal networks, as well as in investigations of substance abuse and decision making. Hum Brain Mapp 36:4954–4963, 2015. © 2015 Wiley Periodicals, Inc.
Keywords: white matter, decision making, growth and development, neuroimaging, brain, frontal lobe, reward
INTRODUCTION
Anatomical connections between the prefrontal cortex (PFC) and striatum have been well established across a number of species, with the pathways arranged in a series of parallel and functionally distinct circuits [Alexander, et al., 1990; Haber, et al., 1995]. One pathway of interest is the connection of the orbitofrontal cortex (OFC) to the nucleus accumbens (NAcc), due to its association with reward processing. However, although the functional relationship between the NAcc and OFC has been frequently described, the structural basis of this connection has not been fully investigated in humans. A recent histological report in 30 brain specimens demonstrated for the first time the physical presence of an “accumbofrontal” tract in humans [Rigoard, et al., 2011], consistent with results from studies in primates [Haber, et al., 1995]. Diffusion tensor imaging (DTI) has the potential to elucidate a number of important features of this tract in‐vivo.
Functional anatomy of the ventral striatum (or NAcc) has long been associated with reward sensitivity [Koob, 2000; Saddoris, et al., 2013]. The NAcc is divided into two subregions, the shell and the core, which differ in their connectivity [Brog, et al., 1993]. NAcc‐OFC connections project primarily from the core region [Haber, et al., 1995]). While their respective roles are to some degree task or situation dependent, generally the shell has been shown to be associated with dopaminergic changes in response to drugs of abuse [Pontieri, et al., 1995]. Alternately, the core may have a role in cognitive computations such as cost‐benefit analyses in reward based decision making [Saddoris, et al., 2014], which is consistent with its PFC connections. Along with the NAcc, the OFC is also sensitive to reward valence and outcome [Knutson, et al., 2003; O'Doherty, 2004; Rolls and Grabenhorst, 2008]. The OFC is thought to regulate the formation of associations between rewards and other stimuli, in part by modulating the weighting of reward, and then using that information to guide the selection of actions [Li, et al., 2003]. Accordingly, functional magnetic resonance imaging (fMRI) studies have revealed OFC activation during salience attribution [Volkow, et al., 2012] and reward anticipation [Galvan, et al., 2005].
Developmentally, the OFC and NAcc have special relevance as they have been proposed to comprise part of a larger reward network that, along with a cognitive control network, is implicated in models of decision‐making development. The cognitive control network consists of grey matter regions such as the dorsolateral PFC, frontal eye field, anterior cingulate, and parietal cortex, as well as the primary fronto‐parietal white matter connection, the superior longitudinal fasciculus (SLF) which plays a well established role in executive function [Karlsgodt, et al., 2008; Karlsgodt, et al., 2010; Peters, et al., 2014]. The reward network in part consists of the OFC and striatal regions, which include the NAcc. Previous work indicates that reward and executive functions do not mature in tandem. Rather, there is behavioral evidence that the reward network matures earlier resulting in higher reward sensitivity, or a stronger motivation to seek out opportunities perceived as rewarding. The cognitive control or executive network matures slowly, leaving the reward sensitive adolescent with a decreased ability to regulate behavior [Figure 1; Casey, et al., 2008; Crone and Dahl, 2012; Ernst, et al., 2006; Luna, et al., 2010]. This model has been investigated using fMRI and behavioral measures. However, despite the fact that myelination is known to continue into adolescence and early adulthood, no work assessing the potential contribution of white matter structural maturation to this model is available.
Figure 1.
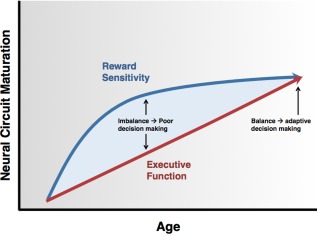
Model of development of decision making, as a result of differences between patterns of maturation in the executive and reward networks (Ernst, 2006; Casey, 2008; Crone, 2012; Luna, 2010). [Color figure can be viewed in the online issue, which is available at http://wileyonlinelibrary.com.]
The goal of this study was to characterize, in vivo, the white matter connection between the ventral striatum and the orbitofrontal cortex using DTI tractography. An additional goal was to examine age‐associated changes in this bundle and assess sex differences in peak maturation. Our intention was also to describe the changes in this region with age and its relationship to other tracts in the executive network, in accordance with decision making models.
METHODS
Two‐hundred and ninety‐five healthy individuals (51.6% male) between the ages of 8.1 and 68.1 years (mean 29.72 ± 14.31; median 25.97) were recruited through local advertisements and by word of mouth and participated in MRI scans through research studies at Zucker Hillside Hospital. Of the scans included in this analysis, 196 overlap with data described in a previous study from our group [Peters, et al., 2012], although the previous work did not include the accumbofrontal tract. Written informed consent was obtained from participants or from a parent or guardian if the participant was a minor; all minors provided assent. Participants had no history of a DSM‐IV Axis I major mood or psychotic disorder as assessed by structured clinical diagnostic interview [First, et al., 1997]. Other exclusion criteria included (1) intellectual or learning disability, (2) medications with known adverse cognitive effects, (3) magnetic resonance imaging contraindications, (4) pregnancy, and (5) significant medical illness that could affect brain structure or function. Mean IQ as estimated from the Wide Range Achievement Test 3 (WRAT‐3)‐reading subtest was available for 262 participants, mean 103.29 ± 0.74 [Wilkinson, 1993]. Handedness was determined using the Edinburgh Handedness Inventory [Oldfield, 1971], in 262 participants with available data. A laterality quotient was calculated by calculating the total number of right and left hand items and computing a score as follows: (Total R − Total L)/(Total R + Total L) yielding a range from +1.00 (totally dextral) to −1.00 (totally nondextral). Individuals with a laterality quotient greater than 0.70 are considered dextral and the rest as nondextral. In our sample the mean laterality quotient was 0.75 ± 0.03. This study was approved by the Institutional Review Board of the North Shore–Long Island Jewish Health System.
All subjects received a DTI exam at the North Shore University Medical Center, Manhasset, New York, on a GE Signa HDx 3.0 T system (General Electric, Milwaukee, Wisconsin). The sequence included volumes with diffusion gradients applied along 31 nonparallel directions (bvalue: 1,000 s/mm2) and five volumes without diffusion weighting (repetition time: 14 s, echo time = minimum, matrix: 128 × 128, field of view: 240 mm). Each volume consisted of 51 contiguous 2.5‐mm axial slices acquired parallel to the anterior‐posterior commissural line using a ramp sampled, double spin‐echo, single shot echo‐planar imaging method. All scans were reviewed by a radiologist, and all images were visually inspected to ensure that no gross abnormalities or artifacts were evident. Image processing was conducted using the Functional Magnetic Resonance Imaging of the Brain Software Library (FSL version 5.1; Oxford, United Kingdom; http://fsl.fmrib.ox.ac.uk/fsl). Eddy‐current induced distortions and head‐motion displacements were corrected through affine registration of the 31 diffusion volumes to the first b0 volume using FSL's Linear Registration Tool. The b‐vector table (i.e., gradient directions) for each participant was then adjusted according to the rotation parameters of this linear correction. Non‐brain tissue was removed using FSL's Brain Extraction Tool. Fractional anisotropy (FA), an index of white matter integrity, and diffusivity measures were then calculated at each voxel of the brain by fitting a diffusion tensor model to the raw diffusion data using weighted least squares in FSL's Diffusion Toolbox. FA was chosen as the primary measure for analysis because it has been the most widely used measure in relevant studies and thereby provides optimal between‐study comparability. Ancillary analyses investigated axial, radial, and mean diffusivity.
Tractography
The probable trajectory of the accumbofrontal tract was traced as follows. Within‐voxel probability density functions of the principal diffusion direction were estimated using Markov Chain Monte Carlo sampling in FSL's BEDPOSTX tool [Behrens, et al., 2003]. A spatial probability density function was then estimated across voxels based on these local probability density functions using FSL's PROBTRACKX tool [Behrens, et al., 2003], in which 5,000 samples were taken for each input voxel with a 0.2 curvature threshold, 0.5‐mm step length, and 2,000 steps per sample. For each tract, seed masks, waypoints, termination and exclusion masks were defined on the MNI152 T1 1‐mm template. For the accumbofrontal tract, exclusion maps included the entire contralateral hemisphere, superior frontal regions, and regions posterior to the striatum, and the seed masks were Harvard‐Oxford atlas defined ROIs of the NAcc and OFC. Masks were normalized to each subjects’ diffusion space using FSL's Linear Registration Tool [Jenkinson and Smith, 2001] applying the affine parameters obtained by coregistering the first b0 volume to the MNI152 T1 1‐mm template. The resulting tracts were thresholded at a normalized probability value of 0.01 and visually inspected to confirm successful tracing in each individual subject (http://karlsgodtlab.org/HBM_accumbofrontal). While the tract was robustly detectable, it is notably located in a region subject to susceptibility artifacts. These should be alleviated as much as possible through quality control measures on completed data, and through optimization of individual scan sequences for new data. Mean FA of the entire tract was then extracted for analysis. The fronto‐parietal connection, the SLF, was also traced, as a comparison tract that is involved in executive functioning, and the methods for SLF extraction are described in Peters et al. (2014).
Statistical Analyses
To investigate differences in white matter across the lifespan, we first assessed FA, a putative measure of white matter integrity that may index tract myelination and organization. To calculate the cross‐sectional measure of age‐related change in FA, a poisson model was used, because it has previously been demonstrated to be the most sensitive model of age related DTI changes, and it permits different slope and curvatures on both sides of the age peak (Peters, 2014; Lebel, 2012). Age‐FA curves were fitted with a Poisson model (c + a * Age * exp (‐b * Age2) using the nls2 package in R. Model fits were assessed with Akaike's information criterion [AIC [Akaike, 1974]. Separate Poisson models/curves were fit for each displayed trajectory (left, right, left‐right mean). Bootstrap resampling methods were used to estimate the standard errors of the peaks.
Because evidence suggests sex differences across neurodevelopment, we next assessed sex differences in age‐related changes. The difference in trajectories between males and females (i.e., age × sex interaction) was determined by computing the difference in the “a” coefficients and “b” coefficients in the Poisson model separately. Note, both “a” and “b” contribute to the shape of the trajectories. The difference in the “a” coefficients between males and females was divided by the pooled standard error to obtain a t‐statistic. The p‐value was obtained by calculating the two‐tails area of the corresponding null t‐distribution. The p‐value for difference in “b” coefficients was similarly obtained.
Finally we used DTI measures from the SLF and accumbofrontal tracts, in each subject, to determine whether there was a significantly different pattern of maturation between the two tracts. This analysis was performed by creating an indicator variable for SLF and accumbofrontal tracts, and assessing its interaction with the age variable. As this analysis had to take into account the within subject correlation for SLF and accumbofrontal tracts, we used mixed models with the “PROC MIXED” procedure in SAS. The mixed model included the indicator variable mentioned above, age, age2 and the interaction terms of the indicator variable with age and age2.
RESULTS
Tractography
First, we performed tractography between regions in the NAcc and the OFC, to establish the location of the tract. Our analysis shows that it is possible to visualize the accumbofrontal tract, with in vivo DTI tractography (see Fig. 2). Figure 2 includes images of the histological findings of Rigoard, for visual comparison purposes. Moreover, visual inspection of each individual's data demonstrated that the tract was present in all subjects scanned. The tract is adjacent to, but not the same as, the anterior thalamic radiation and the superior portion of the uncinate fasciculus. This is consistent with the histological data indicating that this is a specific and unique projection from the striatum to the frontal lobe [Rigoard, et al., 2011; Fig. 3].
Figure 2.
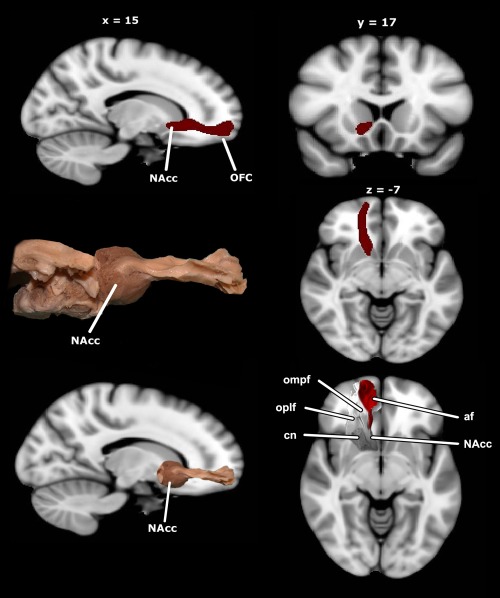
Diffusion tensor imaging (DTI) characterization of the accumbofrontal tract, from the nucleus accumbens (NAcc) to orbitofrontal cortex (OFC). Upper left: sagittal view of accumbofrontal tractography in the right hemisphere; upper right: coronal view of accumbofrontal tractography, right hemisphere; middle left: histological dissection of accumbofrontal tract for visualization purposes (Rigoard, 2011); middle right: axial view of accumbofrontal tractography, right hemisphere; lower left: overlay of histological dissection and standard space MRI for visualization purposes; lower right: visualization of the histological relationship between accumbofrontal tract (af) and the adjacent orbitomedial prefrontal cortex (ompf) and orbitolateral prefrontal cortex (oplf), based on dissections by Rigoard (personal communication).
Figure 3.
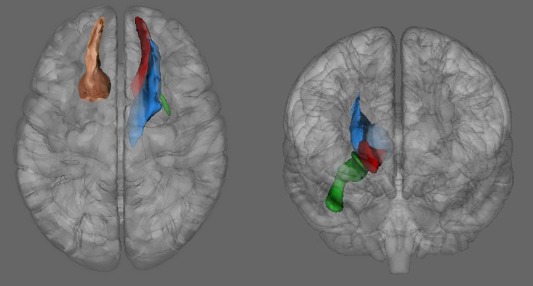
Visualization of the accumbofrontal tract from the current sample (red) alongside the uncinate fasciculus (green) and the anterior thalamic radiation (blue) from Peters, 2014. Left panel: 3D axial view, with histological overlay for visual comparison (Rigoard, 2011). Right panel, coronal 3D view of the three tracts.
Age related change in FA
Next, we cross‐sectionally assessed age‐related change in FA of the accumbofrontal tract across the lifespan. Overall, average FA in the accumbofrontal tract showed significant change with age across the lifespan (Fig. 4). This took the form of an early peak, at age 14.8(1.76) (all results reported as peak(bootstrap standard error)), which then decreased rapidly and then leveled out. This peak is substantially earlier than the previously reported peaks in other tracts in analyses from a substantially overlapping sample [Peters, et al., 2014]. There were no hemispheric effects in FA, the peaks of 14.02(1.98) on the left and 14.72(1.60) on the right were not significantly different (P = 0.4406 for the a term and P = 0.2786 for the b term; in the Poisson model both terms must be significant).
Figure 4.
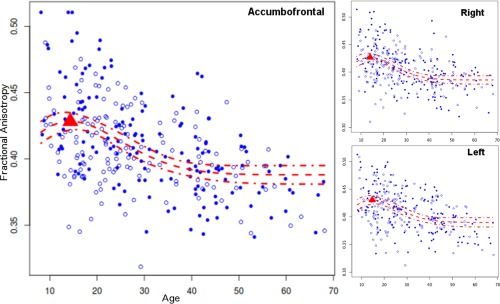
Pattern of age related change in the accumbofrontal tract, demonstrating an early peak in fractional anisotropy (FA) on average, and in each of the left and right hemispheres. Solid dots, male subjects; open dots, female subjects.
Sex Differences
Due to findings in the literature of developmental differences between males and females, we tested for effects of sex on the developmental trajectory. There was a significant sex difference in age related change, such that males showed a higher and earlier peak [age 13.9(6.85)] during adolescence compared to females [peak age 18.6(3.79)] P < 0.0001 for the a term, P < 0.0001 for the b term in the Poisson model), while the trajectories became more similar with age (Fig. 5). This was consistent for both the left hemisphere (peak age 14.7(8.05) for males and 17.3(3.78) for females; P = 0.0011 for the a term, P < 0.0001 the b term of the Poisson model), and the right hemisphere (peak age 12.8(8.93) for males and 19.1(3.29) for females; P = 0.0004 for the a term, P < 0.0001 for the the b term of the Poisson model).
Figure 5.
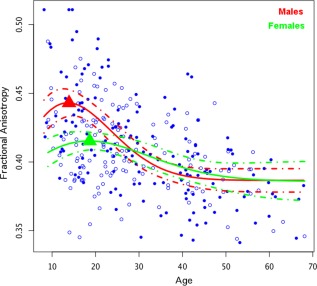
Sex differences were observed in the pattern of maturation of the accumbofrontal tract such that males showed an earlier and more pronounced peak in fractional anisotropy.
Additional Diffusion Tensor Imaging Measures
To better characterize the changes occurring across development in the accumbofrontal tract, we also assessed other measures of white matter integrity including radial diffusivity, axial diffusivity, and mean diffusivity. In the accumbofrontal tract, radial diffusivity, which measures diffusion perpendicular to the axons, is a putative measure of myelin thickness and tract spacing [Song, et al., 2003; Song, et al., 2002], peaked at age 18.41(1.70) (slightly later on the left, 20.07(1.66), compared to the right 17.51(1.73) (P = 0.0111 for the a term and P = 0.0187 for the b term of the Poisson model). Axial diffusivity, putatively indexing tract organization [Song, et al., 2003; Wozniak and Lim, 2006], peaked later at 26.95(1.65) (30.43(3.07) on the left, 24.62(1.66) on the right with a significant difference between hemispheres (P = 0.0189 for the a term, and P = 0.039 for the b term of the Poisson model). Finally, mean diffusivity, an overall measure of tissue spacing, peaked at 20.42(1.67) (22.36(1.69) on the left, 19.07(1.74) on the right).
Comparison with SLF (Executive Network) White Matter
Finally, due to the hypothesized difference in the maturation of the executive and reward networks, and the relationship to decision making, we also compared the pattern of age related differences between the SLF and accumbofrontal tract (Fig. 6). The SLF had a later peak (30.43(1.59)) than did the accumbofrontal tract; however the SLF showed no significant sex differences across development (P = 0.102 for the a term, P < 0.0001 on the b term in the Poisson model). Importantly, there was a significant interaction between the age related change in the accumbofrontal tract and the SLF (P < 0.0001 for both a and b terms), which remained true on both the left (P < 0.0001 for both the a and b terms), and the right (P < 0.0001 for both a and b terms). The difference between tracts was such that the accumbofrontal tract showed a significantly earlier peak than the SLF.
Figure 6.
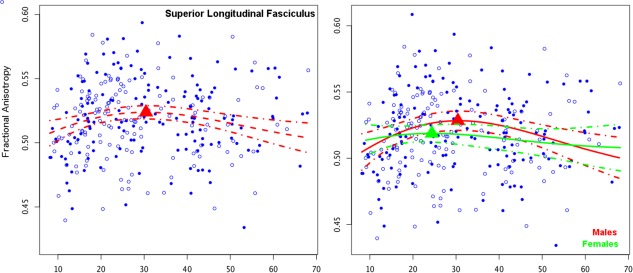
As a comparison, maturation of the superior longitudinal fasciculus (SLF), the white matter underlying the executive network, showing a later peak (left) than the accumbofrontal tract; no sex differences were observed (right).
DISCUSSION
We demonstrate for the first time that the “accumbofrontal tract,” which has previously been described using histology, is detectable in vivo with standard DTI in humans. Moreover, this tract shows age related changes, and matures in a manner different than a tract associated with executive function. Importantly, the pattern observed, in which the accumbofrontal “reward tract” matures earlier than the fronto‐parietal “executive tract,” is consistent with models of reward network development during adolescence, and thus has important implications regarding the neural basis of maturational changes associated with decision making. While future work using longitudinal designs will be important to further probe development of this tract, the cross‐sectional design used here allowed the use of a large age range spanning childhood to late adulthood.
The newly characterized tract assessed using DTI is highly consistent with findings from histological studies. Importantly, human histology has revealed three separate frontostriatal projections, with the accumbofrontal tract representing a unique bundle specifically connecting to the more medial aspects of the OFC [Rigoard, et al., 2011]. Accordingly, although the terminal tractography ROI in the frontal lobe included the entire orbitofrontal region, the resulting connection was limited to the medial region of the white matter. Likewise, the tractography analysis showed the tract to be separate from other adjacent tracts and from those defined in the JHU white matter atlas [Oishi, et al., 2011], in particular from the anterior thalamic radiation (ATR) and uncinate fasciculus (UF). We also compared the tract to ROIs created in analyses from previous tractography studies [Peters, et al., 2014; Peters, et al., 2012], both of which used a sample that heavily overlapped with this one, with 196 of the same subjects. The accumbofrontal tract is more medial than either the ATR or UF as well as being superior to the UF. In the more rostral regions of the tract, the ATR and accumbofrontal tract appear to run alongside each other, with the accumbofrontal tract more medial (Fig. 3).
There have been a few studies that include white matter in an anatomical region likely to include some portion of this tract. Samanez‐Larkin and colleagues used a small sample (25 healthy subjects) age 21–85, and performed tractography in three fronto‐striatal tracts, including one originating in the NAcc. They demonstrated a linear decrease with age in this age range, and a positive relationship of FA to probabilistic reward learning [Samanez‐Larkin, et al., 2012]. However, while the pattern is indeed consistent with what is observed at the higher end of our age range, this sample is relatively small, does not include the full age range of our study, and only examined linear relationships. Other studies focused specifically on substance users have reported white matter deficits in regions that likely include this tract but their methods do not allow for the specific localization of the findings within the broader prefrontal white matter [Alicata, et al., 2009; Yeh, et al., 2009]. Finally, in an investigation focused on functional anatomical correlations, Bjornebekk and colleagues reported a correlation of a Reward Sensitivity index, as measured by the Cloningers Temperament and Character Inventory (TCI) [Cloninger, 1994] in frontal white matter that likely included the accumbofrontal tract [Bjornebekk, et al., 2012].
A few studies have previously investigated development of long range white matter tracts across the lifespan [Kochunov, et al., 2011; Kochunov, et al., 2010; Lebel, et al., 2012; Ostby, et al., 2009; Peters, et al., 2014], but none of these studies have included this tract or region. Peters et al used tractography in a sample aged 8–68 to assess eight tracts, finding the anterior thalamic radiation to have the earliest peak, and the SLF, cingulum, and uncinate to have the latest peaks [Peters, et al., 2014]. Westlye et al used tract based spatial statistics (TBSS) in a sample aged 8–85 to investigate patterns of maturation across the whole brain, and found early maturation of corticospinal regions, forceps minor, and occipital regions, and the latest maturation of the cingulum bundle and parahippocampal regions [Westlye, et al., 2010]. Lebel et al. investigated individuals aged 5–83, using DTI tractography in 12 tracts, and found the earliest peaks in the fornix and callosal regions, with the latest peak in the cingulum bundle [Lebel, et al., 2012].
The finding that the accumbofrontal tract shows a significantly different age related change across the lifespan compared to the SLF has important implications for models of decision making development. Such models have hypothesized that a discrepancy in the relative maturation of these tracts during adolescence may play a role in the increased risk taking observed during this age range [Blakemore and Robbins, 2012; Casey and Jones, 2010; Ernst, et al., 2006]. Although this hypothesis has not yet been tested empirically for this tract, there are data available from other imaging modalities that support this possibility. For instance, Galvan et al. noted different functional MRI activation patterns with age in frontal and striatal regions, with the NAcc showing a peak in adolescents (age 13–17) relative to children and adults, while the orbital frontal cortex in adolescents was more similar to that in children than adults [Galvan, et al., 2006]. Although the precise relationship of cortical activation to structural integrity of the adjacent white matter is unknown, the corresponding peaks may indicate that these two modalities are related. In addition, there is evidence for structural differences in striatal regions between adolescence and adulthood. For instance, it was found that there is higher nucleus accumbens volumes in adolescents than in adults [Urosevic, et al., 2012]. In addition, NAcc volume also peaks during later adolescence (age 13‐17) compared to childhood and adult volumes [Urosevic, et al., 2012] supporting the notion that adolescence may be associated with not just functional but structural differences in reward circuitry. Furthermore, the sex difference observed in our study is consistent with findings that there are higher levels of risk taking during this age in males than in females [Steinberg, 2008] and provides a potential biological and structural explanation for this difference. Taken together, these findings indicate that individual differences in white matter microstructure should be explored in relationship to decision making and risk taking during this developmental period.
In conclusion, we demonstrate that the anatomical connection between the ventral striatum and orbitofrontal cortex can be identified in‐vivo using DTI tractography, and is consistent with studies using tracing techniques in non‐human primates, including histology in human specimens. This tract is not yet incorporated into standard white matter atlases, but may be important for inclusion in studies investigating fronto‐striatal networks, as well as investigations of substance abuse and decision making. Moreover, this region shows a distinct pattern of maturation across the lifespan that differs from the trajectories of other tracts such as the SLF within the executive network. The developmental distinction between the SLF and accumbofrontal tract is remarkably consistent with models of development of adolescent decision making, and thus suggests that developmental differences in white matter connections may be a contributing factor to the observed risk taking that occurs in adolescence.
ACKNOWLEDGMENTS
We would like to acknowledge the contributions of Jamie Wagner; Patricia Gruner, Ph.D.; Angelica Bato; Peter Kingsley, Ph.D.; Kevin Nivole; Olivier Monlezun, Pharm.D., M.S.; Manuel Roulaud, M.Sc.; Bertille Lorgeoux.
REFERENCES
- Akaike H (1974): A new look at the statistical model identification. IEEE Trans Automat Contr 19:716–723. [Google Scholar]
- Alexander C, Kim Y, Ensminger M, Johnson K, Smith B, Dolan L (1990): A measure of risk taking for young adolescents: Reliability and validity assessments. J Youth Adolesc 19:559–569. [DOI] [PubMed] [Google Scholar]
- Alicata D, Chang L, Cloak C, Abe K, Ernst T (2009): Higher diffusion in striatum and lower fractional anisotropy in white matter of methamphetamine users. Psychiatry Res 174:1–8. [DOI] [PMC free article] [PubMed] [Google Scholar]
- Behrens TE, Woolrich MW, Jenkinson M, Johansen‐Berg H, Nunes RG, Clare S, Matthews PM, Brady JM, Smith SM (2003): Characterization and propagation of uncertainty in diffusion‐weighted MR imaging. Magn Reson Med 50:1077–1088. [DOI] [PubMed] [Google Scholar]
- Bjornebekk A, Westlye LT, Fjell AM, Grydeland H, Walhovd KB (2012): Social reward dependence and brain white matter microstructure. Cerebral Cortex 22:2672–2679. [DOI] [PMC free article] [PubMed] [Google Scholar]
- Blakemore SJ, Robbins TW (2012): Decision‐making in the adolescent brain. Nat Neurosci 15:1184–1191. [DOI] [PubMed] [Google Scholar]
- Brog JS, Salyapongse A, Deutch AY, Zahm DS (1993): The patterns of afferent innervation of the core and shell in the “accumbens” part of the rat ventral striatum: immunohistochemical detection of retrogradely transported fluoro‐gold. J Comp Neurol 338:255–278. [DOI] [PubMed] [Google Scholar]
- Casey BJ, Getz S, Galvan A (2008): The adolescent brain. Dev Rev 28:62–77. [DOI] [PMC free article] [PubMed] [Google Scholar]
- Casey BJ, Jones RM (2010): Neurobiology of the adolescent brain and behavior: implications for substance use disorders. J Am Acad Child Adolesc Psychiatry 49:1189–1201. quiz 1285. [DOI] [PMC free article] [PubMed] [Google Scholar]
- Cloninger CR (1994): Temperament and personality. Curr Opin Neurobiol 4:266–273. [DOI] [PubMed] [Google Scholar]
- Crone EA, Dahl RE (2012): Understanding adolescence as a period of social‐affective engagement and goal flexibility. Nat Rev Neurosci 13:636–650. [DOI] [PubMed] [Google Scholar]
- Ernst M, Pine DS, Hardin M (2006): Triadic model of the neurobiology of motivated behavior in adolescence. Psychol Med 36:299–312. [DOI] [PMC free article] [PubMed] [Google Scholar]
- First MB, Spitzer R, Gibbon M, Williams J (1997): Structured Clinical Interview for DSM‐IV Axis I Disorders. New York: Biometrics Research Department, New York State Psychiatric Institute. [Google Scholar]
- Galvan A, Hare TA, Davidson M, Spicer J, Glover G, Casey BJ (2005): The role of ventral frontostriatal circuitry in reward‐based learning in humans. J Neurosci 25:8650–8656. [DOI] [PMC free article] [PubMed] [Google Scholar]
- Galvan A, Hare TA, Parra CE, Penn J, Voss H, Glover G, Casey BJ (2006): Earlier development of the accumbens relative to orbitofrontal cortex might underlie risk‐taking behavior in adolescents. J Neurosci 26:6885–6892. [DOI] [PMC free article] [PubMed] [Google Scholar]
- Haber SN, Kunishio K, Mizobuchi M, Lynd‐Balta E (1995): The orbital and medial prefrontal circuit through the primate basal ganglia. J Neurosci 15:4851–4867. [DOI] [PMC free article] [PubMed] [Google Scholar]
- Jenkinson M, Smith S (2001): A global optimisation method for robust affine registration of brain images. Med Image Anal 5:143–156. [DOI] [PubMed] [Google Scholar]
- Karlsgodt K, van Erp TG, Poldrack R, Bearden CE, Nuechterlein KH, Cannon TD (2008): Diffusion tensor imaging of the superior longitudinal fasciculus and working memory in recent‐onset schizophrenia. Biol Psychiatry 63:512–518. [DOI] [PubMed] [Google Scholar]
- Karlsgodt KH, Kochunov P, Winkler AM, Laird AR, Almasy L, Duggirala R, Olvera RL, Fox PT, Blangero J, Glahn DC (2010): A multimodal assessment of the genetic control over working memory. J Neurosci 30:8197–8202. [DOI] [PMC free article] [PubMed] [Google Scholar]
- Knutson B, Fong GW, Bennett SM, Adams CM, Hommer D (2003): A region of mesial prefrontal cortex tracks monetarily rewarding outcomes: characterization with rapid event‐related fMRI. NeuroImage 18:263–272. [DOI] [PubMed] [Google Scholar]
- Kochunov P, Glahn DC, Lancaster J, Thompson PM, Kochunov V, Rogers B, Fox P, Blangero J, Williamson DE (2011): Fractional anisotropy of cerebral white matter and thickness of cortical gray matter across the lifespan. NeuroImage 58:41–49. [DOI] [PMC free article] [PubMed] [Google Scholar]
- Kochunov P, Williamson DE, Lancaster J, Fox P, Cornell J, Blangero J, Glahn DC (2010): Fractional anisotropy of water diffusion in cerebral white matter across the lifespan. Neurobiol Aging 33:9–20. [DOI] [PMC free article] [PubMed] [Google Scholar]
- Koob GF (2000): Neurobiology of addiction. Toward the development of new therapies. Ann N Y Acad Sci 909:170–185. [DOI] [PubMed] [Google Scholar]
- Lebel C, Gee M, Camicioli R, Wieler M, Martin W, Beaulieu C (2012): Diffusion tensor imaging of white matter tract evolution over the lifespan. NeuroImage 60:340–352. [DOI] [PubMed] [Google Scholar]
- Li W, Zhang Q, Oiso N, Novak EK, Gautam R, O'Brien EP, Tinsley CL, Blake DJ, Spritz RA, Copeland NG, Jenkins NA, Amato D, Roe BA, Starcevic M, Dell'Angelica EC, Elliott RW, Mishra V, Kingsmore SF, Paylor RE, Swank RT (2003): Hermansky‐Pudlak syndrome type 7 (HPS‐7) results from mutant dysbindin, a member of the biogenesis of lysosome‐related organelles complex 1 (BLOC‐1). Nat Genetics 35:84–89. [DOI] [PMC free article] [PubMed] [Google Scholar]
- Luna B, Padmanabhan A, O'Hearn K (2010): What has fMRI told us about the development of cognitive control through adolescence? Brain Cogn 72:101–113. [DOI] [PMC free article] [PubMed] [Google Scholar]
- O'Doherty JP (2004): Reward representations and reward‐related learning in the human brain: insights from neuroimaging. Curr Opin Neurobiol 14:769–776. [DOI] [PubMed] [Google Scholar]
- Oishi K, Faria A, van Zijl P, Mori S (2011): MRI Atlas of Human White Matter. New York: Elseview. [Google Scholar]
- Oldfield RC (1971): The assessment and analysis of handedness: The Edinburgh inventory. Neuropsychologia 9:97–113. [DOI] [PubMed] [Google Scholar]
- Ostby Y, Tamnes CK, Fjell AM, Westlye LT, Due‐ T, √∏ nnessen P, Walhovd KB (2009): Heterogeneity in subcortical brain development: A structural magnetic resonance imaging study of brain maturation from 8 to 30 years. J Neurosci 29:11772–11782. [DOI] [PMC free article] [PubMed] [Google Scholar]
- Peters BD, Ikuta T, DeRosse P, John M, Burdick KE, Gruner P, Prendergast DM, Szeszko PR, Malhotra AK (2014): Age‐related differences in white matter tract microstructure are associated with cognitive performance from childhood to adulthood. Biol Psychiatry 75:248–256. [DOI] [PMC free article] [PubMed] [Google Scholar]
- Peters BD, Szeszko PR, Radua J, Ikuta T, Gruner P, DeRosse P, Zhang JP, Giorgio A, Qiu D, Tapert SF, Brauer J, Asato MR, Khong PL, James AC, Gallego JA, Malhotra AK (2012): White matter development in adolescence: diffusion tensor imaging and meta‐analytic results. Schizophrenia Bull 38:1308–1317. [DOI] [PMC free article] [PubMed] [Google Scholar]
- Pontieri FE, Tanda G, Di Chiara G (1995): Intravenous cocaine, morphine, and amphetamine preferentially increase extracellular dopamine in the “shell” as compared with the “core” of the rat nucleus accumbens. Proc Natl Acad Sci USA 92:12304–12308. [DOI] [PMC free article] [PubMed] [Google Scholar]
- Rigoard P, Buffenoir K, Jaafari N, Giot JP, Houeto JL, Mertens P, Velut S, Bataille B (2011): The accumbofrontal fasciculus in the human brain: a microsurgical anatomical study. Neurosurgery 68:1102–1111. discussion 1111. [DOI] [PubMed] [Google Scholar]
- Rolls ET, Grabenhorst F (2008): The orbitofrontal cortex and beyond: from affect to decision‐making. Prog Neurobiol 86:216–244. [DOI] [PubMed] [Google Scholar]
- Saddoris MP, Sugam JA, Cacciapaglia F, Carelli RM (2013): Rapid dopamine dynamics in the accumbens core and shell: learning and action. Front Biosci 5:273–288. [DOI] [PMC free article] [PubMed] [Google Scholar]
- Saddoris, MP , Sugam, JA , Stuber, GD , Witten, IB , Deisseroth, K , Carelli, RM (2014): Mesolimbic dopamine dynamically tracks, and is causally linked to, discrete aspects of value‐based decision making. Biol Psychiatry 77:903–11. [DOI] [PMC free article] [PubMed] [Google Scholar]
- Samanez‐Larkin GR, Levens SM, Perry LM, Dougherty RF, Knutson B (2012): Frontostriatal white matter integrity mediates adult age differences in probabilistic reward learning. J Neurosci 32:5333–5337. [DOI] [PMC free article] [PubMed] [Google Scholar]
- Song SK, Sun SW, Ju WK, Lin SJ, Cross AH, Neufeld AH (2003): Diffusion tensor imaging detects and differentiates axon and myelin degeneration in mouse optic nerve after retinal ischemia. NeuroImage 20:1714–1722. [DOI] [PubMed] [Google Scholar]
- Song SK, Sun SW, Ramsbottom MJ, Chang C, Russell J, Cross AH (2002): Dysmyelination revealed through MRI as increased radial (but unchanged axial) diffusion of water. NeuroImage 17:1429–1436. [DOI] [PubMed] [Google Scholar]
- Steinberg L (2008): A Social Neuroscience Perspective on Adolescent Risk‐Taking. Dev Rev 28:78–106. [DOI] [PMC free article] [PubMed] [Google Scholar]
- Urosevic S, Collins P, Muetzel R, Lim K, Luciana M (2012): Longitudinal changes in behavioral approach system sensitivity and brain structures involved in reward processing during adolescence. Dev Psychol 48:1488–1500. [DOI] [PMC free article] [PubMed] [Google Scholar]
- Volkow ND, Wang GJ, Fowler JS, Tomasi D (2012): Addiction circuitry in the human brain. Annu Rev Pharmacol Toxicol 52:321–336. [DOI] [PMC free article] [PubMed] [Google Scholar]
- Westlye LT, Walhovd KB, Dale AM, Bj√∏rnerud A, Due‐ T, √∏nnessen P, Engvig A, Grydeland H, Tamnes CK, √òstby Y Fjell AM (2010): Life‐span changes of the human brain white matter: Diffusion tensor imaging (DTI) and volumetry. Cerebral Cortex 20:2055–2068. [DOI] [PubMed] [Google Scholar]
- Wilkinson, G. (1993) The Wide Range Achievement Test (WRAT‐3): Administration Manual. Wilmington, DE: Wide Range. [Google Scholar]
- Wozniak JR, Lim KO (2006): Advances in white matter imaging: a review of in vivo magnetic resonance methodologies and their applicability to the study of development and aging. Neurosci Biobehav Rev 30:762–774. [DOI] [PMC free article] [PubMed] [Google Scholar]
- Yeh PH, Simpson K, Durazzo TC, Gazdzinski S, Meyerhoff DJ (2009): Tract‐Based Spatial Statistics (TBSS) of diffusion tensor imaging data in alcohol dependence: abnormalities of the motivational neurocircuitry. Psychiatry Res 173:22–30. [DOI] [PMC free article] [PubMed] [Google Scholar]


