Abstract
Changes in the flagellar waveform in response to increased viscosity were investigated in uniflagellate mutants of Chlamydomonas reinhardtii. We hypothesized that the waveforms of mutants lacking different dynein arms would change in different ways as viscosity was increased, and that these variations would illuminate the feedback pathways from force to dynein activity. Previous studies have investigated the effects of viscosity on cell body motion, propulsive force, and power in different mutants, but the effect on waveform has not yet been fully characterized. Beat frequency decreases with viscosity in wild-type uniflagellate (uni1) cells, and outer dynein arm deficient (oda2) mutants. In contrast, the inner dynein arm mutant ida1 (lacking I1/f) maintains beat frequency at high viscosity but alters its flagellar waveform more than either wild-type or oda2. The ida1 waveform is narrower than wild-type, primarily due to an abbreviated recovery stroke; this difference is amplified at high viscosity. The oda2 mutant in contrast, maintains a consistent waveform at high and low viscosity with a slightly longer power stroke than wild-type. Analysis of the delays and shear displacements between bends suggest that direct force feedback in the outer dynein arm system may initiate switching of dynein activity. In contrast, I1/f dynein appears to delay switching, most markedly at the initiation of the power stroke, possibly by controlling inter-doublet separation.
Introduction
Cilia and flagella are slender, motile organelles used by cells for locomotion or to move fluid (Bray, 2001). The coordinated movements of cilia and flagella are crucial to proper function of many biological systems; defects in these organelles can lead to congenital laterality defects, chronic respiratory disease, and infertility (Afzelius, 2004; Christensen et al., 2007; Marshall, 2008). The active flagellar cytoskeleton is called the axoneme, which is an array of nine outer microtubule doublets distributed around a ‘central pair’ of microtubules. Axonemal bends are generated by the minus-end directed motor protein dynein, which converts chemical energy from ATP to microtubule sliding (Summers and Gibbons, 1971). While the main structures of the axoneme have been identified by electron microscopy (Bui et al., 2012; Nicastro et al., 2006), the mechanisms that regulate dynein have yet to be fully characterized. This study focuses on understanding the response of the flagellum to differences in mechanical loading.
Dynein motors are arranged in repeating groups along the length of the flagellum. Outer dynein arms contain α, β, and γ heavy chains that are permanently attached to the A tubule and form transient bridges to the B tubule of the adjacent doublet to generate force. The inner dynein arms (IDAs) consist of at least seven dynein heavy chains including one double-headed dynein, I1/f (Nicastro et al., 2006; Piperno et al., 1990; Wirschell et al., 2007). In standard media, loss of outer dynein arms has been shown to reduce beat frequency (Bayly et al., 2011; Brokaw and Kamiya, 1987; Pazour et al., 2006; Storm van's Gravesande and Omran, 2005) while loss of inner dynein arm I1/f has been shown to more noticeably affect the flagellar waveform (Bayly et al., 2010; Brokaw and Kamiya, 1987; Brokaw, 1994; King and Dutcher, 1997; Okita et al., 2005). We hypothesized that differences in waveform would be accentuated and the contributions of specific dynein motors would be clarified at high viscosity.
The single-celled alga Chlamydomonas reinhardtii is an excellent model system for the study of ciliary and flagellar mechanics; the Chlamydomonas axoneme contains the common 9+2 microtubule structure as well as dynein arms homologous to those of human cilia. Chlamydomonas has been used as a model organism in genetics research for many years, and has a fully-sequenced genome (Merchant et al., 2007). Many genes have been identified that encode specific dynein arms or other axonemal proteins, allowing straightforward analysis of mutants for experimental study (Kamiya, 1988; Merchant et al., 2007). The Chlamydomonas beat is also approximately two-dimensional (2D) (Ringo, 1967), allowing visualization of the entire flagellum within the focal plane of a standard optical microscope(Bayly et al., 2011, 2010).
In this study, mechanical loading was varied by increasing the viscosity of media surrounding uniflagellate Chlamydomonas cells. This allowed us to investigate the effect of mechanical feedback on the coordination of dyneins, using detailed analysis of the flagellar waveform to gain insight into motor activity. Waveform analysis was pioneered by Brokaw and his collaborators (Brokaw and Kamiya, 1987)(Brokaw and Luck, 1985, 1983), who analyzed strobed dark-field images of flagella, and showed that differences in dynein activity may be characterized by quantitative changes in waveform parameters. A number of prior investigators have studied the effects of viscosity on flagella motion. Rikmenspoel (Rikmenspoel, 1971) and Woolley and Vernon (Woolley and Vernon, 2002) varied viscosity to study flagella mechanics in sperm cells. Kamiya and co-authors (Minoura and Kamiya, 1995; Yagi et al., 2005) reported on effects of viscosity on the frequency, force and power of Chlamydomonas mutants lacking specific dynein arms. However changes to the waveform were not described in detail.
In the current study, analysis of video microscopy images is used to quantitatively and precisely describe changes in the flagellar waveform in different dynein deficient mutants as viscosity is varied. The waveform analysis technique has been described previously (Bayly et al., 2011, 2010). Curvature values and shear rates reflect local dynein forces. Time delays and shear displacements between bends characterize switching between recovery and power strokes. The results below show that increased viscosity affects not only force and power, as previously observed, but also switching of dynein activity. Different effects of viscosity on flagella lacking outer dynein arms or the inner dynein arm I1/f, illuminate the distinct roles for these motors in determining the flagellar waveform.
Materials and Methods
Cell cultures and genetics
Uniflagellate Chlamydomonas reinhardtii cells were used in order to allow high-speed video recording, since these cells rotate in place instead of swimming quickly through the field of view (Huang et al., 1982). Uniflagellate cells (uni1 “wild-type”, wt CC-2507) were obtained from the Chlamydomonas Resource Center (University of Minnesota, St. Paul, MN). Dynein-arm deficient double mutants uni1; ida1 (ida1; CC-1254), and uni1; oda2 (oda2; CC-2230) were generated by meiotic crosses (Dutcher, 1995) of uniflagellate cells with dynein-deficient mutants (also obtained from the Chlamydomonas Resource Center) as shown in Table 1. Double mutants were selected by phenotype. Cells were cultured prior to recording for 48 h under constant illumination in Sager and Granick liquid medium supplemented with sodium acetate (Holmes and Dutcher, 1989; Sager and Granick, 1953) at 25C.
Table 1.
Mutants studied
| Gene | Protein Encoded | Structural Phenotype | Observed Phenotype | References |
|---|---|---|---|---|
| ida1 | 1α HC (DHC1) | Lacks inner arm I1 (f) | Slow swimming | (DiBella and King, 2001; Kagami and Kamiya, 1992; Kamiya et al., 1991; King and Dutcher, 1997) |
| oda2 | γ HC (DHC15) | Lacks outer arms | Very slow swimming | (Brokaw and Kamiya, 1987; DiBella and King, 2001; Kamiya, 1988) |
Video Microscopy
Cells were recorded using bright field microscopy on a Zeiss Universal Microscope (Carl Zeiss, Oberkochen, Germany) using a 40×, 1.0 NA Planapo oil-immersion objective. For each video, 20μL liquid culture was pipetted onto an acid washed slide, covered by an 18×18mm coverslip. For recording, a periodically rotating cell was centered in the field of view and microscope settings were adjusted to provide maximum contrast between the flagellum and background. Videos were recorded at 350 frames per second (fps) at 320×240 pixel resolution (0.21 μm/pixel) using a Dragonfly Express IEEE-1394b Digital Camera System and FlyCapture software (Point Grey Research, Scottsdale, AZ). Each video was approximately 1 second in length (~350 frames), recorded in AVI format. For increased viscosity trials, an appropriate volume of 40% w/v Ficoll 400 solution (Sigma Aldrich, St. Louis, MO) was pipetted onto a reduced liquid culture volume, such that the total mixed volume was 20 μL. The Ficoll solution was prepared by pipetting slowly with the liquid culture to allow complete mixing. Viscosity of the mixed solution was verified in separate trials by an AR-G2 Rheometer (TA Instruments, New Castle, DE).
Image Processing
Videos were analyzed in Matlab™ (The Mathworks, Natick, MA) using custom algorithms (Bayly et al., 2011, 2010). For each video; at least 200 consecutive frames were selected from a section of video with good flagellar contrast. Rotation rate and flagellar beat frequency were calculated as described previously (Bayly et al., 2010; Brokaw and Luck, 1983)(Bayly et al., 2011). Briefly, images were automatically rotated and registered to maintain consistent position and orientation of the cell body; the time history of image rotations was used to determine the flagellar beat frequency and cell body angular rotation rate (Bayly et al., 2011). Images in the video (z-stack) were then subtracted from a baseline image to remove artifacts. Image stacks were exported to ImageJ (Rasband, n.d.), the flagellum was manually traced with a stylus in each frame to enhance contrast, then image stacks were exported to and further analyzed in Matlab. As previously described (Bayly et al., 2010) the darkest 100 pixels in each traced image were identified and their Cartesian coordinates used to specify a “point cloud.” Spurious points were manually deleted, and point clouds were sorted using IsoMap (Bayly et al., 2010; Tenenbaum et al., 2000) to enable generation of a single, high-resolution, characteristic waveform.
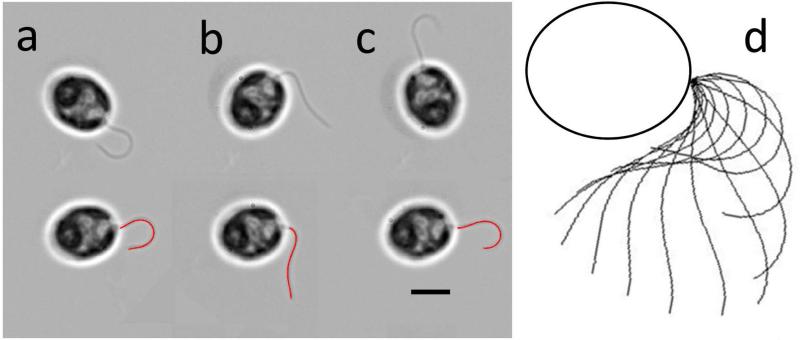
A fourth-order polynomial representing tangent angle (θ) as a function of distance from the base (s) was fitted to each point cloud (Bayly et al., 2010), so that five parameters (the coefficients of the polynomial) describe the waveform in each frame. Thus, the waveform shape is described concisely and quantitatively by angle as a smooth function of space and time. The Cartesian coordinates of any point on the flagellum can be regenerated from this description. For example, plotting the waveform in a cell body-fixed Cartesian coordinate system at intervals of 1/12th of the period gives a visual overview of its character (Figure 1d).
Figure 1.
Waveform analysis (Bayly et al., 2010). (a-c) Video frames of uniflagellate Chlamydomonas cells (top); rotated into consistent position with polynomial curves fitted to flagellum (bottom). (d) Waveform from polynomial fits displayed every 1/12th period. Scale bar: 5 μm.
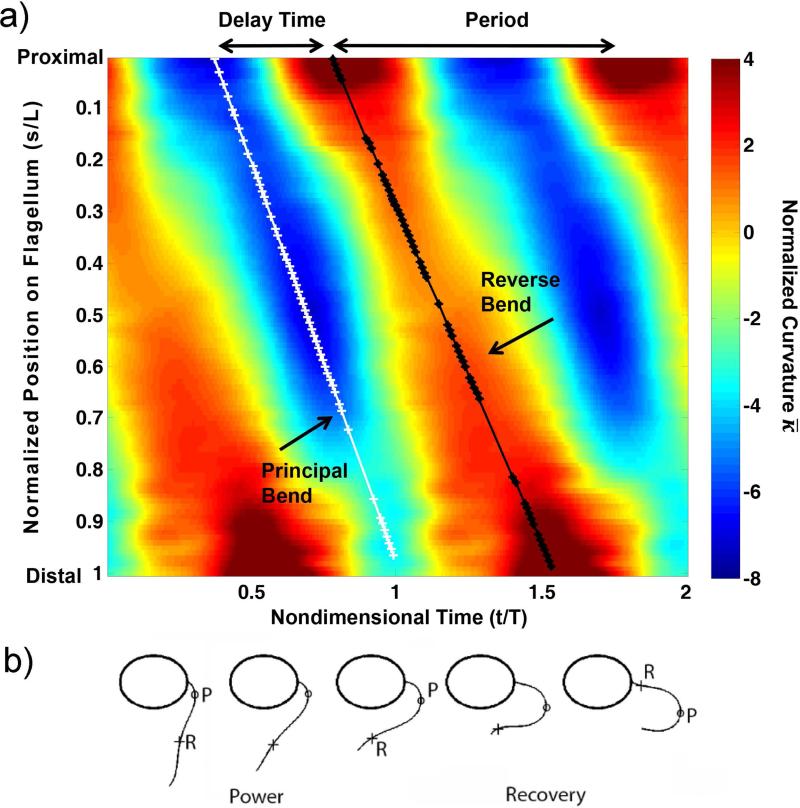
From this mathematical description of the flagellar waveform in space and time, parameters such as bend curvature, shear rates, delay time and shear angle between bends, and total stroke width were calculated and compared between mutants and viscosities. To identify dimensionless factors that determine waveform shape, parameters may be normalized by flagella length or beat frequency. A representative map of normalized curvature (radians/flagellar length) is shown as a function of normalized position and time in Figure 2a, with definitions of two bend superimposed. A schematic diagram of the flagellar waveform, showing principal (P) and reverse (R) bends, is shown in Figure 2b. The progression of both bends shows proximal-to-distal propagation with roughly constant speeds (Figure 2a). By fitting lines to the locations of local minimum and maximum curvature values, bend propagation speeds can be estimated, as well as the delay times and displacements between bends. Using this well-resolved, quantitative description of the waveform, differences between flagellar waveforms of different mutants can be characterized precisely.
Figure 2.
(a) Map of normalized curvature, (rad/flagellar length) vs. time (horizontal axis; normalized by beat period) and distance (vertical axis; normalized by flagellar length). The map is oriented so that flagellum base is at the top left of figure. Two beat periods are shown. Delay time, , is defined as the fraction of the beat cycle between the occurrence of minimum negative curvature at the base of the flagellum (principal, or P-bend initiation) and the occurrence of maximum positive curvature at the base (reverse, or R-bend initiation). (b) A typical waveform at selected times in the beat, showing P-bend (minimum negative curvature, marked with ‘o’) and R-bend (maximum positive curvature, marked with ‘+’).
Results
For each mutant, 10 cells were analyzed at each value of viscosity. Beat frequency, beats per revolution, average force, and power were estimated from cell body motion (Bayly et al., 2010). Analysis of the flagellar waveform complements and augments the analysis of cell body motion to illuminate more clearly the local effects of dynein activity.
Global Beat Parameters Calculated from Cell Body Rotation
Beat frequency
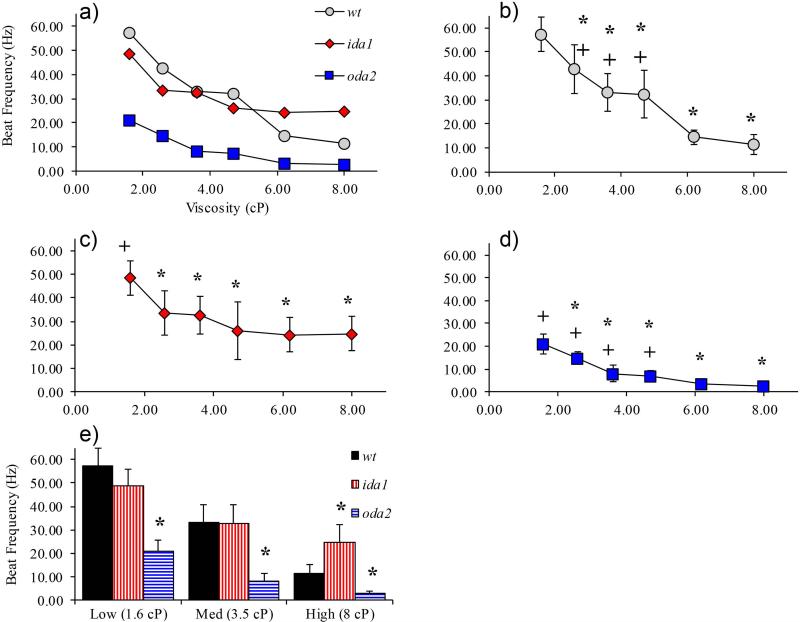
Beat frequency decreased with increasing media viscosity for all cells, although to different degrees. Cells missing outer arms (oda2) consistently exhibited the lowest beat frequency (Figure 3), as noted in prior work (Minoura and Kamiya, 1995). Surprisingly, cells lacking the I1 inner dynein arm (ida1) were able to maintain the highest beat frequency at high viscosities (Figure 3); ida1 cells maintained a beat frequency of over 20 beats per second (20 Hz) in media up to 8 cP.
Figure 3.
(a) Average beat frequency vs viscosity for all cells tested (error bars omitted for clarity). Beat frequency significantly decreased with viscosity for each cell type (single factor ANOVA, p<0.01). (b-d) Beat frequency vs viscosity for individual mutants; * indicates significant difference from beat frequency at 1.6 cP (baseline), (p<0.01 by two-tailed student t-test); + indicates significant difference from beat frequency at 8 cP (p<0.01 by two-tailed student t-test). (e) Data from preceding line plots are presented in bar graphs here and in subsequent figures to highlight differences between mutants. Compared to wild-type, oda2 cells beat significantly slower than wt cells at all viscosities; ida1 cells beat faster than wt at 8cP. Here and in subsequent bar graphs * denotes significance by ANOVA followed by two-tailed student t-test p<0.01, compared to wt. In this figure and subsequent figures, solid markers or wide bars represent mean values and error bars show standard deviations.
Cell body rotation rate
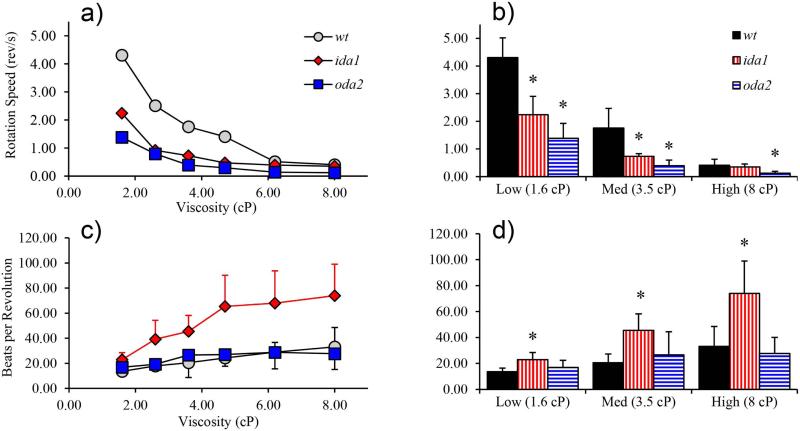
The rate of rotation of the cell body also decreased with increasing viscosity in all mutants (Figure 4a) though not in direct proportion to beat frequency. The ratio of flagellar beats per cell revolution uncovered key differences between mutants. Most notably, ida1 cells showed a dramatic increase in beats per revolution both with viscosity (from 1.6 cP to 8 cP) and when compared to wt cells at 1.6 cP, 3.5 cP, and 8 cP (p<0.01). In wt cells, beats per revolution also increased with increasing viscosity (ANOVA, p<0.01), although less dramatically than in ida1. In oda2 cells, the slight increase in beats per revolution with viscosity was not significant.
Figure 4.
(a) Rotation rates decreased with viscosity in all mutants. (b) Compared to wt, cell body rotation is slower in oda2 at all viscosities and in ida1 at low and medium viscosity. (c) ida1 flagella exhibit a dramatic increase in beats per revolution with viscosity. The number of beats per revolution in wt and oda2 flagella also tend to increase with viscosity but much less than in ida1 (in wt the increase is statistically significant, ANOVA, p<0.01). (d) The number of beats per revolution in ida1 was significantly higher than in wt at all viscosities.
Force and Power
Using angular rotation of the cell body and measurements of the minor and major axes of the cell, we calculated the torque on each cell as described (Bayly et al., 2011). Briefly, the average torque required to rotate the ellipsoidal cell through a viscous fluid is proportional to viscosity of the fluid μ and rotation rate ω, along with ellipsoid semi-axes a, b, and shape parameters Cf3 (a non-dimensional parameter in the range 1<Cf3<1.4 derived from the eccentricity of the cell body) (Bayly et al., 2011):
| (1) |
To facilitate comparision with prior studies that provide results in terms of propulsive force (Minoura and Kamiya, 1995; Yagi et al., 2005), the average torque was converted to an average ‘effective propulsive force’ by dividing the net torque by the major semi-axis dimension, a (Bayly et al., 2011):
| (2) |
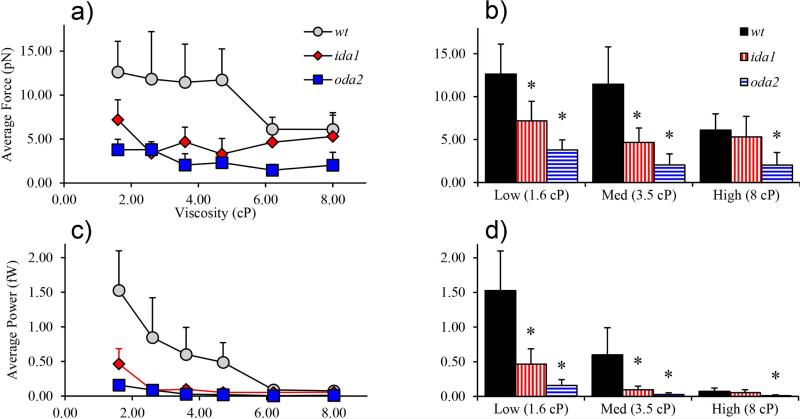
The effective propulsive force generated by each mutant at each viscosity is shown in Figure 5. Similarly, power generated by the flagellum was estimated by multiplying the torque on the cell body by its angular rotation rate: P = Mμω (Figure 5). All cells showed a significant decrease in power with viscosity. In general, complete (wt) axonemes are able to produce the most force and power. Individual beats of ida1 and oda2 flagella do less work than those of wild-type flagella. However, at high viscosity ida1 cells are able to produce average forces similar to those of wt cells, largely because ida1 cells beat at higher frequencies. It is noteworthy that at normal (low) viscosity values, mutants lacking only I1/f dynein (two heavy chains per the 96-nm repeat length of the outer doublet microtubule) exhibit force and power deficits comparable to mutants lacking outer dynein arms (twelve heavy chains per the 96nm repeat length).
Figure 5.
(a-b) Average propulsive force calculated from Equations (1-2). (a) Average propulsive force varied significantly with viscosity in wt, ida1, and oda2 (ANOVA, p<0.01). (b) Compared to wt, ida1 and oda2 cells produced less force at low and medium viscosity. At high viscosity wt and ida1 generated similar average forces. (c-d) Average power vs. viscosity. (c) Decrease in power with viscosity was significant for all mutants (ANOVA, p<0.01). (d) Wild-type (wt) cells generate more power than dynein-deficient mutants. The values of propulsive force and power in this figure are close to corresponding previous estimates in biflagellate cells (Minoura and Kamiya, 1995; Yagi et al., 2005).
Waveform Characteristics: Amplitude, Curvature, Shear Rates, and Switching
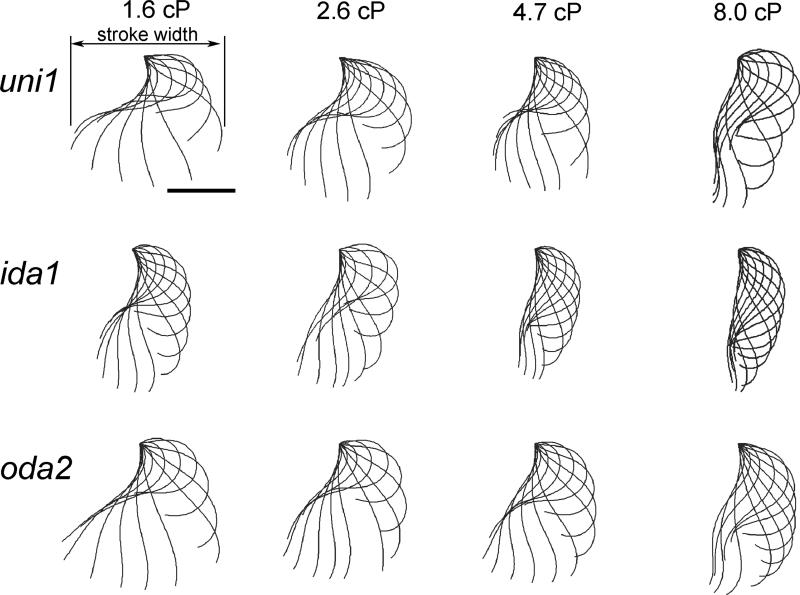
Flagellar waveforms of representative cells from selected experimental conditions are shown in Figure 6. Each sub-figure displays the waveform at intervals of 1/12th period. In general, the waveform appears to change in response to increased media viscosity, most noticeably by reduced amplitude; ida1 in particular displayed a narrower stroke at high viscosity. The flagellum seems to display higher curvature at higher viscosities, especially in distal portions. However, local differences in waveform are subtle and require careful characterization. The following sections describe statistical analysis of the quantitative differences between waveform parameters among different mutants at different viscosities.
Figure 6.
Representative waveforms for selected experimental conditions. Each column shows results at a specific viscosity; each row corresponds to a specific mutant. Flagellar waveforms are shown at intervals of 1/12th period; scale bar 5 μm.
Waveform amplitude
The overall waveform amplitude was examined by calculating the stroke width – the difference between the maximum and minimum x-coordinates of the aligned waveform over the entire cycle (see annotation on Figure 6). A decrease in stroke width with viscosity was significant in both wt and ida1 cells at viscosities over 3.5 cP (p<0.01; Figure 7). Also, ida1 cells had a significantly narrower stroke compared to wt cells at all viscosities (p<0.01).
Figure 7.
Flagellar stroke width (maximum difference in x-coordinates of any points on flagellum over the beat, normalized by length, L). (a) Both wt and ida1 showed significant decreases in stroke width with viscosity (ANOVA, p<0.01) (b) Differences in stroke width between wt and ida1 were identified at all viscosities and amplified at high viscosity.
Curvature
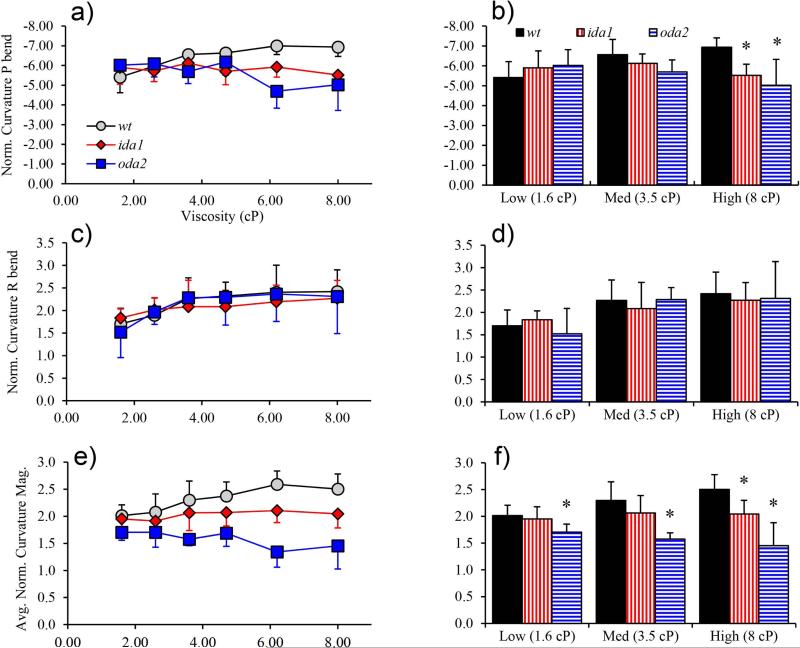
Flagellar curvature quantifies the local effects of active and viscous forces on the elastic deformation of the flagellum. Figure 8 shows the average curvature magnitudes in the principal (P) and reverse (R) bends, respectively. The P-bend (local minimum curvature) characterizes the recovery stroke, while the R-bend (local maximum curvature) characterizes the power stroke. The average P-bend curvature is computed as the mean, taken over the length of the flagellum, of the five minimal curvature values at each location (see Figure 2a). The average R-bend curvature is the corresponding average of the five maximum curvature values at each location.
Figure 8.
Normalized curvature values (radians/flagellum length). (a) Only wt flagella displayed a statistically significant, consistent increase in P-bend curvature with viscosity. P-bend curvature decreased in oda2 flagella at high viscosity (ANOVA, p<0.01). (b) P-bend curvature in ida1 and oda2 differ significantly from wt only at high viscosity. (c) Flagella exhibit a trend of increased R-bend curvature with viscosity, which is statistically significant in wt and oda2 (not ida1). (d) R-bend curvature was similar between mutants under almost all conditions. (e) Average curvature magnitude over the entire waveform. Flagella of wt flagella showed significant increase in average curvature magnitude with viscosity. In oda2 average curvature magnitude decreased with viscosity. (f) Average curvature magnitude in oda2 was significantly lower than in wt at all viscosities.
As shown in Figure 8, wt cells exhibited significant increases in both P-bend and R-bend curvature values with viscosity, while oda2 cells displayed a significant increase only in R-bend curvature (characterizing the power stroke) with viscosity. Among mutants, significant differences in bend curvature among wt, ida1, and oda2 mutants were found only in the P-bend at high viscosity
The average magnitude of curvature over the entire flagellum was also estimated to determine if consistently lower curvatures, not only in the P- or R-bends, might be responsible for differences in waveform. This statistic was computed simply by averaging the curvature magnitude at every point on the flagellum, over the entire beat (this is equivalent to taking the average magnitude of the curvature map in Figure 2a). It was hypothesized that if cells use more force to push the flagella through viscous fluid, with constant elastic parameters greater bending would occur and curvature would increase throughout the flagellum.
As shown in Figure 8e-f, in ida1 average curvature magnitude remained nearly constant with increasing viscosity, while in wt flagella the average curvature increased significantly. In oda2 flagella, the average curvature magnitude decreased with viscosity. Notably, oda2 cells had significantly reduced average curvature magnitude compared to wt at all viscosity levels (p<0.01) while ida1 were more similar to wt. Overall, curvature differences between ida1 and wt flagella are surprisingly small; particularly surprising is the observation that they are smaller than differences in curvature between oda2 and wt.
Shear rate
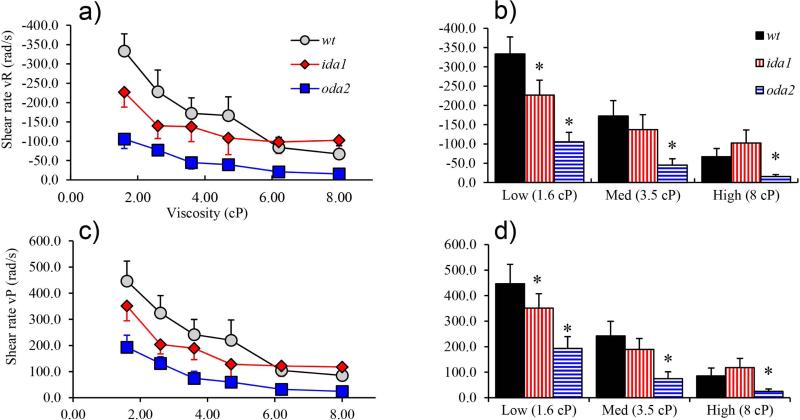
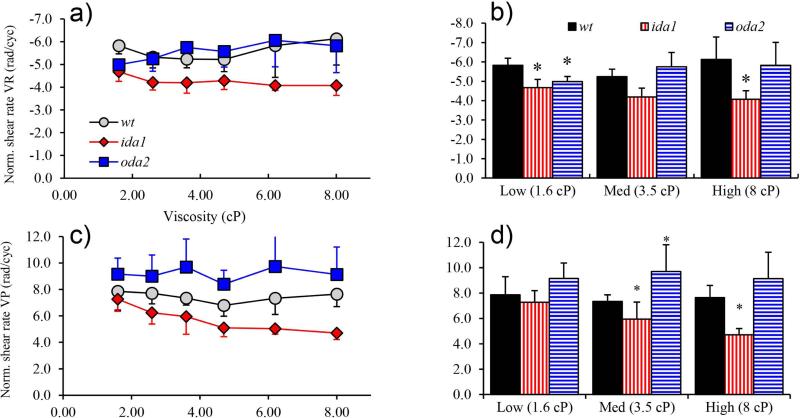
Dynein activity is also characterized by shear rate (units: rad/s), which describes the rate of relative displacement between doublets. Shear rate can be associated with propagation of the R-bend (vR, negative) or the P-bend (vP, positive) (Brokaw and Kamiya, 1987; Brokaw and Luck, 1983; Brokaw, 1984). In general, shear rate is lower in dynein deficient mutants, particularly in oda2, and in most cases decreases with increasing viscosity (Figure 9). Strikingly, at the highest viscosities shear rate in ida1 flagella levels off and maintains values similar or slightly higher than in wt. Overall, differences between shear rate between ida1 and wt are smaller than differences in oda2 and wt. Thus the diminished ida1 waveform amplitude at high viscosity cannot be primarily explained by decreased shear rate.
Figure 9.
(a, c) Shear rates (rad/s) associated with propagation of both R-bends (vR) and P-bends (vP) decrease with increased viscosity in all mutants but level off at high viscosities in ida1. (b, d) At low viscosity shear rates are lower in dynein-deficient mutants ida1 and oda2 than in wt (p<0.01), but at high viscosity shear rates in ida1 flagella are similar to or higher than wt.
Following Brokaw (Brokaw and Kamiya, 1987; Brokaw and Luck, 1983) the normalized shear rate was calculated from the ratio of the shear rate and the beat frequency (units: rad/cycle). When normalized by beat frequency, clear differences are observed between the ida1 mutant and other mutants. (Figure 10).
Figure 10.
(a) Normalized shear rate VR (rad/cycle) remains roughly constant as viscosity is increased except for a slight decrease in ida1 (ANOVA p=0.01). (b) Normalized shear rate VR is significantly lower in ida1 than wt (p<0.01) at both high and low viscosity. (c) Normalized shear rate VP is consistently lowest in ida1 at each viscosity, and the decrease in with viscosity in ida1 is significant (ANOVA, p<0.01). (d) Normalized shear rate VP differs between ida1 and wt at medium and high viscosity.
Time delay between P-bend and R-bend formation
Beat frequency is determined by the duration of the power and recovery strokes, and thus by the mechanism that governs switching between directions. Accordingly we measured the time delay, , between the minimum (P-bend) and maximum (R-bend) curvature at the base of the flagellum, normalized by the period of the beat (Figure 11). The value of represents the fraction of the cycle devoted to the recovery stroke, and its unit complement represents the fraction of the cycle used for the power stroke. Unexpectedly, both the ida1 and oda2 mutants exhibited shorter normalized delays than wt (Figure 12) signifying that a smaller fraction of the beat period was spent in the recovery stroke. This is apparently due to a short recovery stroke in ida1, but an extended power stroke in oda2.
Figure 11.
Normalized curvature maps (rad/L) showing the time dela, , between principal and reverse bends at the base. (a) ; (b) ; and (c) . Also shown are recovery completion (CR) and power stroke completion (CP) ratios which are estimated from the bend propagation speed and the corresponding time delay.
Figure 12.
Normalized delay times between P-bend and R-bend at the base of the flagellum correspond to the fraction of the beat devoted to the recovery stroke. (a) There was no significant trend in normalized delay time with viscosity in any mutant. (b) ida1 and oda2 cells exhibited smaller normalized delay times than wt (p<0.01 at low and medium viscosity).
Stroke completion
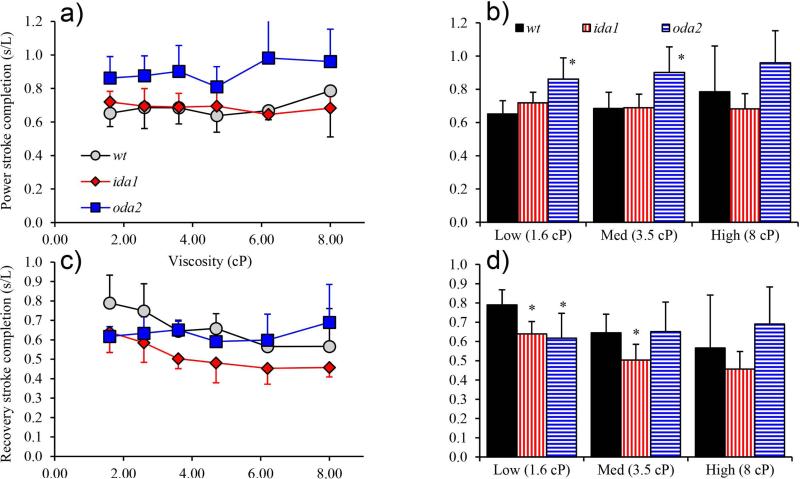
To distinguish differences in dynein switching behavior among mutants we defined the completion of a bend as the distance between the P-bend and the R-bend, at the time the opposite bend forms at the base of the flagellum. Power stroke completion describes the distance between (proximal) P-bend and the (distal) R-bend when the P-bend forms at the base (Figure 2b, Figure 11). Similarly, recovery stroke completion describes the distance between the (proximal) R-bend and the (distal) P-bend when the R-bend forms at the base. These values were estimated from the product of bend propagation speed and the corresponding time delay (Figure 11). It is plausible to have a completion ratio greater than one if the power stroke completes before the recovery phase begins, for example.
The most striking result is that ida1 cells have a significantly reduced recovery stroke completion relative to other mutants (Figure 13), and this decreases with viscosity. In contrast, oda2 cells have higher power stroke completion (Figure 13), and similar recovery stroke completion, compared to wt.
Figure 13.
Stroke completion is characterized by the distance between the P-bend and R-bend at the time the opposing bend begins. This value is estimated from the product of the bend propagation speed and the time delay before the opposite bend begins (Figure 11). (a) Power stroke completion increases with viscosity in oda2. (b) oda2 cells have a generally longer power stroke than wt. The difference is statistically significant at low and medium viscosity values. (c) Recovery stroke completion in wt and ida1 cells decreases with viscosity. (d) Recovery completion is significantly lower (p<0.01) in ida1 than in wt at low and medium viscosity.
Discussion
Chlamydomonas reinhardtii flagella exhibit different responses to increased viscosity depending on the presence or absence of specific dynein arms. In this study, motion of the cell body was analyzed to infer changes in beat frequency, propulsive effectiveness, force, and power. In addition, detailed quantitative analysis of the flagellar waveform was used to identify mutation-specific changes in response to increased viscosity. Waveform parameters including beat width, curvature, shear rate, delay between bends, and cumulative shear between bends were used to quantify these changes and illuminate the different roles of specific dynein arms.
Cell body motion at high viscosity
Beat frequency is the most obvious parameter distinguishing the behavior of different dynein mutants in viscous media (Figure 3). Under standard conditions, cells lacking outer dynein arms (oda2) have reduced beat frequency. As viscosity increases, wt and oda2 cells both respond by consistently decreasing beat frequency. Notably ida1 cells maintain a stable beat frequency at high viscosities (from 4 cP to 8 cP).
The current observations of beat frequency in uniflagellate mutants agree with most of the observations of Minoura and Kamiya (Minoura and Kamiya, 1995), who reported a decrease in beat frequency with increasing viscosity in biflagellate wt, ida1, and oda1 cells. However, Minoura and Kamiya (Minoura and Kamiya, 1995) did not note that ida1 cells maintained beat frequency at high viscosity. (Kamiya, 1988). Our observations of oda2 are consistent with the observations of Minoura and Kamiya in oda1 mutants (Minoura and Kamiya, 1995), since both oda1 and oda2 mutants fail to assemble the outer dynein arms. Generally, good agreement was found between the actual values of beat frequency, force, and power obtained in this study and in studies of both uniflagellate (Brokaw and Kamiya, 1987; Brokaw and Luck, 1985, 1983) and biflagellate cells (Minoura and Kamiya, 1995; Yagi et al., 2005).
Both wt and ida1 cells showed a significant increase in beats per rotation with viscosity. In particular, flagella of ida1 cells apparently maintain their ability to beat at high viscosities by altering their waveform and increasing the number of flagellar beats per rotation. The mechanisms by which the ida1 mutant maintains beat frequency were further investigated by waveform analysis, as discussed below.
Flagellar waveform at high viscosity
The amplitude of the flagellar waveform in ida1 cells was reduced at high viscosity. In contrast, the waveform amplitude in the oda2 mutant was not different from wt at baseline viscosity, and in fact appeared to be slightly larger in oda2 than wt at high viscosity. Local differences in curvature do not explain the differences in waveform amplitude. Only subtle changes in P-bend curvature, R-bend curvature, or average curvature magnitude were observed in ida1 mutant flagella as viscosity was increased. Wild-type uniflagellate cells exhibited significant increases in average curvature magnitudes with viscosity (Figure 8). This suggests that both I1/f and outer dynein arms are required to produce enough force and power to increase the elastic deformation of flagella under increased viscosity. Flagella apparently adjust their waveforms to reduce the viscous load. Most surprisingly, differences between statistical measures of curvature in the ida1 mutant and wt cells were smaller than corresponding differences between oda2 mutants and wt cells. This is notable, because the oda2 mutant waveform is often characterized as more similar to wild-type than is the ida1 waveform.
Differences in shear rate among mutants also do not explain the observed differences in waveform amplitude. Shear rates in ida1 mutant flagella are similar to wt shear rates at high viscosity, and are significantly higher than in oda2 flagella. However when normalized by beat frequency, normalized shear rates in ida1 are low, especially during the recovery stroke. The combination of a lower normalized shear rate, combined with a smaller fraction of the cycle devoted to recovery, corresponds to an abbreviated recovery stroke and stunted waveform.
Since curvature values and shear rates are similar in ida1 and wt, the shortened recovery stroke of ida1 flagella (Figure 12) appears to be due to a defect in switching, specifically early activation of the power stroke. This could be due to early termination of activity on the set of doublets (6-7-8) responsible for the recovery stroke, or early initiation of dynein activity on the doublets (2-3-4) responsible for the power stroke, or both (Lesich et al., 2014). In contrast, oda2 cells are able to maintain a large amplitude waveform despite lower average curvature values (Figure 8) by completing a longer power stroke before the recovery stroke begins (Figure 12). The extended power stroke in oda2 is less dramatic than the stunted recovery in ida1 mutants, but appears at all viscosity levels. This is consistent with a primary role of outer dynein arms in responding to inter-doublet force; the highest transverse inter-doublet forces are expected at the later stages of the power stroke (Lindemann, 2002, 1994a, 1994b; Figure 14).
Figure 14.
(a) In the geometric clutch model (Lindemann, 2002, 1994, e.g.) the probability of dynein (blue) attachment depends on inter-doublet spacing. (b-c) Tension and compression (black arrows) in curved doublets will lead to resultant transverse force components (red arrows) that pull the doublets together or push them apart. (d) Finite element mechanical simulations of curved beams with internal shear forces show that these forces lead to longitudinal tension (red) and compression (blue) in the doublets. (e) Tension and compression in curved doublets attached to one another produce transverse tensile (red) and compressive (blue) forces between the doublets. (f) A simulation of mathematical equations based on the geometric clutch model (Bayly and Wilson, 2014) shows that the transverse tensile force between doublets is greatest (red) near the base at the conclusion of the power stroke.
As viscosity increases, effects of dynein deficiencies are generally amplified. Mutants lacking I1/f respond to increased viscous loads by switching even earlier in the recovery stroke. This implies a significant role for force feedback in regulating activity of dynein arms other than I1/f. King (King, 2010) has proposed a mechanism for force feedback in the outer dynein arms based on tension sensing by the γHC-LC1-LC4- microtubule complex (King, 2010). Lindemann and co-authors (Lindemann, 2002, 1994c, Lesich et al., 2014; Lindemann and Lesich, 2010) have presented a large body of evidence in support of a relationship between inter-doublet-spacing, transverse force, and dynein activity: the “geometric clutch” hypothesis (Figure 14). Since the transverse force is roughly proportional to the product of cumulative dynein force and curvature (Bayly and Wilson, 2014; Lindemann, 1994a), it is plausible that at high viscosity the threshold levels of transverse force required for switching are reached earlier in the stroke. In contrast, mutants with intact I1/f arms delay switching until the recovery stroke is complete. Figure 14 illustrates the basic idea of the geometric clutch hypothesis and the mechanical factors that may affect switching. The current study does indicate that models which account for different roles of different dynein arms (Lindemann, 2002, e.g.) will be valuable in future theoretical work.
The observed differences in timing in different mutants are consistent with a hypothesized mechanism in which the primary role of the I1/f dynein arm may be to regulate inter-doublet separation, either to prolong the sliding associated with the recovery stroke or to delay the initiation of dynein activity associated with the power stroke. This possibility has been raised previously in a direct study of the biophysical properties of I1/f dynein (Kotani et al., 2007). Outer dynein arms also exert transverse force, as well as longitudinal forces, between doublets (Ueno et al., 2008). Prior authors ((Brokaw et al., 1982), e.g.) have shown that passive structural elements of the axoneme, such as the radial spokes, are responsible for imposing asymmetry on the flagellar waveform, and it is plausible that dynein activity may modulate this asymmetry (Heuser et al., 2012). In the intact axoneme, coordination between I1/f dynein and outer arm dyneins is likely facilitated by structural links that have been revealed by recent electron microscopy studies (Bui et al., 2012, 2008; Heuser et al., 2012; Nicastro et al., 2006; Yamamoto et al., 2013).
The limitations of the current study include the necessity for some manual tracing before automated polynomial fitting. This limits throughput, and thus precludes investigation of large sample sizes in a great diversity of mutants. A recent study (Martinez et al., 2014) has suggested that small-molecule impurities in Ficoll or other polymer solutions might be responsible for increases in cell swimming speed in such solutions. The authors used dialysis to remove such impurities. We did not use dialysis in the current study; however no increases in swimming speed with viscosity were observed and we believe it is unlikely that the systematic changes in waveform we observed are the effects of impurities.
Conclusion
Detailed waveform analysis provides valuable information on the differences between mutants and the roles of specific dynein arms, complementing information from cell body motion. Observations of the waveform at high viscosity have illuminated how the I1/f inner arm dynein helps regulate switching between recovery and power strokes. The role of I1/f in switching appears more important than its contributions to the amplitudes of shear rate or curvature. In addition, while lack of outer arms leads to lower beat frequency (Kamiya, 1988; Minoura and Kamiya, 1995; Yagi et al., 2005), it also affects the waveform. Force feedback in the outer arm systems appears important in initiating switching back and forth between power and recovery strokes; the I1/f dynein inhibits premature switching, particularly at the beginning of the power stroke.
Acknowledgements
Funding from the Children's Discovery Institute, NSF Grant CMMI-1265447 (Bayly), and NIH grant GM3243 (Dutcher) is gratefully acknowledged.
References
- Afzelius BA. Cilia-related diseases. J. Pathol. 2004;204:470–477. doi: 10.1002/path.1652. [DOI] [PMC free article] [PubMed] [Google Scholar]
- Bayly PV, Lewis BL, Kemp PS, Pless RB, Dutcher SK. Efficient spatiotemporal analysis of the flagellar waveform of Chlamydomonas reinhardtii. Cytoskelet. 2010;67:56–69. doi: 10.1002/cm.20424. [DOI] [PMC free article] [PubMed] [Google Scholar]
- Bayly PV, Lewis BL, Ranz EC, Okamoto RJ, Pless RB, Dutcher SK. Propulsive forces on the flagellum during locomotion of Chlamydomonas reinhardtii. Biophys J. 2011;100:2716–2725. doi: 10.1016/j.bpj.2011.05.001. [DOI] [PMC free article] [PubMed] [Google Scholar]
- Bayly PV, Wilson KS. Equations of interdoublet separation during flagella motion reveal mechanisms of wave propagation and instability. Biophys. J. 2014;107:1756–72. doi: 10.1016/j.bpj.2014.07.064. [DOI] [PMC free article] [PubMed] [Google Scholar]
- Bray D. Cell movements : from molecules to motility. Garland Publishing; New York: 2001. [Google Scholar]
- Brokaw CJ. Automated methods for estimation of sperm flagellar bending parameters. Cell Motil. 1984;4:417–30. doi: 10.1002/cm.970040603. [DOI] [PubMed] [Google Scholar]
- Brokaw CJ. Control of flagellar bending: a new agenda based on dynein diversity. Cell Motil Cytoskelet. 1994;28:199–204. doi: 10.1002/cm.970280303. [DOI] [PubMed] [Google Scholar]
- Brokaw CJ, Kamiya R. Bending patterns of Chlamydomonas flagella: IV. Mutants with defects in inner and outer dynein arms indicate differences in dynein arm function. Cell Motil Cytoskelet. 1987;8:68–75. doi: 10.1002/cm.970080110. [DOI] [PubMed] [Google Scholar]
- Brokaw CJ, Luck DJ. Bending patterns of chlamydomonas flagella I. Wild-type bending patterns. Cell Motil. 1983;3:131–150. doi: 10.1002/cm.970030204. [DOI] [PubMed] [Google Scholar]
- Brokaw CJ, Luck DJ. Bending patterns of chlamydomonas flagella: III. A radial spoke head deficient mutant and a central pair deficient mutant. Cell Motil. 1985;5:195–208. doi: 10.1002/cm.970050303. [DOI] [PubMed] [Google Scholar]
- Brokaw CJ, Luck DJ, Huang B. Analysis of the movement of Chlamydomonas flagella:” the function of the radial-spoke system is revealed by comparison of wild-type and mutant flagella. J Cell Biol. 1982;92:722–732. doi: 10.1083/jcb.92.3.722. [DOI] [PMC free article] [PubMed] [Google Scholar]
- Bui KH, Sakakibara H, Movassagh T, Oiwa K, Ishikawa T. Molecular architecture of inner dynein arms in situ in Chlamydomonas reinhardtii flagella. J. Cell Biol. 2008;183:923–32. doi: 10.1083/jcb.200808050. [DOI] [PMC free article] [PubMed] [Google Scholar]
- Bui KH, Yagi T, Yamamoto R, Kamiya R, Ishikawa T. Polarity and asymmetry in the arrangement of dynein and related structures in the Chlamydomonas axoneme. J. Cell Biol. 2012;198:913–25. doi: 10.1083/jcb.201201120. [DOI] [PMC free article] [PubMed] [Google Scholar]
- Christensen ST, Pedersen LB, Schneider L, Satir P. Sensory cilia and integration of signal transduction in human health and disease. Traffic. 2007;8:97–109. doi: 10.1111/j.1600-0854.2006.00516.x. [DOI] [PubMed] [Google Scholar]
- DiBella LM, King SM. Dynein motors of the Chlamydomonas flagellum. Int. Rev. Cytol. 2001;210:227–68. doi: 10.1016/s0074-7696(01)10007-0. [DOI] [PubMed] [Google Scholar]
- Dutcher SK. Mating and tetrad analysis in Chlamydomonas reinhardtii. Methods Cell Biol. 1995;47:531–540. doi: 10.1016/s0091-679x(08)60857-2. [DOI] [PubMed] [Google Scholar]
- Heuser T, Barber CF, Lin J, Krell J, Rebesco M, Porter ME, Nicastro D. Cryoelectron tomography reveals doublet-specific structures and unique interactions in the I1 dynein. Proc. Natl. Acad. Sci. U. S. A. 2012;109:E2067–76. doi: 10.1073/pnas.1120690109. [DOI] [PMC free article] [PubMed] [Google Scholar]
- Holmes JA, Dutcher SK. Cellular asymmetry in Chlamydomonas reinhardtii. J Cell Sci. 1989;94(Pt 2):273–285. doi: 10.1242/jcs.94.2.273. [DOI] [PubMed] [Google Scholar]
- Huang B, Ramanis Z, Dutcher SK, Luck DJ. Uniflagellar mutants of Chlamydomonas: evidence for the role of basal bodies in transmission of positional information. Cell. 1982;29:745–753. doi: 10.1016/0092-8674(82)90436-6. [DOI] [PubMed] [Google Scholar]
- Kagami O, Kamiya R. Translocation and rotation of microtubules caused by multiple species of Chlamydomonas inner-arm dynein. J. Cell Sci. 1992;103:653–664. [Google Scholar]
- Kamiya R. Mutations at Twelve Independent Loci Result in Absence of Outer Dynein Arms in Chflamydomonas reinhardtii. J. Cell Biol. 1988;107:2253–2258. doi: 10.1083/jcb.107.6.2253. [DOI] [PMC free article] [PubMed] [Google Scholar]
- Kamiya R, Kurimoto E, Muto E. Two types of Chlamydomonas flagellar mutants missing different components of inner-arm dynein. J Cell Biol. 1991;112:441–447. doi: 10.1083/jcb.112.3.441. [DOI] [PMC free article] [PubMed] [Google Scholar]
- King SJ, Dutcher SK. Phosphoregulation of an inner dynein arm complex in Chlamydomonas reinhardtii is altered in phototactic mutant strains. J Cell Biol. 1997;136:177–191. doi: 10.1083/jcb.136.1.177. [DOI] [PMC free article] [PubMed] [Google Scholar]
- King SM. Sensing the mechanical state of the axoneme and integration of Ca 2+ signaling by outer arm dynein. Cytoskeleton. 2010;67:207–213. doi: 10.1002/cm.20445. [DOI] [PMC free article] [PubMed] [Google Scholar]
- Kotani N, Sakakibara H, Burgess SA, Kojima H, Oiwa K. Mechanical properties of inner-arm dynein-f (dynein I1) studied with in vitro motility assays. Biophys. J. 2007;93:886–94. doi: 10.1529/biophysj.106.101964. [DOI] [PMC free article] [PubMed] [Google Scholar]
- Lesich KA, dePinho TG, Dionne BJ, Lindemann CB. The effects of Ca2+ and ADP on dynein switching during the beat cycle of reactivated bull sperm models. Cytoskeleton (Hoboken) 2014;71:611–27. doi: 10.1002/cm.21196. [DOI] [PubMed] [Google Scholar]
- Lindemann CB. A model of flagellar and ciliary functioning which uses the forces transverse to the axoneme as the regulator of dynein activation. Cell Motil Cytoskelet. 1994a;29:141–154. doi: 10.1002/cm.970290206. [DOI] [PubMed] [Google Scholar]
- Lindemann CB. A Geometric Clutch Hypothesis to Explain Oscillations of the Axoneme of Cilia and Flagella. J. Theor. Biol. 1994b;168:175–189. [Google Scholar]
- Lindemann CB. A “Geometric Clutch” Hypothesis to Explain Oscillations of the Axoneme of Cilia and Flagella. J. Theor. Biol. 1994c;168:175–189. [Google Scholar]
- Lindemann CB. Geometric Clutch model version 3: the role of the inner and outer arm dyneins in the ciliary beat. Cell Motil Cytoskelet. 2002;52:242–254. doi: 10.1002/cm.10049. [DOI] [PubMed] [Google Scholar]
- Lindemann CB, Lesich KA. Flagellar and ciliary beating: the proven and the possible. J Cell Sci. 2010;123:519–528. doi: 10.1242/jcs.051326. [DOI] [PubMed] [Google Scholar]
- Marshall WF. The cell biological basis of ciliary disease. J. Cell Biol. 2008;180:17–21. doi: 10.1083/jcb.200710085. [DOI] [PMC free article] [PubMed] [Google Scholar]
- Martinez VA, Schwarz-Linek J, Reufer M, Wilson LG, Morozov AN, Poon WCK. Flagellated bacterial motility in polymer solutions. Proc. Natl. Acad. Sci. U. S. A. 2014;111:17771–6. doi: 10.1073/pnas.1415460111. [DOI] [PMC free article] [PubMed] [Google Scholar]
- Merchant SS, Prochnik SE, Vallon O, Harris EH, Karpowicz SJ, Witman GB, Terry A, Salamov A, Fritz-Laylin LK, Maréchal-Drouard L, Marshall WF, Qu L-H, Nelson DR, Sanderfoot A. a, Spalding MH, Kapitonov VV, Ren Q, Ferris P, Lindquist E, Shapiro H, Lucas SM, Grimwood J, Schmutz J, Cardol P, Cerutti H, Chanfreau G, Chen C-L, Cognat V, Croft MT, Dent R, Dutcher S, Fernández E, Fukuzawa H, González-Ballester D, González-Halphen D, Hallmann A, Hanikenne M, Hippler M, Inwood W, Jabbari K, Kalanon M, Kuras R, Lefebvre P. a, Lemaire SD, Lobanov AV, Lohr M, Manuell A, Meier I, Mets L, Mittag M, Mittelmeier T, Moroney JV, Moseley J, Napoli C, Nedelcu AM, Niyogi K, Novoselov SV, Paulsen IT, Pazour G, Purton S, Ral J-P, Riaño-Pachón DM, Riekhof W, Rymarquis L, Schroda M, Stern D, Umen J, Willows R, Wilson N, Zimmer SL, Allmer J, Balk J, Bisova K, Chen C-J, Elias M, Gendler K, Hauser C, Lamb MR, Ledford H, Long JC, Minagawa J, Page MD, Pan J, Pootakham W, Roje S, Rose A, Stahlberg E, Terauchi AM, Yang P, Ball S, Bowler C, Dieckmann CL, Gladyshev VN, Green P, Jorgensen R, Mayfield S, Mueller-Roeber B, Rajamani S, Sayre RT, Brokstein P, Dubchak I, Goodstein D, Hornick L, Huang YW, Jhaveri J, Luo Y, Martínez D, Ngau WCA, Otillar B, Poliakov A, Porter A, Szajkowski L, Werner G, Zhou K, Grigoriev IV, Rokhsar DS, Grossman AR. The Chlamydomonas genome reveals the evolution of key animal and plant functions. Science. 2007;318:245–50. doi: 10.1126/science.1143609. [DOI] [PMC free article] [PubMed] [Google Scholar]
- Minoura I, Kamiya R. Strikingly different propulsive forces generated by different dynein- deficient mutants in viscous media. Cell Motil Cytoskelet. 1995;31:130–139. doi: 10.1002/cm.970310205. [DOI] [PubMed] [Google Scholar]
- Nicastro D, Schwartz C, Pierson J, Gaudette R, Porter ME, McIntosh JR. The molecular architecture of axonemes revealed by cryoelectron tomography. Science. 2006;313:944–948. doi: 10.1126/science.1128618. [DOI] [PubMed] [Google Scholar]
- Okita N, Isogai N, Hirono M, Kamiya R, Yoshimura K. Phototactic activity in Chlamydomonas “non-phototactic” mutants deficient in Ca2+-dependent control of flagellar dominance or in inner- arm dynein. J Cell Sci. 2005;118:529–537. doi: 10.1242/jcs.01633. [DOI] [PubMed] [Google Scholar]
- Pazour GJ, Agrin N, Walker BL, Witman GB. Identification of predicted human outer dynein arm genes: candidates for primary ciliary dyskinesia genes. J. Med. Genet. 2006;43:62–73. doi: 10.1136/jmg.2005.033001. [DOI] [PMC free article] [PubMed] [Google Scholar]
- Piperno G, Ramanis Z, Smith EF, Sale WS. Three distinct inner dynein arms in Chlamydomonas flagella: molecular composition and location in the axoneme. J Cell Biol. 1990;110:379–389. doi: 10.1083/jcb.110.2.379. [DOI] [PMC free article] [PubMed] [Google Scholar]
- Rasband WS. ImageJ [Google Scholar]
- Rikmenspoel R. Contractile mechanisms in flagella. Biophys. J. 1971;11:446–463. doi: 10.1016/S0006-3495(71)86227-6. [DOI] [PMC free article] [PubMed] [Google Scholar]
- Ringo DL. Flagellar Motion and Fine Structure of the Flagellar Apparatus in Chlamydomonas. J. Cell Biol. 1967;33:543–571. doi: 10.1083/jcb.33.3.543. [DOI] [PMC free article] [PubMed] [Google Scholar]
- Sager R, Granick S. Nutritional Studies with Chlamydomonas reinhardi. Ann. N. Y. Acad. Sci. 1953;56:831–838. doi: 10.1111/j.1749-6632.1953.tb30261.x. [DOI] [PubMed] [Google Scholar]
- Storm van's Gravesande K, Omran H. Primary ciliary dyskinesia: clinical presentation, diagnosis and genetics. Ann Med. 2005;37:439–449. doi: 10.1080/07853890510011985. [DOI] [PubMed] [Google Scholar]
- Summers KE, Gibbons IR. Adenosine triphosphate-induced sliding of tubules in trypsin-treated flagella of sea-urchin sperm. Proc Natl Acad Sci U S A. 1971;68:3092–3096. doi: 10.1073/pnas.68.12.3092. [DOI] [PMC free article] [PubMed] [Google Scholar]
- Tenenbaum JB, de Silva V, Langford JC. A global geometric framework for nonlinear dimensionality reduction. Science (80−.) 2000;290:2319–2323. doi: 10.1126/science.290.5500.2319. [DOI] [PubMed] [Google Scholar]
- Ueno H, Yasunaga T, Shingyoji C, Hirose K. Dynein pulls microtubules without rotating its stalk. Proc Natl Acad Sci U S A. 2008;105:19702–19707. doi: 10.1073/pnas.0808194105. [DOI] [PMC free article] [PubMed] [Google Scholar]
- Wirschell M, Hendrickson T, Sale WS. Keeping an eye on I1: I1 dynein as a model for flagellar dynein assembly and regulation. Cell Motil Cytoskelet. 2007;64:569–579. doi: 10.1002/cm.20211. [DOI] [PubMed] [Google Scholar]
- Woolley DM, Vernon GG. Functional state of the axonemal dyneins during flagellar bend propagation. Biophys. J. 2002;83:2162–9. doi: 10.1016/S0006-3495(02)73976-3. [DOI] [PMC free article] [PubMed] [Google Scholar]
- Yagi T, Minoura I, Fujiwara A, Saito R, Yasunaga T, Hirono M, Kamiya R. An axonemal dynein particularly important for flagellar movement at high viscosity. Implications from a new Chlamydomonas mutant deficient in the dynein heavy chain gene DHC9. J Biol Chem. 2005;280:41412–41420. doi: 10.1074/jbc.M509072200. [DOI] [PubMed] [Google Scholar]
- Yamamoto R, Song K, Yanagisawa H-A, Fox L, Yagi T, Wirschell M, Hirono M, Kamiya R, Nicastro D, Sale WS. The MIA complex is a conserved and novel dynein regulator essential for normal ciliary motility. J. Cell Biol. 2013;201:263–78. doi: 10.1083/jcb.201211048. [DOI] [PMC free article] [PubMed] [Google Scholar]


