

Summary
Autophagy degrades lipid droplets (LD) via lipophagy. Cytosolic lipases, ATGL and HSL, are canonical mechanisms for lipolysis. Whether autophagy proteins engage in direct crosstalk with lipases to promote lipid mobilization remains unknown. The integrative physiology of an inter-organ communication in lipophagy regulation is also unknown. Here, we show that cold induces autophagy in proopiomelanocortin (POMC) neurons, and activates lipophagy in brown fat (BAT) and liver in mice. Targeted activation of autophagy in POMC neurons via intra-hypothalamic rapamycin is sufficient to trigger lipid utilization in room temperature-housed mice. Conversely, inhibiting autophagy in POMC neurons or in peripheral tissues or denervating BAT blocks lipid utilization. Unexpectedly, the autophagosome marker LC3 is mechanistically coupled to ATGL-mediated lipolysis. ATGL exhibits LC3-interacting region (LIR) motifs, and mutating a single LIR motif on ATGL displaces ATGL from LD and disrupts lipolysis. Thus, autophagy in the CNS and periphery coordinate lipophagy in the control of lipolysis.
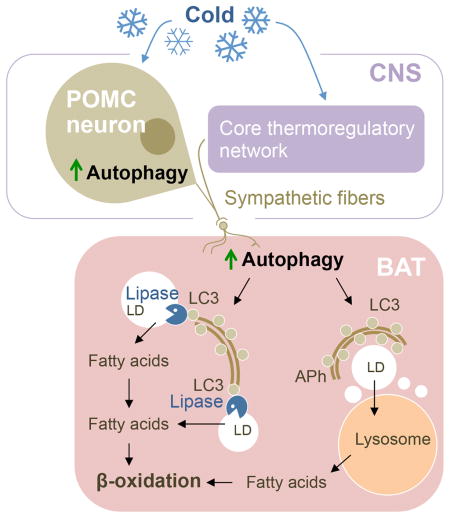
Graphical Abstract
Introduction
The mediobasal hypothalamus (MBH) consists of neurochemically and functionally distinct agouti-related peptide (AgRP) and proopiomelanocortin (POMC) neurons that differentially regulate feeding and energy expenditure (Belgardt et al., 2009). While AgRP neurons stimulate feeding, POMC neurons suppress appetite and promote energy expenditure, in part, by contributing to sympathetic outputs to peripheral tissues (Morrison and Madden, 2014; Morrison et al., 2014; Tupone et al., 2014). Brown adipose tissue (BAT) is functionally distinct from white adipose tissue (WAT) and plays a central role in maintenance of body temperature (Cannon and Nedergaard, 2004). Abundant sympathetic innervation, greater mitochondrial mass and presence of uncoupling protein-1 (UCP1) allow BAT to efficiently uncouple substrate oxidation from energy production to generate heat. POMC neurons are exquisitely sensitive to circulating hormones, leptin and insulin (Cowley et al., 2001; Xu et al., 2005), and central leptin availability is permissive for cold-evoked thermogenesis in BAT (Enriori et al., 2011) possibly by enhancing lipid utilization. By contrast, neuronal populations in the ventrolateral medulla and nucleus tractus solitarius counter-regulate cold-evoked thermogenesis in BAT (Cao et al., 2010).
Autophagy maintains quality control by degrading cytoplasmic contents in lysosomes (He and Klionsky, 2009). Greater than 30 autophagy-related (Atg) proteins orchestrate the biogenesis of autophagosomes (APh) that sequester cytoplasmic cargo for lysosomal degradation. Atg7, an E1-like ligase binds Atg12 to Atg5, which in turn binds to Atg16L1 (He and Klionsky, 2009). This cascade regulates conjugation of cytosolic light chain 3 (LC3)-I into phosphatidylethanolamine-bound LC3-II that labels APh (He and Klionsky, 2009). LC3-II decorates inner and outer membranes of APh, and is the only reliable marker to analyze autophagy flux. A complex interplay between the nutrient sensor mTOR (Kamada et al., 2000) and an essential upstream regulator ULK1 regulates autophagy (He and Klionsky, 2009).
Autophagy in AgRP neurons drives feeding (Kaushik et al., 2011). In contrast, loss of autophagy in POMC neurons confers leptin resistance (Quan et al., 2012), disrupts axonal development (Coupe et al., 2012), decreases neuronal levels of POMC-derived α-melanocyte stimulating hormone (Kaushik et al., 2012), and dampens sympathetic outflow to WAT (Kaushik et al., 2012). Accordingly, POMC-selective Atg7KO (Atg7KOPOMC) mice are obese; however, how loss of POMCergic autophagy prevents lipid utilization in peripheral tissues remains unknown. Lipases, adipose triglyceride lipase (ATGL) (Zimmermann et al., 2004) and hormone sensitive lipase (HSL) (Souza et al., 2002), mobilize cell-intrinsic lipid stores. On the other hand, autophagy has recently been shown to degrade lipid droplets (LD) via lipophagy (Singh et al., 2009). Deleting Atg7 blocks autophagy and promotes hepatic lipid accumulation mimicking human fatty liver disease (Singh et al., 2009). Despite these advances, several questions remain unanswered. For instance, (i) whether cold activates lipophagy, and whether lipophagy participates in cold-induced BAT lipid metabolism remain unknown. (ii) The contribution of lipases and lipophagy to lipolysis, and whether Atg proteins cooperate with lipases to promote lipid mobilization are not known. (iii) Finally, the integrative physiology of an inter-organ communication in lipophagy regulation remains to be elucidated.
To address these questions we studied the biology of lipophagy in BAT and liver in response to cold - a physiological activator of lipolysis. We hypothesized that activation of lipophagy in response to neuronal cues regulates cold-induced LD turnover in BAT/liver. Here we show that cold activates autophagy in MBH, and drives LD consumption in BAT/liver via lipophagy. Blocking autophagy in POMC neurons inhibits cold-induced lipophagy. Conversely, stimulating POMCergic autophagy is sufficient to activate lipophagy and deplete LD in room temperature (RT)-housed mice. Unexpectedly, in addition to its roles in lipophagy, LC3 regulates ATGL-mediated lipid mobilization. ATGL and HSL each exhibit multiple LC3-interacting region (LIR) motifs, and mutating a single LIR motif on ATGL blocks ATGL-mediated lipolysis. Finally, we show that lipophagy and LC3-regulated ATGL activity display complementarity towards total lipolysis. Thus, autophagy in the CNS and periphery coordinate lipophagy in the control of lipolysis.
Results
Cold activates autophagy in BAT and liver
Cold activates BAT and mobilizes BAT LD to maintain body temperature (Cannon and Nedergaard, 2004). Whether cold activates autophagy and whether autophagy participates in LD breakdown in BAT/liver remain undetermined. To test whether cold activates autophagy flux, we pretreated mice with an intraperitoneal (i.p.) injection of a lysosomal inhibitor (Lys Inh), leupeptin, for 1 hr following which mice were housed at room temperature (RT) or cold-exposed for 1 hr at 4°C (Fig. 1A). The degree of LC3-II accumulation following lysosomal inhibition reflects LC3-II flux or autophagy flux as per guidelines to study autophagy (Klionsky et al., 2012). Cold increased LC3-II flux in freshly isolated BAT by ~2-fold (p=0.11) and in liver by ~3-fold (*p<0.05) (Fig. 1B and 1C). BAT from cold-exposed mice also displayed increased expression of autophagy genes Atg7, Lc3b, and Atg8 orthologues Gabarap and Gabarapl1 (Kabeya et al., 2004) when compared to RT-housed mice (Fig. 1D). Increases in Atg gene expression were also detected in liver (Fig. S1A), although epididymal WAT only showed increased Ulk1 expression (Fig. S1B). BAT from cold-exposed mice also displayed increased protein levels of Atg7, Atg12-Atg5, Beclin1, and of WIPI2, a PI3P effector during APh maturation, and increased ULK1 phosphorylation at Serine-555 (Fig. 1E), which is an AMPK target during starvation-induced autophagy (Egan et al., 2011). Cold-activated BAT displayed ~30% increase in LC3-II puncta per cell (***p<0.001) (Fig. 1F), ~2-fold increase in LAMP1 staining indicating lysosomal expansion (***p<0.001) (Fig. 1G), and ~30% increase in LC3/LAMP1 colocalization (***p<0.001) (Fig. 1H) - demonstrating autophagy activation. To confirm cold-induced autophagy activation in BAT, mice were maintained at RT or cold-exposed for 1 hr, and a subset of the 1 hr cold-exposed mice was returned to RT for 2 hr (Fig. 1I). BAT was collected from each cohort and subjected to LC3-II flux analyses in presence or absence of Lys Inh (Fig. 1I). As anticipated, cold-exposed mice displayed >2-fold increase in LC3-II flux in BAT (**p<0.01), which reverted to basal levels when cold-exposed mice were returned to RT (Fig. 1J).
Fig. 1. Cold activates autophagy in BAT and liver.

(A) Plan for in vivo LC3-II flux in room temperature (RT)-housed or 1 hr cold-exposed mice injected with intraperitoneal (i.p.) lysosomal inhibitor (Lys Inh) for 2 hr. (B–C) LC3 immunoblot (IB) in BAT and liver as described in A, n=3. (D) qPCR of indicated genes in BAT from RT and 1 hr cold-exposed 5–6 mo male mice, n=4. (E) IB, and (F–H) immunofluorescence (IF) for indicated proteins in BAT from RT and 1 hr cold-exposed 5–6 mo male mice, n=3. Scale: 10 μm. White pixels in H indicate colocalization. (I) Plan for LC3-II flux in BAT explants from RT-housed and cold-exposed mice, and from a subset of cold-exposed mice returned to RT for 2 hr, n=3. (J) LC3-II flux in BAT as described in I, n=3. Bars are mean±sem. *P<0.05, **P<0.01, ***P<0.001; Student’s t-test. Ponceau is loading control. See also Figure S1.
Cold-induced autophagy activation in BAT paralleled sympathetic activation as indicated by induction of ATGL, HSL, and UCP1 and ~20-fold increase in β3-adrenergic receptor (Adβ3) expression (Mund and Frishman, 2013) (Fig. S1C and S1D). Given these findings, we asked whether exposing RT-housed mice to sympathomimetic isoproterenol activates autophagy. Indeed, injecting isoproterenol (i.p.) in RT-housed mice (10 mg/kg body wt/15 min) increased LC3-II flux in liver and BAT by ~6–8-fold (Fig. S1E and S1F). Taking in light that cold activates autophagy; these results suggest that autophagy is an effector of adrenergic stimulation during cold exposure.
Cold activates hypothalamic autophagy
Since the MBH influences energy expenditure (Belgardt et al., 2009) we sought to dissect the neuronal mechanism regulating cold-induced autophagy. To that purpose, we explored whether cold also activates autophagy in MBH by analyzing LC3-II flux and Atg gene expression in MBH from 1 hr cold-exposed mice (Fig. 2A). Cold increased MBH expression of Atg7, Gabarap, Lamp1 (Fig. 2B), and increased c-fos expression by ~6-fold (***p<0.001), suggesting neuronal activation (Kovacs, 2008) (Fig. S2). Immunostaining of MBH sections revealed ~25% increase in Atg7 protein levels (***p<0.001) (Fig. 2C) and >2-fold expansion of LAMP1-positive organelles (***p<0.001) (Fig. 2D), while immunoblotting revealed ~2-fold increase in steady-state LC3-II levels in MBH during cold exposure (*p<0.05) (Fig. 2E). To determine whether cold increased autophagy in MBH, we used two independent strategies to evaluate LC3-II flux. First, freshly isolated MBH explants from RT-housed or cold-exposed mice were exposed to PBS or Lys Inh for 2 hr at 37°C (Fig. 2F), and LC3-II flux was determined as described (Kaushik et al., 2012; Klionsky et al., 2012). As anticipated, cold exposure for 1 hr activated LC3-II flux in MBH when compared to RT-housed controls (p<0.07) (Fig. 2G). Increased autophagy flux was confirmed by stereotaxically injecting MBH with Lys Inh following which mice were RT-housed or cold-exposed for 1 hr (Fig. 2H), and these analyses revealed a robust trend of cold-driven autophagy activation in MBH (p=0.22) (Fig. 2I).
Fig. 2. Cold activates hypothalamic autophagy.

(A) Plan for autophagy analyses in mediobasal hypothalamus (MBH) from RT-housed or 1 hr cold-exposed mice. (B) qPCR of indicated genes, (C–D) immunofluorescence (IF) for Atg7 and LAMP1, and (E) immunoblot (IB) for LC3 in MBH from RT-housed and 1 hr cold-exposed 5–6 mo male mice, n=3, 3V=3rd ventricle. Scale: 10 μm. (F) Plan, and (G) IB for LC3-II in MBH explants from RT-housed and 1 hr cold-exposed 5–6 mo male mice treated or not with lysosomal inhibitor (Lys Inh) for 2 hr, n=3. (H) Plan, and (I) IB for LC3-II in MBH from C57B6 mice cannulated and pre-treated with leupeptin or PBS as in 2H, n=3. (J–K) IF for indicated proteins in MBH from RT and 1 hr cold-exposed 6 mo male mice, n=3–4. Bars are mean±s.e.m. *P<0.05, **P<0.01, ***P<0.001; Student’s t-test. Scale: 10 μm. Ponceau is loading control. See also Figure S2.
To determine whether cold activates autophagy in AgRP neurons or POMC neurons, we co-immunostained MBH sections for LAMP1 and neuron-selective markers AgRP or α-melanocyte stimulating hormone (MSH), a derivative of POMC. We chose LAMP1 expansion as a surrogate read-out for autophagy activity in neurons in vivo instead of LC3 since it is difficult to reliably distinguish between the diffuse cytosolic LC3-I signal and APh-associated LC3-II puncta in MBH, given the abundant LC3-I expression levels in brain. By contrast, lysosomal expansion during acute perturbations, as assessed by LAMP1 staining in Fig 1G and 2D, reliably associates with increased autophagy. Indeed, both AgRP and POMC neurons displayed increased LAMP1 staining following cold exposure (Fig. 2J and 2K), although α-MSH-positive neurons showed >5-fold increase in lysosomal expansion (***p<0.001) compared to ~25 % increase in lysosomal expansion in AgRP neurons (**p<0.01). Since Atg7KOPOMC mice are reportedly obese (Coupe et al., 2012; Kaushik et al., 2012; Quan et al., 2012) and AgRP-selective Atg7KO mice are lean (Kaushik et al., 2011), we conclude that cold-induced autophagy in POMC neurons is coupled to lipid utilization in peripheral tissues.
Cold increases autophagic sequestration of LD in BAT and liver
To begin to test whether lipophagy degrades LD in BAT, we analyzed colocalization of the APh marker LC3 with neutral lipid dye BODIPY 493/503 in BAT from RT-housed and 1 hr cold-exposed mice. Cold increased BODIPY/LC3 colocalization in BAT (Fig. 3A), indicating sequestration of LD by APh as described in livers (Singh et al., 2009). Although, we observed comparable BODIPY/LAMP1 colocalization in BAT from control and cold-exposed mice (Fig. S3A), the absence of Lys Inh in these experiments likely led to degradation of lipid delivered to lysosomes, thus under-estimating the degree of BODIPY/LAMP1 colocalization in cold-exposed mice. Consistent with increased BODIPY/LC3 colocalization, immunoblotting revealed enrichment of Atg12-Atg5, Beclin1, and LC3-II in LD from BAT/liver from cold-exposed mice (Fig. 3B and 3C), supporting our notion that cold increases autophagic sequestration of LD. Presence of PLIN3 and absence of cytosolic GAPDH confirmed the relative enrichment of LD fractions and excluded cytosolic contamination (Fig. 3B and 3C). Cold-induced abundance of LC3-II in LD paralleled the enrichment of ATGL and HSL in LD (Fig. 3B and 3C) suggesting that lipophagy and neutral lipases may act in concert to mobilize LD.
Fig. 3. Cold-induced autophagy degrades LD in BAT.

(A) Immunofluorescence (IF) for LC3 and BODIPY 493/503 in BAT, n=3, and (B–C) immunoblots (IB) for indicated proteins in BAT and liver homogenates (Hom) and LD from 5–6 mo male RT-housed and 1 hr cold-exposed mice (5 livers and 5 BAT were pooled per sample per experiment, n=2). (D) IB for indicated proteins in BAT LD from RT-housed or 1 hr cold-exposed control and Atg7KOMyf5 mice (4–5 BAT were pooled per sample per experiment, n=2). (E) Hematoxylin/eosin (H&E)-stained BAT from 1 hr cold-exposed Con and Atg7KOMyf5 mice. (F) Plan to inject Control adenovirus (Con-AdV) or Cre-expressing adenoviruses (Cre-AdV) in BAT from Atg7F/F mice, and (G) qPCR for BAT Atg7 and Atg5, and (H) BODIPY 493/503 staining in BAT from Atg7F/F mice injected with Con-AdV or Cre-AdV, n=3. Scale: 10 μm. Bars are mean±s.e.m. *P<0.05, **P<0.01, ***P<0.001; Student’s t-test. See also Figure S3.
Blocking autophagy in BAT decreases LD turnover
To confirm that autophagy degrades LD in BAT, we examined LD content in BAT from cold-exposed control and Atg7KOMyf5 mice that lack Atg7 in Myf5-positive progenitors (Martinez-Lopez et al., 2013b). Myf5-positive cells give rise to BAT, and thus BAT from Atg7KOMyf5 mice fail to generate LC3-II and are autophagy-deficient (Fig. 3D). While cold increased LC3-II levels in LD from control BAT (Fig. 3D), LD from RT and cold-exposed Atg7KOMyf5 mice displayed complete absence of LC3-II. Consequently, Atg7KOMyf5 BAT maintained higher LD content in the basal state as reported (Martinez-Lopez et al., 2013b), and failed to mobilize lipid after 1 hr cold exposure (Fig. 3E). To exclude that LD accumulation in Atg7KOMyf5 mice occurs from perturbed BAT differentiation (Martinez-Lopez et al., 2013b), we silenced BAT Atg7 in adult Atg7F/F mice via intra-BAT injections of Cre adenoviruses (AdV-Cre) (Fig. 3F), and determined the effect of acute loss of autophagy on lipid utilization. Injecting AdV-Cre in Atg7F/F BAT suppressed Atg7 expression by ~50% without modifying Atg5 expression (Fig. 3G) or affecting Atg7 expression in other fat depots (Fig. S3B), and blocked BAT LD turnover in cold-exposed mice by ~3-fold (***p<0.001) (Fig. 3H) - demonstrating that autophagy degrades LD in BAT.
Blocking autophagy in POMC neurons leads to lipophagy failure
Since BAT from fasted Atg7KOPOMC mice resist lipid utilization when compared to fasted controls (Fig. S4A), we asked whether autophagy in POMC neurons regulates lipophagy in peripheral tissues. To test this hypothesis, we subjected BAT and liver from RT-housed and 1 hr cold-exposed control and Atg7KOPOMC mice to LC3-II flux analyses (Fig. 4A). While tissues from 1 hr cold-exposed controls displayed accumulation of LC3-II in presence of Lys Inh indicating activation of autophagy flux (Fig. 4B and 4C; lanes 5/6 vs. lanes 1/2), those from cold-exposed Atg7KOPOMC mice failed to activate autophagy (Fig. 4B and 4C; lanes 7/8 vs. lanes 5/6) (Fig. S4B). Consequently, cold-exposed Atg7KOPOMC mice displayed ~30–40% reduction in LC3-II enrichment in LD from BAT and liver – indicating reduced lipophagy (Fig. 4D and 4E). Accordingly, Atg7KOPOMC mice completely failed to mobilize their BAT LD during cold exposure, and displayed a modest ~30% increase in BAT lipid content at RT (Fig. 4F, and Fig. S4C-top). By contrast, cold-exposed control mice depleted their BAT lipid content by ~50% (Fig. 4F, and Fig. S4C-top). Cold-exposed Atg7KOPOMC mice also displayed increased Oil Red O stains in liver indicating reduced LD breakdown (Fig. 4G). Decreased LC3-II flux and lipid accumulation in BAT/liver from Atg7KOPOMC mice did not occur from inadvertent Cre-mediated deletion of Atg7 since comparable Atg7 and Atg5 expression were detected in tissues from control and Atg7KOPOMC mice (Fig. S4D and S4E).
Fig. 4. Blocking POMCergic autophagy inhibits lipophagy.

(A) Plan to analyze autophagy in BAT/liver. (B) Immunoblot (IB) for LC3-II in BAT, and (C) liver explants from RT-housed and 1 hr cold-exposed control and Atg7KOPOMC mice treated or not with Lys Inh for 2 hr, n=3. (D) IB for indicated proteins in BAT LD, and (E) liver LD from RT-housed and 1 hr cold-exposed control and Atg7KOPOMC mice (5 livers and 5 BAT were pooled per sample per experiment, n=2). (F) BODIPY 493/503 staining in BAT from RT-housed and 1 hr cold-exposed control and Atg7KOPOMC mice, n=3. (G) Oil Red O staining in liver from 1 hr cold-exposed control and Atg7KOPOMC mice, n=3. (H–I) BAT and (J–K) liver oxygen consumption rates (OCR) and AUC (area under curve) from 5–6 mo RT-housed and 1 hr cold-exposed Atg7KOPOMC male mice, n=4. (L) OCR in BAT from 1 hr cold-exposed male control and Atg7KOAgRP male mice, n=3. (M) Rectal temperature in control and Atg7KOPOMC male mice at RT and after 15 min and 30 min of cold exposure, n=5. Bars are mean±s.e.m. *P<0.05, **P<0.01; Student’s t-test. Ponceau is loading control. See also Figure S4.
Interestingly, although Atg7KOPOMC mice resisted cold-induced LD breakdown (Fig. S4C-top), injecting sympathomimetic isoproterenol (i.p.) completely reversed this block in BAT lipid utilization (**P<0.01) (Fig. S4C-bottom). Since cold-evoked BAT activation requires a central thermoregulatory network (Morrison and Madden, 2014), administering isoproterenol bypassed the neurological deficits in KO mice and rescued lipolysis (Fig. S4C-bottom). These results indicate that BAT in KO mice remains responsive to catecholamines, and that the primary cause of reduced lipid utilization in BAT is the defect in the CNS.
Loss of autophagy in POMC neurons decreases oxygen consumption
In keeping with decreased LD breakdown in Atg7KOPOMC mice, while BAT from cold-exposed control mice displayed higher oxygen consumption rates (OCR) when compared to RT-housed controls (Fig. 4H and 4I; **p<0.01), BAT and liver from cold-exposed KO mice displayed ~50% reduction in OCR when compared to their respective controls (*P<0.05) (Fig. 4H–4K, and Fig. 4I and 4K). BAT from RT-housed Atg7KOPOMC mice displayed modestly higher basal OCR compared to RT-housed controls (Fig. 4H and 4I); however, these differences were not statistically significant (n.s.) (Fig. 4I). BAT from cold-exposed Atg7KOAgRP mice (Kaushik et al., 2011) displayed similar OCR when compared to controls (Fig. 4L) indicating that disrupting autophagy in POMC neurons, and not AgRP neurons, blocks cold-induced lipid utilization in mice. Furthermore, we observed a correlation between aberrant BAT lipid utilization in Atg7KOPOMC mice and reduced core temperature at RT and during cold exposure (Fig. 4M), which was not detected in Atg7KOAgRP mice (data not shown).
Stimulating autophagy in POMC neurons activates lipophagy
Since blocking autophagy in POMC neurons inhibits lipophagy, we asked whether activating autophagy in POMC neurons increases lipophagy in BAT/liver. Rapamycin suppresses mTOR signaling, which relieves the inhibition of mTOR and activates autophagy (Kamada et al., 2000). Consequently, wild-type C57B6 mice or Atg7KOPOMC mice and their littermate controls were subjected to intra-MBH cannulation and injected with a single dose of 2 μg of rapamycin (Rap) or DMSO (control) (Fig. 5A). Intra-MBH Rap blocked mTOR signaling indicated by decreased hypothalamic p70S6K phosphorylation without modifying total p70S6K levels (Fig. S5A). Accordingly, intra-MBH Rap increased MBH LC3-II flux by ~2-fold in control mice (p=0.07) but failed to activate autophagy in Atg7KOPOMC mice (Fig. S5B), confirming that intra-MBH Rap activates autophagy in POMC neurons.
Fig. 5. Stimulating hypothalamic autophagy activates lipophagy in BAT/liver.

(A) Plan for mediobasal hypothalamus (MBH) cannulation and intra-MBH injections of DMSO or rapamycin (Rap) for 2 hr at RT. (B) qPCR of indicated genes, (C) Immunoblot (IB) for LC3 in presence or absence of lysosomal inhibitor (Lys Inh), (D) Ucp1 expression, and (E–F) IB for indicated proteins in Hom/LD fractions from indicated tissues from intra-MBH DMSO or Rap treated mice. (5 BAT pads pooled per sample per experiment, n=2). (G) Liver triglycerides, and (H) BODIPY 493/503 staining in BAT from intra-MBH DMSO or Rap-injected 6 mo male control and Atg7KOPOMC mice, n=5. (I) Plan for blocking autophagy (Atg7KO) or lysosomal function (Lys Inh) in BAT or liver followed by intra-MBH administration of DMSO or Rap. (J) BODIPY staining in BAT from intra-MBH DMSO and Rap-injected 4 mo male control or Atg7KOMyf5 mice, n=4. (K) Plan and analyses of liver triglycerides in mice pretreated or not with Lys Inh i.p. for 2 hr or (L) subjected to tail vein AdV-Con or AdV-Cre injections to deplete Atg7 and then exposed to intra-MBH DMSO or Rap, n=4. Bars are mean±s.e.m. *P<0.05, **P<0.01, ***P<0.001; Student’s t-test. Ponceau is loading control. See also Figure S5.
To determine whether intra-MBH Rap-induced stimulation of MBH autophagy led to activation of autophagy in BAT/liver, we analyzed LC3-II flux and Atg gene expression in BAT from intra-MBH DMSO or Rap-injected mice. Surprisingly, a single 2 μg dose of intra-MBH Rap in RT-housed mice led to ~1.5-fold increase in expression of Atg7, Atg3, Lc3b, Beclin1 (***p<0.001), >2-fold increase in Lamp1 expression (***p<0.001), and ~4-fold increase in expression of a master-regulator of autophagy, Tfeb (***p<0.001) in BAT (Fig. 5B). Furthermore, intra-MBH Rap increased LC3-II flux in BAT by >3-fold (***p<0.001) (Fig. 5C) confirming autophagy activation. Interestingly, intra-MBH Rap-induced increases in BAT Atg gene expression (Fig. 5B) mimicked increases in BAT Atg gene expression in cold-exposed mice (Fig. 1D). Intra-MBH Rap also increased BAT Ucp1 expression by ~2.5-fold (***p<0.001) (Fig. 5D), which typically associates with BAT activation, indicating that stimulating MBH autophagy is sufficient to activate autophagy in BAT in RT-housed mice.
To determine whether intra-MBH Rap activates lipophagy in BAT/liver, we analyzed LC3-II enrichment in LD isolated from BAT and liver from intra-MBH DMSO and Rap-injected mice. Consistent with lipophagy activation, we found enrichment of LC3-II in LD isolated from BAT and liver from intra-MBH Rap-injected mice (Fig. 5E and 5F). Enrichment of LC3-II in LD following intra-MBH Rap injection associated with depletion of liver triglycerides and BAT LD by ~50% (*p<0.05) (Fig. 5G and 5H, and S5C). Liver fat depletion occurred independently of changes in lipogenesis (equivalent Pparg expression) or cellular lipid uptake (equivalent Cd36 expression) or lipid efflux (comparable serum triglycerides) (Fig. S5D and S5E). In addition, while BAT from control mice depleted their lipid in response to intra-MBH Rap, BAT from Atg7KOPOMC mice resisted LD breakdown in response to intra-MBH Rap (Fig. 5H and S5C) or cold exposure (Fig. 4F), demonstrating that POMCergic autophagy is required to mobilize LD in peripheral tissues.
Stimulating POMCergic autophagy leads to LD turnover in lysosomes
To confirm that intra-MBH Rap-mediated lipid depletion occurs through lipophagy, we used three independent strategies to block autophagy in liver and BAT (Fig. 5I): (1) deleting Atg7 in BAT by use of Atg7KOMyf5 mice, (2) acute lysosomal inhibition by injection of lysosomal inhibitor, leupeptin (Lys Inh i.p.), and (3) acutely depleting hepatic Atg7 via tail vein injections of Cre-expressing adenoviruses (AdV) in Atg7F/F mice. We then determined the contribution of lipophagy to peripheral lipid depletion following activation of MBH autophagy via intra-MBH Rap (Fig. 5I). While intra-MBH Rap depleted BAT LD in control mice (Fig. 5H and 5J), intra-MBH Rap failed to deplete LD in BAT from Atg7KOMyf5 mice (Fig. 5J). Similarly, inhibiting hepatic lysosomal function by Lys Inh i.p. (Fig. 5K) or depleting Atg7 by expressing Cre transgene in Atg7F/F mice (Fig. 5L) blocked intra-MBH Rap-induced depletion of liver triglycerides. These results confirm that lipophagy in BAT/liver degrades LD upon activation of autophagy in POMC neurons.
Lipophagy failure in denervated BAT
Since MBH neurons contribute to sympathetic outputs to peripheral tissues (Morrison and Madden, 2014), we investigated whether neuronal projections transduce signals that activate peripheral lipophagy. To that purpose, mice were subjected to unilateral BAT denervation (Fig. 6A), and after 5 days rest, denervated and contralateral innervated BAT pads were analyzed for LC3-II flux after intra-MBH Rap administration (Fig. 6B). Intra-MBH Rap increased LC3-II levels in intact BAT (Fig. 6C and 5C) that accumulated upon treatment with Lys Inh – indicating activated autophagy flux (Fig. 6C). By contrast, denervated BAT failed to increase their LC3-II levels and LC3-II flux following intra-MBH Rap treatment (Fig. 6C). Denervation also blocked intra-MBH Rap-induced increases in ucp1 expression whilst those of Atg7 and Ulk1 remained unaffected (Fig. 6D). Finally, denervation suppressed intra-MBH Rap-induced enrichment of LC3-II in LD indicating lipophagy failure (Fig. 6E). Consistent with lipophagy failure, denervated BAT maintained higher basal lipid content and failed to deplete lipid after intra-MBH Rap treatment (Fig. 6F), while innervated BAT remained responsive to intra-MBH Rap (Fig. 5H, 5J and 6F). These results suggest that neuronal networks link POMCergic autophagy to peripheral lipophagy. Supporting this notion, intra-MBH Rap increased BODIPY/LC3 colocalization by ~60% in BAT from control mice indicating activation of lipophagy (*p<0.05) (Fig. 6G); while, BAT from intra-MBH Rap-injected Atg7KOPOMC mice displayed significantly reduced BODIPY/LC3 colocalization - supporting lipophagy failure (Fig. 6G). In sum, we propose that autophagy in POMC neurons and the ability of these neurons to transduce signals to BAT determine activation of lipophagy in BAT.
Fig. 6. Lipophagy failure in denervated BAT.

(A) One BAT pad in each mouse was denervated (DNV), and DNV and contralateral intact BAT pad were analyzed for autophagy. (B) MBH cannulation, and intra-MBH DMSO or Rap injections for 2 hr and autophagy analyses in intact and DNV BAT from intra-MBH DMSO or Rap-injected mice. (C) Immunoblot (IB) for LC3, and quantification for LC3-II/LC3-I ratios, and net LC3-II flux in intact and DNV BAT from intra-MBH DMSO or Rap-injected 5–6 mo male mice, n=4. (D) qPCR for indicated genes in intact and DNV BAT from intra-MBH Rap-injected 5–6 mo male mice, n=3–5. (E) IB for LC3 and quantification for LC3-II/LC3-I ratios in LD from intact and DNV BAT from intra-MBH DMSO or Rap-injected 5-6 mo male mice (5 BAT pads pooled per sample per experiment, n=2). (F) BODIPY staining in intact and DNV BAT from intra-MBH DMSO or Rap-injected 5–6 mo mice, n=3. (G) Staining for BODIPY and LC3 in BAT from intra-MBH DMSO or Rap-injected 5–6 mo male Con and Atg7KOPOMC mice, n=3. Bars are mean±s.e.m. *P<0.05, **P<0.01, ***P<0.001; Student’s t-test. Ponceau is loading control.
Lipases interact with LC3 at the LD surface
Since cold increased associations of ATGL, HSL and LC3-II with LD (Fig. 1 and Fig. S1C), we explored the possibility that LC3-II engages in direct crosstalk with lipases to achieve maximal lipolysis rates. Extracellular signal-regulated kinase 2 (ERK2) docks on the cytoplasmic face of LC3-II/APh, and this association regulates ERK activity (Martinez-Lopez et al., 2013a). Consequently, we tested whether LC3-II interacts with ATGL and HSL to impact lipolysis, as modeled in Fig 7A.
Fig. 7. LIR motifs on ATGL regulate lipolysis.

(A) Autophagosomes (APh) facilitate localization of ATGL to LD. (B) Immunoblots (IB) for indicated proteins in BAT homogenates (Hom) and LD from intra-MBH DMSO or Rap-injected mice. Quantifications for LC3-II/LC3-I and indicated proteins in LD normalized to PLIN1 are shown (5 BAT pads pooled per sample per experiment, n=2). BAT Hom/LD samples in Fig 5E and Fig 7B originate from the same experiment. (C) Plan for co-immunoprecipitation (IP) from LD fractions. (D) Co-IP of HSL and IB for indicated proteins in BAT LD from RT-housed control mice, n=2. Duplicate samples are shown. Two different LC3 exposures are shown. (E) APh from BAT pooled from 3 cold-exposed mice subjected to LC3 trypsin protection assay, and IB for indicated proteins in Hom and APh fractions, n=2. (F) Point mutations (F147A, V150A) to inactivate LIR motif on ATGL (ΔLIR-ATGL). (G) Direct fluorescence (DF) for mCherry/BODIPY 493/503 in 6 hr (0.25 mM) oleic acid (OA)-treated NIH3T3 cells expressing mCherry-WT-ATGL or ΔLIR-ATGL in absence of serum for 6 hr. White arrows indicate ATGL/BODIPY association. Dotted lines outline transfected cells. (H) DF for mCherry/BODIPY in 6 hr OA-treated NIH3T3 cells expressing mCherry-WT-ATGL or ΔLIR-ATGL in presence/absence of serum for 6 hr. White arrowheads indicate ATGL/BODIPY association. (I) DF for mCherry/BODIPY in 6 hr serum-starved NIH3T3 cells expressing mCherry-WT-ATGL or ΔLIR-ATGL treated with OA −/+ lysosomal inhibitors (Inh) for 6 hr. At least 40 cells analyzed from n=3. Bars: mean±s.e.m. *P<0.05, **P<0.01, ***P<0.001, (#P<0.05, ###P<0.001 compared to panel 1 in F); Student’s t-test. See also Figure S6.
To that purpose, we first analyzed whether activating MBH autophagy via intra-MBH Rap enriched ATGL and HSL in LD. Indeed, intra-MBH Rap led to enrichment of ATGL, phosphorylated-HSL, total HSL, and LC3-II in BAT and liver LD fractions by 20-60% (Fig. 7B, and Fig. S6A). Since LC3-II, ATGL, and HSL co-enrich in LD, we next examined whether lipases interact with LC3 in LD. Cytosolic proteins containing LC3-interacting region (LIR) motifs interact with LC3 (Birgisdottir et al., 2013). A core LIR motif consists of the [W/F/Y]-x1-x2-[L/I/V] sequence (Birgisdottir et al., 2013), and we found that ATGL contains the F (Phe)-type LIR at 145-STFIPV-150, which typically contains V (Val), C (Cys) or I (Ile) at the x1 position (Fig. S6B). Using these guidelines, we identified 3 LIR motifs in ATGL and 7 LIRs each in isoform 1 and 2 of HSL (Fig. S6B). This led to our hypothesis that LC3 associates with lipases via LIR motifs, and these associations determine recruitment of ATGL and/or HSL to LD (Fig. 7A). Indeed, co-immunoprecipitation revealed interaction of HSL with LC3 in LD fractions obtained from sucrose gradient centrifugation of tissue homogenates (Fig. 7C and 7D), and strikingly, activating MBH autophagy via intra-MBH Rap increased the abundance of LC3-HSL co-immunoprecipitates in BAT LD fractions (Fig. S6C).
Lipases dock on the cytoplasmic face of LC3-positive structures
We next determined the topology of interaction of cytosolic lipases with LC3. LC3-II labels outer and inner membranes of APh, and thus non-lysosomal substrates binding to LC3-II are likely to associate with the outer/cytoplasmic face of APh (Fig. 7A), as demonstrated for ERK2 (Martinez-Lopez et al., 2013a). To explore this further, we used the LC3-II protease protection assay (Martinez-Lopez et al., 2013a; Nair et al., 2011) wherein controlled trypsin exposure (15 min) preferentially degrades proteins localized at the exposed cytoplasmic face of APh, while proteins sequestered inside APh are spared (Fig. 7E). Indeed, in accordance with our hypothesis, APh isolated from BAT (Fig. 7E) and liver (Fig. S6D) from cold-exposed mice were enriched in HSL and ATGL, albeit relatively lower amounts of lipases were found in liver-derived APh compared to BAT. Presence of lipases in APh did not reflect cytosolic contamination as confirmed by absence of cytosolic IκB in APh (Fig. 7E and S6D). As anticipated, exposure of BAT or liver APh to trypsin led to greater than 75% loss of HSL and ATGL as opposed to ~50% loss of LC3 in BAT-derived APh (Fig. 7E) and minimal LC3 loss in liver-derived APh (Fig. S6D) when contrasted against trypsin-untreated samples. These findings indicate that lipases dock on the cytoplasmic face of APh, and suggest that LC3-II/APh serves as scaffolds for lipases at the LD.
LIR motif regulates ATGL recruitment and lipolysis
To mechanistically couple LC3 and ATGL in control of lipolysis, we tested whether mutating a single LIR on ATGL hinders its association with LD and blocks lipolysis. To that purpose, we switched F (Phe) and V (Val) to A (Ala) in 145-STFIPV-150 LIR motif in mCherry-wild-type (WT)-ATGL (Fig. 7F), and analyzed the ability of mutant ΔLIR-ATGL to associate with LD and activate lipolysis in vitro.
mCherry-WT-ATGL or mCherry-ΔLIR-ATGL-expressing NIH3T3 cells were cultured in oleic acid-supplemented medium in presence of serum or absence of serum for 6 hr to activate lipolysis. Transfected (mCherry+) and un-transfected controls (mCherry-) were visualized for BODIPY content and for association of WT-ATGL or ΔLIR-ATGL with LD. As anticipated, serum-fed un-transfected cells (lacking WT-ATGL expression) displayed BODIPY-positivity from the supplied oleic acid (Fig. S6E, panels 1 and 2). In WT-ATGL+ cells, ATGL localized around LD resulting in ~50% reduction in BODIPY fluorescence indicating active lipolysis (Fig. S6E, panels 1 and 2). On the other hand, mutant ΔLIR-ATGL+ cells displayed ~2-fold increase in BODIPY staining when compared to un-transfected cells, and ~4-fold increase in BODIPY fluorescence when compared to WT-ATGL+ cells (***p<0.001) indicating defective lipolysis (Fig. S6E, panels 3 and 4; and Fig. S6F, panels 1–3). Increased BODIPY staining in ΔLIR-ATGL+ cells when compared to un-transfected controls suggested that ΔLIR-ATGL exerts a dominant-negative effect on endogenous ATGL.
Similarly, in serum-starved WT-ATGL+ cells, WT-ATGL localized around LD (Fig. 7G; panel 1, white arrows) resulting in decreased BODIPY fluorescence indicating active lipolysis (Fig. 7G, panel 1 and 2). By contrast, serum-starved ΔLIR-ATGL+ cells failed to mobilize LD (Fig. 7G; panels 3 and 4) demonstrating the requirement of the 145-STFIPV-150 LIR motif on ATGL for lipolysis. Since LIR motifs allow proteins to associate with LC3, we predict that LC3-ATGL interaction determines recruitment of ATGL to LD and, hence, its activity. Indeed, serum removal increased WT-ATGL/BODIPY colocalization from ~40% to ~55%, and WT-ATGL+ cells displayed typical doughnut-like circular structures of ATGL around LD (Fig 7H; white arrowheads in panels 1–4). Strikingly, ΔLIR-ATGL remained largely mislocalized in the cell and displayed a diffuse cytoplasmic signal (Fig 7H, panels 5–8). Since ATGL is known to be regulated by its interactions with the endogenous activator CG1-58 (Lass et al., 2006) and inhibitor G(0)/G(1) switch gene 2 (G0S2) (Yang et al., 2010), future studies will determine whether association of LC3 with ATGL modifies its interaction with CGI-58 and/or G0S2.
Lipases and lipophagy display complementarity toward total lipolysis
Cytosolic lipases and lipophagy, each contributes to LD mobilization; however, whether lipases and lipophagy display complementarity toward total lipolysis remains unknown. To test this possibility, WT-ATGL+ or ΔLIR-ATGL+ NIH3T3 cells were maintained in oleic acid-supplemented serum+ or serum-deprived medium for 6 hr. Subsets of these cells were treated with Lys Inh for 6 hr and analyzed for (i) the ability of WT-ATGL+ cells to mobilize LD in the background of lysosomal inhibition, and (ii) the degree of lipid accumulation in ΔLIR-ATGL+ cells when subjected to lysosomal inhibition. As expected, WT-ATGL+ cells decreased their lipid content in both serum-fed (Fig. S6E and S6F) and serum-starved states (Fig. 7G and 7I); however, addition of Lys Inh decreased WT-ATGL-mediated lipid loss in serum-fed (Fig S6F, panels 2 vs. 5, **p<0.01) and serum-deprived cells (Fig 7I, panels 2 vs. 5, ***p=1.5E-04) suggesting that lysosomes modulate ATGL activity, possibly through degradation of LD coat proteins (Kaushik and Cuervo, 2015) that shield LD against lipases. Intriguingly, cells with inactive ATGL (ΔLIR-ATGL+ cells) when co-treated with Lys Inh displayed significantly greater lipid accumulation when compared to ΔLIR-ATGL+ cells per se (Fig. 7I, and Fig. S6F, panels 3 vs. 6) or Lys Inh-treated un-transfected cells per se (Fig. 7I, and Fig. S6F, panels 4 vs. 6). These results show that lipases and lipophagy exhibit complementarity and cooperativity towards total lipolysis, and uncover a previously unappreciated crosstalk between neutral lipases and lipophagy.
Discussion
CNS-to-peripheral autophagy networks control lipid metabolism
Here we show that CNS-to-peripheral autophagy networks control lipid metabolism in BAT/liver. We find that cold activates autophagy in MBH and BAT/liver, and that deleting Atg7 in POMC neurons inhibits cold-induced lipophagy in BAT/liver. Conversely, targeted activation of autophagy in MBH in RT-housed mice is sufficient to drive lipophagy and promote lipid utilization in BAT/liver. This lipid utilization occurs, in part, through lipophagy since inhibiting autophagy or lysosomal function in BAT or liver suppresses CNS autophagy-induced lipid utilization. We reveal that direct neuronal connection links CNS autophagy to peripheral lipophagy, since BAT denervation completely blocks lipophagy/lipid utilization. Thus, we propose that the previously described neuronal circuits that link CNS to liver and fat (Morrison and Madden, 2014) contribute to functional autophagy that maintains lipohomeostasis. Since our studies were carried out in mice, a torpor-prone species, it is possible that the cold-driven CNS-to-periphery autophagy axis represents a mouse-specific, pre-torpor mechanism or that diminished peripheral lipid use in Atg7KOPOMC mice represents a torpor-like state in KO mice. However, our rapamycin studies were carried out in RT-housed mice and these studies provide torpor stimulus-independent support for existence of the proposed “CNS-to peripheral autophagy axis” as a significant regulator of lipohomeostasis in non-torpid species as well. In further support of CNS-to-peripheral autophagy networks controlling lipid metabolism, neuron-derived XBP-1s, a constitutively active form of XBP-1, has recently been shown to activate the endoplasmic reticulum unfolded protein response in distal cells in C. elegans (Taylor and Dillin, 2013).
Role of POMCergic autophagy in lipohomeostasis
The precise function of autophagy in POMC neurons has remained unknown, although blocking POMCergic autophagy has been shown to disrupt axonal development (Coupe et al., 2012), reduce α-MSH levels (Kaushik et al., 2012), and decrease POMC neuronal response to leptin (Quan et al., 2012) independent of neuronal loss. Given the key role of POMC neurons in generation of cold-evoked responses in peripheral tissues, and that of autophagy in cellular quality control and nutrient supply, it is possible that autophagy failure in POMC neurons could prevent sustained neuronal activation required to mount an effective response in peripheral tissues. Our unpublished results in cultured hypothalamic cells (data not shown) indicate that a subset of Atg proteins are leptin responsive and mobilize to specific cellular sites, e.g., trans-Golgi network, wherein maturation of α-MSH-positive secretory vesicles occurs, and that inhibiting a subset of Atg proteins interferes with POMC processing and decreases α-MSH production as previously described in Atg7KOPOMC mice (Kaushik et al., 2012). Given the central role of leptin in POMC expression/α-MSH production, and the permissive role of leptin in BAT thermogenesis (Enriori et al., 2011), it is tempting to speculate that α-MSH availability and active melanocortin signaling couples POMCergic autophagy to cold-driven sympathetic activation and lipid utilization. Indeed, we show here that administering isoproterenol (i.p.) completely restores lipid utilization in BAT in Atg7KOPOMC mice. However, further studies will validate this notion by determining whether central administration of the melanocortin 4 receptor agonist, melanotan II, rescues lipophagy in Atg7KOPOMC mice.
ATGL requires LC3 for its lipolytic activity
We also explored whether LD-associated LC3 plays yet undefined roles in control of lipolysis. Our data suggest that, in addition to its role in lipophagy, LC3 supports ATGL activity. While APh sequester cytoplasmic cargo and deliver these to lysosomes, our published work indicates that the cytoplasmic face of APh serves as a docking site for ERK2 (Martinez-Lopez et al., 2013a). In our present studies, we find that LC3 co-immunoprecipitates with HSL from LD fractions from BAT, and conversely, BAT-derived APh reveal presence of HSL and ATGL. Since LC3-II protease protection assays excluded lipases as autophagic cargo, in our view, HSL and ATGL appear to utilize APh/LC3-II as a membranous platform to efficiently localize to LD. The presence of LC3 interacting region (LIR) motifs on ATGL/HSL suggests a molecular basis for transient associations of lipases with LC3. Indeed, masking a single LIR motif on ATGL disrupted ATGL/BODIPY colocalization and blocked lipolysis. Thus, we propose that regulation of ATGL recruitment and activity requires its interaction with LC3. Our results suggest a model wherein CNS autophagy influences autophagy proteins in peripheral tissues to (i) promote lipid utilization via direct consumption of LD by lipophagy, and to (ii) engage with and recruit lipases to LD. It remains to be clarified whether cytosolic LC3-I or APh-bound LC3-II preferentially regulates lipase recruitment to LD; however, since ATGL, HSL, and ERK2 all co-purify with APh, it is possible that LC3-II-positive membranes serve as scaffolds regulating the recruitment and activity of lipases. In sum, we propose that functional CNS-to-peripheral autophagy networks maintain overall lipohomeostasis, and devising strategies to activate whole body autophagy in a coordinated manner may perhaps prevent the attributes of the metabolic syndrome.
Experimental Procedures
Animals
POMC-specific Atg7 mice were generated by crossing Atg7F/F mice (Komatsu et al., 2006) (Drs. M. Komatsu and K. Tanaka, Tokyo Metropolitan Institute of Medical Science, Japan) with POMC-Cre mice (Jackson Laboratories), respectively. Studies were performed in male and female mice on a C57B6 background using a protocol approved by the Institutional Animal Care and Use Committee. Mice were fed a regular chow (5058; Lab Diet, St Louis, MO, USA) and maintained on 12h light/dark cycles.
Reagents
Antibodies for Atg7, ATGL, LC3B, Serine-555 phospho (P)-ULK1, P-HSL, HSL were from Cell Signaling Technology; Atg5 and ULK1 were from Novus Biologicals; Beclin1 from BD Biosciences; CGI58 from ProSci, Inc,; LAMP1 from Developmental Studies Hybridoma Bank; p62 from Enzo Life Sciences; PLIN2 from ProGen Biotechnik; β-actin, GAPDH, PLIN3, WIPI1 and WIPI2 from Abcam. The following chemicals were used: leupeptin hemisulfate (100–200μM) and ammonium chloride (20mM) from Fisher Scientific. Rapamycin (2 μg per mouse) was from EMD Biosciences.
Autophagy flux assay
Autophagic flux determines LC3-II accumulation in lysosomes when cells are treated with Lys Inh, leupeptin (100 μM) and ammonium chloride (20 mM) (Klionsky et al., 2012). Briefly, freshly collected tissue explants were placed in dishes with high glucose DMEM in presence or absence of Lys Inh and then transferred to a 37°C incubator at 5 % CO2 for 2 hr. For autophagy flux in vivo, mice were injected with leupeptin ip (40 mg/kg body weight). Explants were processed and immunoblotted for LC3. Net autophagy/LC3-II flux was determined by subtracting the densitometric value of Inh-untreated LC3-II from corresponding Inh-treated LC3-II value (Kaushik et al., 2012). LD LC3 was calculated as LC3-II/LC3-I ratio and normalized to GAPDH and PLIN2.
Isolation of LD fractions
LD fraction from mouse liver and BAT were isolated as previously described (Singh et al., 2009). Tissues were homogenized in 0.25 M sucrose and centrifuged at 6,800 g for 5min/4°C. Supernatants including the fatty layer were centrifuged at 17,000 g/10min/4°C to eliminate unwanted cellular fractions. Supernatant from the 17,000 g spin was adjusted to 20% sucrose and centrifuged in a discontinuous sucrose density gradient at 27,000 g for 30 min at 4°C. LD fractions were delipidated using successive washes in acetone and ether and solubilized in 2 % SDS for immunoblotting.
Stereotaxic intra-MBH Rap administration
MBH stereotaxic surgery for cannula placement was performed using ketamine/xylazine. Briefly, a bilateral cannula (Plastics One) was introduced into the MBH (coordinates from bregma: anteroposterior, −1.1 mm; dorsoventral, −5.9 mm; center-center, 0.8mm) as described (Blouet et al., 2009). Animals were rested for 5 days before experimentation. Each mouse was injected with intra-MBH DMSO (100%) or 2 μg Rap: 1μg Rap each side of the 3rd ventricle in 50nl of DMSO over 1 minute. For autophagy in vivo flux in 5–6 mo males, 10 μg leupeptin was injected in DMSO in a total of 200 nl per side for 2 hr, and mice were cold-exposed for 1 hr, n=3.
Plasmids
Transient transfections were performed with Lipofectamine 2000 (Invitrogen) as per the manufacturer’s instructions. ATGL plasmid was a kind gift from Dr. Carole Sztalryd Woodle (University of Maryland School of Medicine), and site-directed mutagenesis was used to introduce F147A and V150A mutations using a commercial kit (Life Technologies).
Statistics
All data are mean±sem and are from a minimum of three independent experiments unless otherwise stated. Statistical significance was compared by two-tailed unpaired Student’s t-test. *P<0.05, **P<0.01, ***P<0.001.
Supplementary Material
Acknowledgments
The authors thank Drs. M. Komatsu and K. Tanaka (Tokyo Metropolitan Institute of Medical Science, Japan) for Atg7F/F mice, Dr. Carole Sztalryd Woodle (University of Maryland School of Medicine) for the ATGL plasmid, and Dr. Flavie Strappazzon (Fondazione Santa Lucia, Rome) for help identifying LIR motifs. This work was supported by DK087776 (RS), AG043517 (RS), Ellison Medical Foundation new scholar award (RS), and DK020541 (Einstein Diabetes Research Center).
Footnotes
The authors have no competing financial interests to declare.
Author information NML performed all experiments and analyzed data. MGM performed stereotaxic cannula implantations. DA prepared hypothalamic slices. EL and SS assisted with in vivo experiments. PM and FC performed site-directed mutagenesis. GJS designed experiments. RS conceived the idea, designed the experiments, analyzed and interpreted data, and wrote the manuscript. All authors discussed/commented on the manuscript.
Publisher's Disclaimer: This is a PDF file of an unedited manuscript that has been accepted for publication. As a service to our customers we are providing this early version of the manuscript. The manuscript will undergo copyediting, typesetting, and review of the resulting proof before it is published in its final citable form. Please note that during the production process errors may be discovered which could affect the content, and all legal disclaimers that apply to the journal pertain.
References
- Belgardt BF, Okamura T, Bruning JC. Hormone and glucose signalling in POMC and AgRP neurons. The Journal of physiology. 2009;587:5305–5314. doi: 10.1113/jphysiol.2009.179192. [DOI] [PMC free article] [PubMed] [Google Scholar]
- Birgisdottir AB, Lamark T, Johansen T. The LIR motif - crucial for selective autophagy. Journal of cell science. 2013;126:3237–3247. doi: 10.1242/jcs.126128. [DOI] [PubMed] [Google Scholar]
- Blouet C, Jo YH, Li X, Schwartz GJ. Mediobasal hypothalamic leucine sensing regulates food intake through activation of a hypothalamus-brainstem circuit. The Journal of neuroscience : the official journal of the Society for Neuroscience. 2009;29:8302–8311. doi: 10.1523/JNEUROSCI.1668-09.2009. [DOI] [PMC free article] [PubMed] [Google Scholar]
- Cannon B, Nedergaard J. Brown adipose tissue: function and physiological significance. Physiological reviews. 2004;84:277–359. doi: 10.1152/physrev.00015.2003. [DOI] [PubMed] [Google Scholar]
- Cao WH, Madden CJ, Morrison SF. Inhibition of brown adipose tissue thermogenesis by neurons in the ventrolateral medulla and in the nucleus tractus solitarius. American journal of physiology. Regulatory, integrative and comparative physiology. 2010;299:R277–290. doi: 10.1152/ajpregu.00039.2010. [DOI] [PMC free article] [PubMed] [Google Scholar]
- Coupe B, Ishii Y, Dietrich MO, Komatsu M, Horvath TL, Bouret SG. Loss of autophagy in pro-opiomelanocortin neurons perturbs axon growth and causes metabolic dysregulation. Cell metabolism. 2012;15:247–255. doi: 10.1016/j.cmet.2011.12.016. [DOI] [PMC free article] [PubMed] [Google Scholar]
- Cowley MA, Smart JL, Rubinstein M, Cerdan MG, Diano S, Horvath TL, Cone RD, Low MJ. Leptin activates anorexigenic POMC neurons through a neural network in the arcuate nucleus. Nature. 2001;411:480–484. doi: 10.1038/35078085. [DOI] [PubMed] [Google Scholar]
- Egan DF, Shackelford DB, Mihaylova MM, Gelino S, Kohnz RA, Mair W, Vasquez DS, Joshi A, Gwinn DM, Taylor R, et al. Phosphorylation of ULK1 (hATG1) by AMP-activated protein kinase connects energy sensing to mitophagy. Science. 2011;331:456–461. doi: 10.1126/science.1196371. [DOI] [PMC free article] [PubMed] [Google Scholar]
- Enriori PJ, Sinnayah P, Simonds SE, Garcia Rudaz C, Cowley MA. Leptin action in the dorsomedial hypothalamus increases sympathetic tone to brown adipose tissue in spite of systemic leptin resistance. The Journal of neuroscience : the official journal of the Society for Neuroscience. 2011;31:12189–12197. doi: 10.1523/JNEUROSCI.2336-11.2011. [DOI] [PMC free article] [PubMed] [Google Scholar]
- He C, Klionsky DJ. Regulation mechanisms and signaling pathways of autophagy. Annual review of genetics. 2009;43:67–93. doi: 10.1146/annurev-genet-102808-114910. [DOI] [PMC free article] [PubMed] [Google Scholar]
- Kabeya Y, Mizushima N, Yamamoto A, Oshitani-Okamoto S, Ohsumi Y, Yoshimori T. LC3, GABARAP and GATE16 localize to autophagosomal membrane depending on form-II formation. Journal of cell science. 2004;117:2805–2812. doi: 10.1242/jcs.01131. [DOI] [PubMed] [Google Scholar]
- Kamada Y, Funakoshi T, Shintani T, Nagano K, Ohsumi M, Ohsumi Y. Tor-mediated induction of autophagy via an Apg1 protein kinase complex. The Journal of cell biology. 2000;150:1507–1513. doi: 10.1083/jcb.150.6.1507. [DOI] [PMC free article] [PubMed] [Google Scholar]
- Kaushik S, Arias E, Kwon H, Lopez NM, Athonvarangkul D, Sahu S, Schwartz GJ, Pessin JE, Singh R. Loss of autophagy in hypothalamic POMC neurons impairs lipolysis. EMBO reports. 2012;13:258–265. doi: 10.1038/embor.2011.260. [DOI] [PMC free article] [PubMed] [Google Scholar]
- Kaushik S, Cuervo AM. Degradation of lipid droplet-associated proteins by chaperone-mediated autophagy facilitates lipolysis. Nature cell biology. 2015;17:759–770. doi: 10.1038/ncb3166. [DOI] [PMC free article] [PubMed] [Google Scholar]
- Kaushik S, Rodriguez-Navarro JA, Arias E, Kiffin R, Sahu S, Schwartz GJ, Cuervo AM, Singh R. Autophagy in hypothalamic AgRP neurons regulates food intake and energy balance. Cell metabolism. 2011;14:173–183. doi: 10.1016/j.cmet.2011.06.008. [DOI] [PMC free article] [PubMed] [Google Scholar]
- Klionsky DJ, Abdalla FC, Abeliovich H, Abraham RT, Acevedo-Arozena A, Adeli K, Agholme L, Agnello M, Agostinis P, Aguirre-Ghiso JA, et al. Guidelines for the use and interpretation of assays for monitoring autophagy. Autophagy. 2012;8:445–544. doi: 10.4161/auto.19496. [DOI] [PMC free article] [PubMed] [Google Scholar]
- Komatsu M, Waguri S, Chiba T, Murata S, Iwata J, Tanida I, Ueno T, Koike M, Uchiyama Y, Kominami E, et al. Loss of autophagy in the central nervous system causes neurodegeneration in mice. Nature. 2006;441:880–884. doi: 10.1038/nature04723. [DOI] [PubMed] [Google Scholar]
- Kovacs KJ. Measurement of immediate-early gene activation- c-fos and beyond. Journal of neuroendocrinology. 2008;20:665–672. doi: 10.1111/j.1365-2826.2008.01734.x. [DOI] [PubMed] [Google Scholar]
- Lass A, Zimmermann R, Haemmerle G, Riederer M, Schoiswohl G, Schweiger M, Kienesberger P, Strauss JG, Gorkiewicz G, Zechner R. Adipose triglyceride lipase-mediated lipolysis of cellular fat stores is activated by CGI-58 and defective in Chanarin-Dorfman Syndrome. Cell metabolism. 2006;3:309–319. doi: 10.1016/j.cmet.2006.03.005. [DOI] [PubMed] [Google Scholar]
- Martinez-Lopez N, Athonvarangkul D, Mishall P, Sahu S, Singh R. Autophagy proteins regulate ERK phosphorylation. Nature communications. 2013a;4:2799. doi: 10.1038/ncomms3799. [DOI] [PMC free article] [PubMed] [Google Scholar]
- Martinez-Lopez N, Athonvarangkul D, Sahu S, Coletto L, Zong H, Bastie CC, Pessin JE, Schwartz GJ, Singh R. Autophagy in Myf5+ progenitors regulates energy and glucose homeostasis through control of brown fat and skeletal muscle development. EMBO reports. 2013b;14:795–803. doi: 10.1038/embor.2013.111. [DOI] [PMC free article] [PubMed] [Google Scholar]
- Morrison SF, Madden CJ. Central nervous system regulation of brown adipose tissue. Comprehensive Physiology. 2014;4:1677–1713. doi: 10.1002/cphy.c140013. [DOI] [PMC free article] [PubMed] [Google Scholar]
- Morrison SF, Madden CJ, Tupone D. Central neural regulation of brown adipose tissue thermogenesis and energy expenditure. Cell metabolism. 2014;19:741–756. doi: 10.1016/j.cmet.2014.02.007. [DOI] [PMC free article] [PubMed] [Google Scholar]
- Mund RA, Frishman WH. Brown adipose tissue thermogenesis: beta3-adrenoreceptors as a potential target for the treatment of obesity in humans. Cardiology in review. 2013;21:265–269. doi: 10.1097/CRD.0b013e31829cabff. [DOI] [PubMed] [Google Scholar]
- Nair U, Thumm M, Klionsky DJ, Krick R. GFP-Atg8 protease protection as a tool to monitor autophagosome biogenesis. Autophagy. 2011;7:1546–1550. doi: 10.4161/auto.7.12.18424. [DOI] [PMC free article] [PubMed] [Google Scholar]
- Quan W, Kim HK, Moon EY, Kim SS, Choi CS, Komatsu M, Jeong YT, Lee MK, Kim KW, Kim MS, et al. Role of hypothalamic proopiomelanocortin neuron autophagy in the control of appetite and leptin response. Endocrinology. 2012;153:1817–1826. doi: 10.1210/en.2011-1882. [DOI] [PubMed] [Google Scholar]
- Singh R, Kaushik S, Wang Y, Xiang Y, Novak I, Komatsu M, Tanaka K, Cuervo AM, Czaja MJ. Autophagy regulates lipid metabolism. Nature. 2009;458:1131–1135. doi: 10.1038/nature07976. [DOI] [PMC free article] [PubMed] [Google Scholar]
- Souza SC, Muliro KV, Liscum L, Lien P, Yamamoto MT, Schaffer JE, Dallal GE, Wang X, Kraemer FB, Obin M, et al. Modulation of hormone-sensitive lipase and protein kinase A-mediated lipolysis by perilipin A in an adenoviral reconstituted system. J Biol Chem. 2002;277:8267–8272. doi: 10.1074/jbc.M108329200. [DOI] [PubMed] [Google Scholar]
- Taylor RC, Dillin A. XBP-1 is a cell-nonautonomous regulator of stress resistance and longevity. Cell. 2013;153:1435–1447. doi: 10.1016/j.cell.2013.05.042. [DOI] [PMC free article] [PubMed] [Google Scholar]
- Tupone D, Madden CJ, Morrison SF. Autonomic regulation of brown adipose tissue thermogenesis in health and disease: potential clinical applications for altering BAT thermogenesis. Frontiers in neuroscience. 2014;8:14. doi: 10.3389/fnins.2014.00014. [DOI] [PMC free article] [PubMed] [Google Scholar]
- Xu AW, Kaelin CB, Takeda K, Akira S, Schwartz MW, Barsh GS. PI3K integrates the action of insulin and leptin on hypothalamic neurons. The Journal of clinical investigation. 2005;115:951–958. doi: 10.1172/JCI24301. [DOI] [PMC free article] [PubMed] [Google Scholar]
- Yang X, Lu X, Lombes M, Rha GB, Chi YI, Guerin TM, Smart EJ, Liu J. The G(0)/G(1) switch gene 2 regulates adipose lipolysis through association with adipose triglyceride lipase. Cell metabolism. 2010;11:194–205. doi: 10.1016/j.cmet.2010.02.003. [DOI] [PMC free article] [PubMed] [Google Scholar]
- Zimmermann R, Strauss JG, Haemmerle G, Schoiswohl G, Birner-Gruenberger R, Riederer M, Lass A, Neuberger G, Eisenhaber F, Hermetter A, et al. Fat mobilization in adipose tissue is promoted by adipose triglyceride lipase. Science. 2004;306:1383–1386. doi: 10.1126/science.1100747. [DOI] [PubMed] [Google Scholar]
Associated Data
This section collects any data citations, data availability statements, or supplementary materials included in this article.