Abstract
Site-selective isotopic labelling of amide carbonyls offers a non-perturbative means to introduce a localized infrared probe into proteins. While this strategy has been widely used to investigate various biological questions, the dependence of the underlying amide I vibrational frequency on electric field (or Stark tuning rate) has not been fully determined, which prevents it from being used in a quantitative manner in certain applications. Herein, through the use of experiments and molecular dynamics simulations, the Stark tuning rate of the amide I vibration of an isotopically labeled backbone carbonyl in a transmembrane α-helix is determined to be approximately 1.4 cm−1/(MV/cm). This result provides a quantitative basis for using this vibrational model to assess local electric fields in proteins, among other applications. For instance, using this value, we are able to show that the backbone region of a dipeptide has a surprisingly low dielectric constant.
Keywords: Stark tuning rate, amide I vibration, membrane electric field, IR probe
The amide I vibrational band of polypeptides, located between 1600–1700 cm−1, arises mainly from the stretching vibration of backbone carbonyls and is one of the most widely used infrared (IR) markers in the study of protein structure and dynamics.[1] This is because it has a large extinction coefficient and is sensitive to various structural determinants and environmental factors.[2] In particular, the amide I vibration of an isotopically labeled backbone carbonyl, such as 13C=16O or 13C=18O, can be used to provide site-specific structural and/or environmental information.[3] Computational studies[4] have shown that the vibrational frequency of a localized amide I mode (i.e., one that does not couple to other amide I vibrations) depends primarily on the local electrostatic field. For example, an electric field map has been developed to calculate the amide I vibrational line shape of peptides.[4a, 4b] Despite being one of the most important properties of the amide I vibration, the vibrational Stark tuning rate (μ), which relates the vibrational frequency shift (Δω) to the electric field (E) via the relationship hcΔω =−μ·E,[5] has, to the best of our knowledge, never been determined experimentally. Using distributed solvatochromic charge analysis on N-methylacetamide (NMA), Cho and coworkers[4c] estimated the value of μ to be 0.78 cm−1/(MV/cm). In a more recent study,[4d] they reported that the dipole contribution dominates the solvatochromic vibrational frequency shift of the carbonyl stretching vibration and the corresponding solvatochromic dipole, which is directly related to the vibrational Stark tuning rate, is of 1.194 cm−1/(MV/cm). Herein, we carried out IR measurements on a series of isotopically labeled transmembrane (TM) α-helices, aiming to provide an experimental assessment of the sensitivity of the amide I vibrational mode to the local electric field.
Quantifying the Stark tuning rate of a specific vibrational mode requires one to measure how its frequency varies with the local electric field strength along the vibrational transition dipole moment of interest. However, there is no simple and straightforward way to do so for a polypeptide. Thus, we chose to measure how the amide I vibrational frequency of an isotopically labeled backbone carbonyl (i.e., 13C=18O) located in a TM α-helix changes with its position in the peptide sequence (see the Supporting Information for the details of peptide synthesis, sample preparation and frequency measurements). This strategy is based on the fact that there is a well-defined electrostatic potential across a symmetric lipid bilayer and that the distance between any two backbone carbonyls in an α-helix can be easily determined. Specifically, we used the peptide LAP (sequence: HHGGPGL(AL)9GPGGHH) and membranes consisting of 1,2-didodecanoyl-sn-glycero-3-phosphocholine (DLPC) or 1-palmitoyl-2-oleoyl-sn-glycero-3-phosphatidylcholine (POPC). Webb and coworkers[6] have shown that LAP forms an α-helix in lipid bilayers and have employed it to determine the electrostatic field of membranes using the nitrile stretching vibration of p-cyanophenylalanine.[7] Because the amino acid sequence of LAP is symmetric, it is expected that the center of this α-helix, i.e. Ala16, is located in the center of the lipid bilayer.
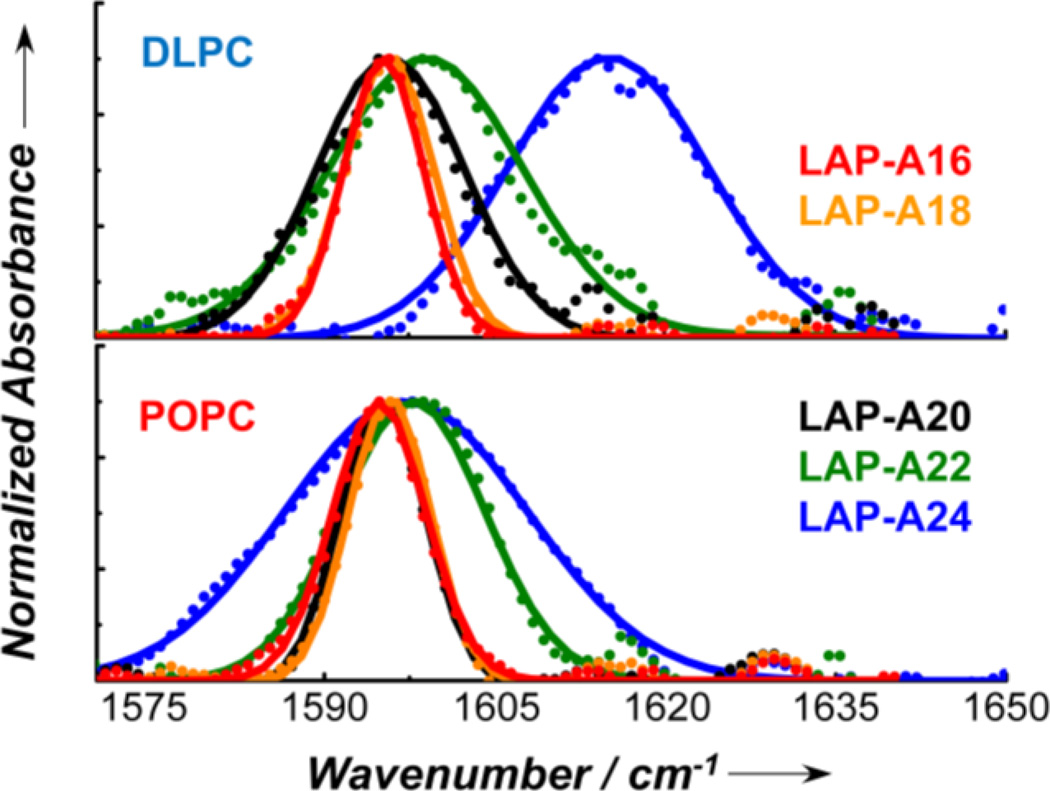
As shown (Figure 1 and Table 1), in both hydrated DLPC and POPC membranes (Figure S1, Supporting Information), the 13C=18O amide I bands obtained with a series of isotopically labeled LAP peptides (hereinafter referred to as LAP-An, where n represents the labeling position) exhibit a clear dependence on the location of the label. For example, the peak frequency of LAP-A16 in DLPC is 1595.3 cm−1, whereas that of LAP-A24 is shifted to 1615.1 cm−1. This shift is consistent with the notion that the amide unit of A24 is located in the charged head group region of the membrane, thus experiencing a larger electric field. While a similar trend is also obtained for POPC, the overall frequency shift is smaller, as the hydrocarbon chain chains of POPC (C18:1 and C16:0) are longer than that of DLPC (C12:0). In addition, the width of the band (i.e., FWHM) increases with increasing n. This trend indicates that upon moving from the center of the TM α-helix (i.e., A16) towards the head group region of the lipid bilayer (i.e., A24), the electrostatic environment experienced by the peptide backbone becomes more and more heterogeneous, as expected.[4b, 8]
Figure 1.
Normalized and baseline corrected (see the Supporting Information) amide I bands (dots) arising from the 13C=18O isotopically labeled carbonyls in LAP-An peptides in DLPC and POPC membranes, as indicated. The solid line in each case corresponds to a fit of the spectrum to a Gaussian function and the resultant peak frequency and bandwidth are given in Table 1.
Table 1.
The experimentally-determined peak frequency (ω), bandwidth (FWHM, from the Gaussian fit), and transition dipole moment angle with respect to the membrane normal of the 13C=18O amide I mode of the LAP-An peptides in DLPC and POPC membranes. Additionally, the distance (rn) of the isotopically labeled amide carbonyl from the center of the lipid bilayer is indicated for each case.
| ω (cm−1) | FWHM (cm−1) | α (deg) | rn (Å) | |||||
|---|---|---|---|---|---|---|---|---|
| DLPC | POPC | DLPC | POPC | DLPC | POPC | DLPC | POPC | |
| LAP-A16 | 1595.3 | 1594.8 | 8.31 | 9.75 | 41.1 | 41.0 | 0 | 0 |
| LAP-A18 | 1595.8 | 1595.8 | 9.19 | 8.19 | 47.2 | 44.7 | 2.15 | 3.17 |
| LAP-A20 | 1596.0 | 1596.1 | 14.2 | 8.63 | 52.0 | 40.4 | 5.12 | 6.34 |
| LAP-A22 | 1599.0 | 1597.3 | 18.8 | 15.0 | 52.9 | 44.2 | 8.26 | 9.52 |
| LAP-A24 | 1615.1 | 1598.2 | 20.7 | 25.0 | 50.7 | 56.1 | 11.5 | 11.3 |
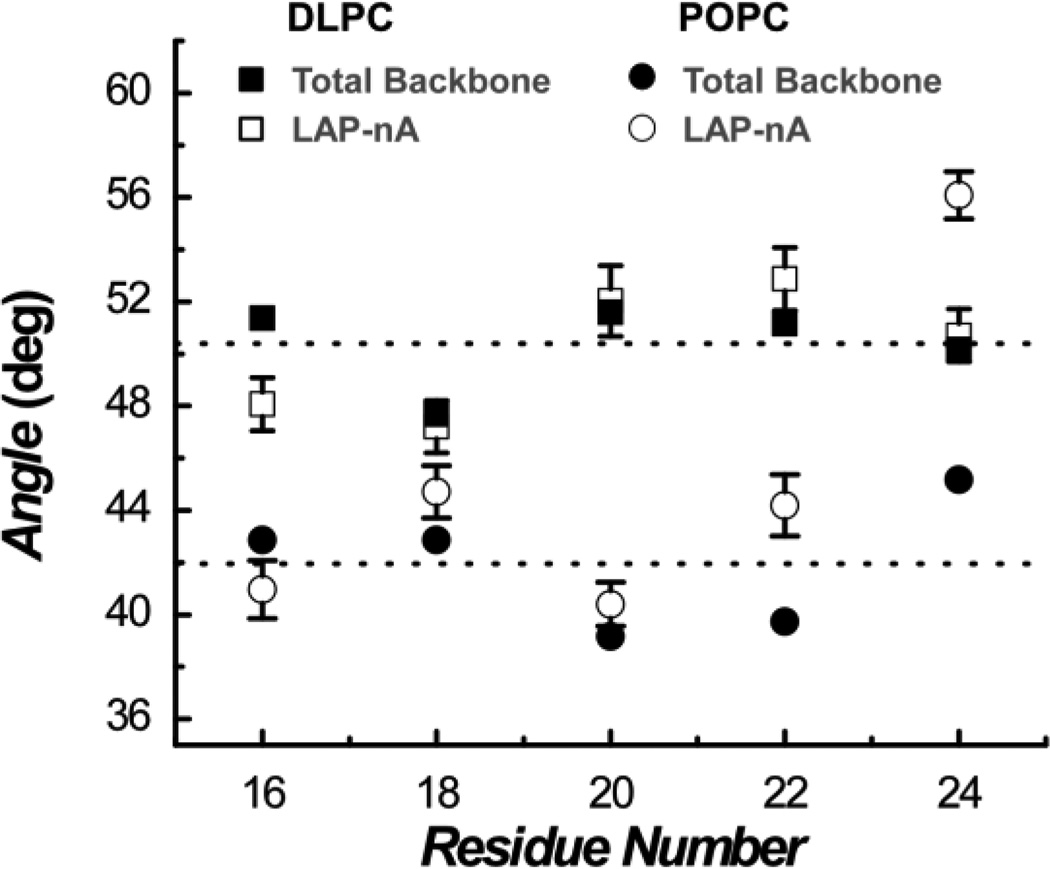
The direction of the membrane dipole electric field is parallel to the membrane normal. Thus, in order to evaluate the local membrane electric field experienced by a specific amide I vibrational mode, one needs to determine the angle between its transition dipole moment and the membrane normal. As shown (Figure 2), the (averaged) overall orientation angle of the peptide backbone, calculated based on the linear dichroic ratio of the main (i.e., unlabeled) amide I band of LAP-An is 50° ± 2.3° for DLPC and 42° ± 3.4° for POPC. This difference, once again, arises from the difference between the hydrocarbon chain lengths of these two lipids, as the longer POPC chain results in a smaller hydrophobic mismatch between the peptide and the membrane and, hence, a smaller helical tilting angle. As indicated (Figure 2), the site-specific orientation angles, determined from the dichroic ratios of the isotopically labeled amide I bands, show a consistent trend.
Figure 2.
Orientation angles of the amide I transition dipole moment, calculated based on the linear dichroic ratios of the labeled and unlabeled amide I bands of LAP-An peptides, as indicated. The detail of the calculation is given in the Supporting Information. The angle determined from the labeled band directly measures the orientation of the underlying transition dipole moment with respect to the membrane normal.
To determine the Stark tuning rate (μ), the experimentally measured frequency shift value for a given site n, i.e., Δωn = ωn − ω16, where ωn corresponds to the peak frequency of the labeled n position, is used. This frequency shift is related to the total electric field (ET) at this site through the following relationship:
| (1) |
where α is the orientation angle discussed above, to account for the fact that the amide I vibrational transition dipole moment is not parallel to the membrane electric field (EM), and ET(n) = EM(n) + EH(n), where EH(n) is the electric field arising from the helix dipole moment. As shown (Figure S2, Supporting Information), the values of EH(n), calculated from the helix dipole moment of LAP, are consistent with previously reported values[9] and are nearly identical for n = 16 – 24. Thus, ΔEH(n) = EH(n) − EH(16) ≈ 0 for n = 16 – 24. In addition, for a symmetric lipid bilayer, as those used in the current case, the membrane electric field is expected to be zero at the center of the bilayer. Thus, ΔEM(n) = EM(n) − EM(16) ≈ EM(n). Because the electric field produced by the membrane dipole potential exhibits an exponential-like decrease with increasing distance from the head group region,[10] we further assumed
| (2) |
where r is defined as the distance from the center of the membrane (Figure 3), β is a constant that is determined by the identity of the lipid, and E*M is the membrane electric field at r*. Taken together, these results indicate
| (3) |
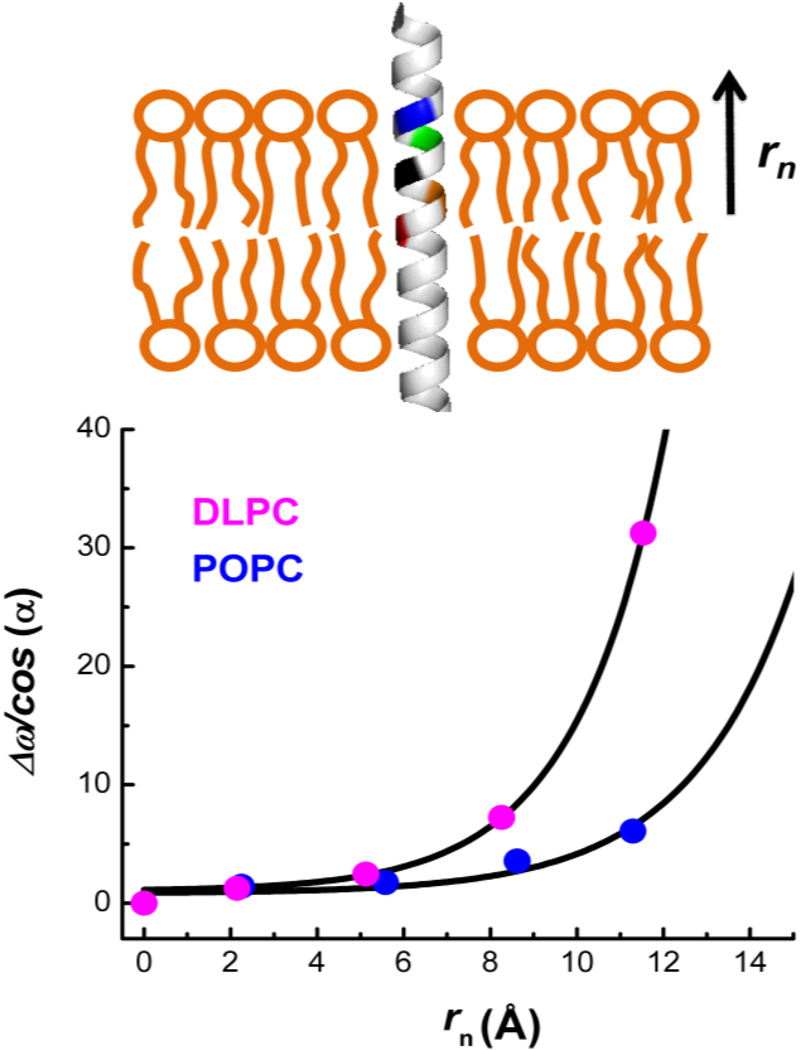
where A = μ•E*M and rn is the distance from the center of the membrane to the midpoint of the labeled site n, which can be calculated based on the helical structure of LAP and its orientation inside the membrane (Table 1 and Supporting Information). In addition, r* is taken to be the thickness of the hydrocarbon core region of a single bilayer leaflet with values of 10.95 Å and 14.60 Å for DLPC and POPC membranes,[11] respectively. Since DLPC and POPC have the same head groups, we also assume that membranes composed of these lipids will have similar E*M values. Therefore, we globally fit the amide I frequency shifts of the LAP-An peptides obtained in both membranes to Eq. (3). As shown (Figure 3), the value of A was determined to be 24.16 cm−1 from this global fitting.
Figure 3.
Upper panel: cartoon representation of the labelled amides (colored segments) and their positions relative to the membrane center. Lower panel: Dependence of Δωn/cos(α) on rn obtained for LAP-An peptides in DLPC and POPC membranes, as indicated. The lines are global fits of these data to Eq. (3), which yielded A = 24.16 cm−1, β = 0.43 Å−1 for DLPC and β = 0.38 Å−1 for POPC.
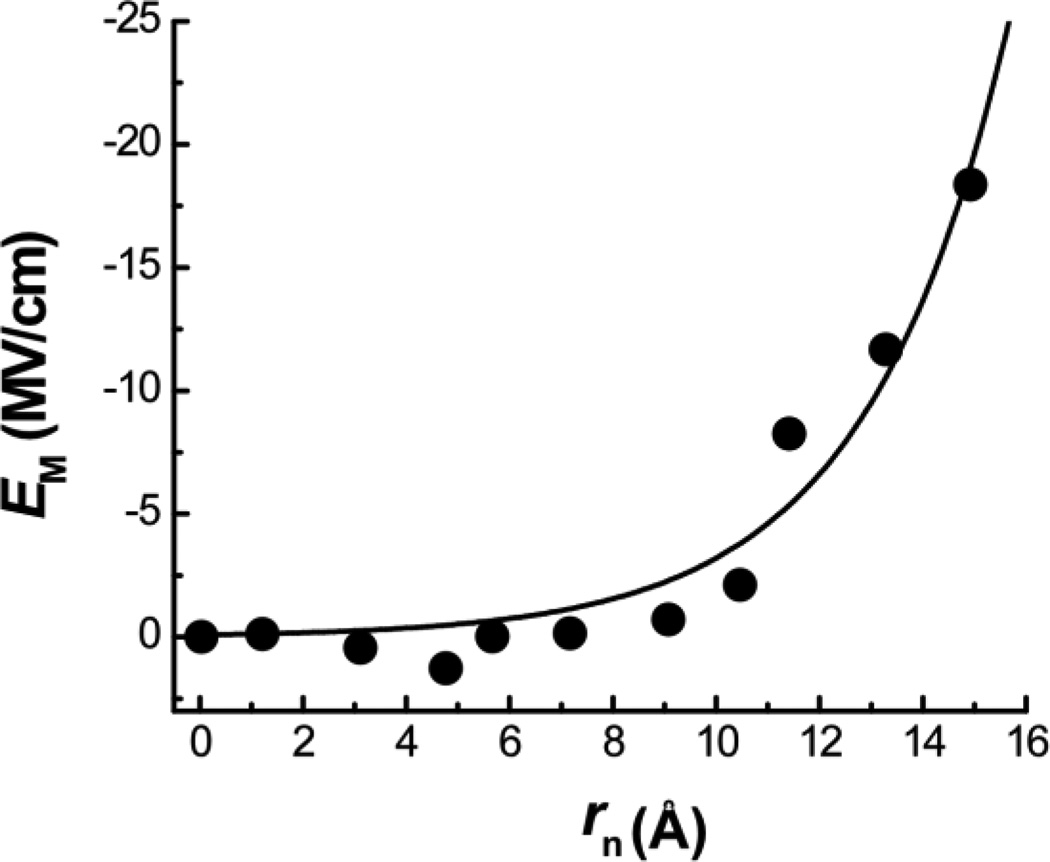
In order to further determine the Stark tuning rate of the amide I vibrational mode, μ, from A = μ•E*M, one needs to know E*M. Webb and coworkers[6b] used the nitrile stretching vibration of p-cyanophenyalanine[12] to assess the magnitudes of membrane dipole fields for different membranes and found that the dipole field is in the range of 8~11 MV/cm for DMPC bilayers. If we were to assume that the E*M of DLPC is similar to that of DMPC, as these two lipids only differ in chain lengths, the Stark tuning rate of the amide I vibrational mode would be in the range of 2.2 – 3.0 cm−1/(MV/cm). This value seems too large, as the Stark tuning rate of carbonyl vibrations is typically within the range of 0.8 – 1.8 cm−1/(MV/cm).[4d, 12] For example, the Stark tuning rate of the C=O stretching vibration of acetophenone was determined to be 1.1 cm−1/(MV/cm).[13] Thus, molecular dynamics (MD) simulations on LAP in POPC bilayers were performed to estimate the value of E*M (Supporting Information). As shown (Figure S3), the average of the orientation angles of the amide I transition dipole moment obtained for positions 16 – 22 is 30.0 ± 4.7°, comparable to those determined experimentally. In addition, the electric field distribution obtained for the amide carbonyls located near the center of the membrane is narrow, whereas that calculated for sites near the lipid head group region is broader, consistent with the experimental observation that the amide I bandwidth of the isotopically labeled LAP-An peptide increases with increasing n (Table 1 and Figure S4 in the Supporting Information). Moreover and perhaps more importantly, the average electric field calculated for each backbone amide carbonyl in the hydrocarbon region of the membrane shows an exponential dependence on its position (i.e., distance from the center of the bilayer) similar to that observed for Δωn/cos(α) (Figure 3). In fact, the MD results can be fit to Eq. (2) with a fixed r* value of 14.60 Å for POPC, yielding an E*M of 17.0 ± 1.5 MV/cm (Figure 4). Using this electric field value and the aforementioned A parameter (24.16 cm−1), we further determined the value of μ to be 1.4 cm−1/(MV/cm).
Figure 4.
Distance dependence of the mean membrane electric field in the hydrocarbon region of a POPC bilayer, calculated via MD simulations (Supporting Information). The line is the fit of these data points to Eq. (2) with E*M = 17.0 MV/cm and β = 0.36 Å−1.
The Stark tuning rate of the amide I vibrational mode determined from the current study is larger than previously estimated. This may stem from the E*M value obtained from the MD simulations, which is known to depend on the force field. Despite this potential pitfall, we believe that the value of 1.4 cm−1/(MV/cm) is a good estimate of the true Stark tuning rate of the amide I vibration. Given the structural similarity between the amide (-CONH-) and ester (–COO-) units, it can be reasonably argued that their C=O stretching vibrations exhibit similar responses toward an external electric field. Recently, Pazos et al.[14] have shown that the ester carbonyl stretching frequency of methyl acetate correlates linearly with solvent electric field with a slope (or μ) of 1.3 cm−1/(MV/cm). Thus, their result provides additional, albeit indirect, support for our conclusion.
In summary, we have combined experimental evidence and MD simulations to quantify the dependence of the amide I vibrational frequency, in the context of a peptide, on local electric field and found that the corresponding proportionality constant is 1.4 cm−1/(MV/cm). We believe that this result provides a quantitative basis for using the amide I vibration of an isotopically labeled backbone carbonyl to site-specifically assess changes in the local electric field in proteins, among other applications. To further substantiate this point, we used the linear infrared (IR) results of Ghosh et al.,[15] which showed that the amide I peak frequency of a histidine (His) residue in a dipeptide (Ac-His-CONHMe) shifts from 1642 to 1650 cm−1 upon the protonation of its imidazole ring. This blueshift indicates that the amide carbonyl of His is pointing away from its sidechain. Based on the Stark tuning rate determined from the current study, this frequency shift corresponds to an electric field change (ΔEE) of approximately 5.6 MV/cm along the direction of the vibrational transition dipole moment. Assuming that the backbone of this dipeptide adopts a PPII conformation, we can further calculate the electric field change (ΔEC) experienced by the His amide I vibrator arising from different rotamers of the protonated His sidechain. As shown (Supporting Information), the calculated ΔEC, depending on the choice of the rotamer, is in the range of 24.9 – 49.0 MV/cm using the permittivity of vacuum. A comparison between ΔEC and ΔEE suggests that the effective dielectric constant in this region of the peptide is 4.4 – 8.8. This result appears to be surprising as the backbone of such a short peptide is supposed to be fully solvated, hence experiencing a high dielectric environment. However, this result is consistent with the 2D IR measurements of Ghosh et al., which indicated that the His amide carbonyl, in this case, is dehydrated. Since knowing the dielectric constant of an environment is essential to accurately describe any electrostatic interactions taking place in this environment, we believe that this example demonstrates the potential utility of using the determined Stark tuning rate of the amide I vibrational mode to extract more quantitative information from relevant IR measurements.
Supplementary Material
Acknowledgements
We thank the National Institutes of Health (P41GM-104605) for financial support.
Footnotes
Supporting information for this article is given via a link at the end of the document.
References
- 1. Krimm S, Bandekar J. Adv. Protein Chem. 1986;38:181–364. doi: 10.1016/s0065-3233(08)60528-8. Surewicz WK, Mantsch HH, Chapman D. Biochemistry. 1993;32:389–394. doi: 10.1021/bi00053a001. Barth A, Zscherp C. Q. Rev. Biophys. 2002;35:369–430. doi: 10.1017/s0033583502003815. Shi Z, Woody RW, Kallenbach NR. Adv. Protein Chem. 2002;62:163–240. doi: 10.1016/s0065-3233(02)62008-x. Serrano AL, Waegele MM, Gai F. Protein Sci. 2011;21:157–170. doi: 10.1002/pro.2006.
- 2. Williams S, Causgrove TP, Gilmanshin R, Fang KS, Callender RH, Woodruff WH, Dyer RB. Biochemistry. 1996;35:691–697. doi: 10.1021/bi952217p. Huang C-Y, Klemke JW, Getahun Z, DeGrado WF, Gai F. J. Am. Chem. Soc. 2001;123:9235–9238. doi: 10.1021/ja0158814. Decatur SM. Acc. Chem. Res. 2006;39:169–175. doi: 10.1021/ar050135f. Ganim Z, Chung HS, Smith AW, DeFlores LP, Jones KC, Tokmakoff A. Acc. Chem. Res. 2008;41:432–441. doi: 10.1021/ar700188n. Bagchi S, Falvo C, Mukamel S, Hochstrasser RM. J. Phys. Chem. B. 2009;113:11260–11273. doi: 10.1021/jp900245s. Remorino A, Korendovych IV, Wu Y, DeGrado WF, Hochstrasser RM. Science. 2011;332:1206–1209. doi: 10.1126/science.1202997. Kim H, Cho M. Chem. Rev. 2013;113:5817–5847. doi: 10.1021/cr3005185.
- 3. Huang R, Kubelka J, Barber-Armstrong W, Silva RAGD, Decatur SM, Keiderling TA. J. Am. Chem. Soc. 2004;126:2346–2354. doi: 10.1021/ja037998t. Brewer SH, Song B, Raleigh DP, Dyer RB. Biochemistry. 2007;46:3279–3285. doi: 10.1021/bi602372y. Ihalainen JA, Paoli B, Muff S, Backus EHG, Bredenbeck J, Woolley GA, Caflisch A, Hamm P. Proc. Natl. Acad. Sci. U.S.A. 2008;105:9588–9593. doi: 10.1073/pnas.0712099105. Culik RM, Serrano AL, Bunagan MR, Gai F. Angew. Chem. Int. Ed. Engl. 2011;50:10884–10887. doi: 10.1002/anie.201104085. Ding B, Laaser JE, Liu Y, Wang P, Zanni MT, Chen Z. J. Phys. Chem. B. 2013;117:14625–14634. doi: 10.1021/jp408064b.
- 4. la Cour Jansen T, Knoester J. J. Chem. Phys. 2006;124:044502. doi: 10.1063/1.2148409. Lin YS, Shorb JM, Mukherjee P, Zanni MT, Skinner JL. J. Phys. Chem. B. 2009;113:592–602. doi: 10.1021/jp807528q. Cho M. J. Chem. Phys. 2009;130:094505. doi: 10.1063/1.3079609. Lee H, Choi J-H, Cho M. J. Chem. Phys. 2012;137:114307. doi: 10.1063/1.4751477. Hayashi T, Zhuang W, Mukamel S. J. Phys. Chem. A. 2005;109:9747–9759. doi: 10.1021/jp052324l. Reppert M, Tokmakoff A. J. Chem. Phys. 2013;138:134116. doi: 10.1063/1.4798938.
- 5. Hush NS, Reimers JR. J. Phys. Chem. 1995;99:15798–15805. Park ES, Andrews SS, Hu RB, Boxer SG. J. Phys. Chem. B. 1999;103:9813–9817. Boxer SG. J. Phys. Chem. B. 2009;113:2972–2983. doi: 10.1021/jp8067393.
- 6. Hu W, Webb LJ. J. Phys. Chem. Lett. 2011;2:1925–1930. Shrestha R, Cardenas AE, Elber R, Webb LJ. J. Phys. Chem. B. 2015;119:2869–2876. doi: 10.1021/jp511677j.
- 7.Waegele MM, Culik RM, Gai F. J. Phys. Chem. Lett. 2011;2:2598–2609. doi: 10.1021/jz201161b. [DOI] [PMC free article] [PubMed] [Google Scholar]
- 8.Manor J, Mukherjee P, Lin Y-S, Leonov H, Skinner JL, Zanni MT, Arkin IT. Structure. 2009;17:247–254. doi: 10.1016/j.str.2008.12.015. [DOI] [PMC free article] [PubMed] [Google Scholar]
- 9.Lockhart DJ, Kim PS. Science. 1992;257:947–951. doi: 10.1126/science.1502559. [DOI] [PubMed] [Google Scholar]
- 10. Wang L. Annu. Rev. Biochem. 2012;81:615–635. doi: 10.1146/annurev-biochem-070110-123033. Gross E, Bedlack JRS, Loew LM. Biophys. J. 1994;67:208–216. doi: 10.1016/S0006-3495(94)80471-0. Ziegler MJ, Vernier PT. J. Phys. Chem. B. 2008;112:13588–13596. doi: 10.1021/jp8027726.
- 11.Kučerka N, Nieh M-P, Katsaras J. Biochim. Biophys. Acta, Biomembr. 2011;1808:2761–2771. doi: 10.1016/j.bbamem.2011.07.022. [DOI] [PubMed] [Google Scholar]
- 12.Ma J, Pazos IM, Zhang W, Culik RM, Gai F. Annu. Rev. Phys. Chem. 2015;66:357–377. doi: 10.1146/annurev-physchem-040214-121802. [DOI] [PMC free article] [PubMed] [Google Scholar]
- 13.Fried SD, Bagchi S, Boxer SG. J. Am. Chem. Soc. 2013;135:11181–11192. doi: 10.1021/ja403917z. [DOI] [PMC free article] [PubMed] [Google Scholar]
- 14.Pazos IM, Ghosh A, Tucker MJ, Gai F. Angew. Chem. Int. Ed. Engl. 2014;53:6080–6084. doi: 10.1002/anie.201402011. [DOI] [PMC free article] [PubMed] [Google Scholar]
- 15.Ghosh A, Tucker MJ, Gai F. J. Phys. Chem. B. 2014;118:7799–7805. doi: 10.1021/jp411901m. [DOI] [PMC free article] [PubMed] [Google Scholar]
Associated Data
This section collects any data citations, data availability statements, or supplementary materials included in this article.


