Abstract
Fluorine NMR paramagnetic relaxation enhancement was evaluated as a versatile approach for extracting distance information in selectively F-labeled proteins. Proof of concept and initial applications are presented for the HIV-inactivating lectin Cyanovirin-N. Single F atoms were introduced at the 4-, 5-, 6- or 7 positions of Trp49 and the 4 position of Phe4, Phe54 and Phe80. The paramagnetic MTSL label was attached to Cys residues that were placed into the protein at positions 50 or 52. 19F-T2 NMR spectra with different relaxation delays were recorded and the transverse 19F-PRE rate, 19F- Γ2, was used to determine the average distance between the F nucleus and the paramagnetic center. Our data show that experimental 19F PRE based distances correspond to ~0.93 of the 1HN-PRE distances, in perfect agreement with the gyromagnetic γ19F/γ1H ratio, thereby demonstrating that 19F PREs are excellent alternative parameters for quantitative distance measurements in selectively F-labeled proteins.
Keywords: fluorine, paramagnetic, NMR, distance, protein
In Paramagnetic Relaxation Enhancement (PRE) NMR experiments the increase in longitudinal or transverse relaxation rates, induced by the presence of a paramagnetic center, is measured. The effect is <r−6> distance dependent, and, as a result, information on the distance between the paramagnetic moiety to the measured nuclei is obtained.
In biomolecular NMR, PREs are increasingly used for providing long-range distance information that complements nuclear Overhauser effect (NOE)-derived, short (≤ 5 Å) interproton distance restraints. In cases where NOE data were found limited, distances derived from PREs provided valuable supplemental restraints and permitted either characterization of the global folds for some proteins,[1,2] or delineate structural properties of disorder proteins.[3,4]
The most widely used spin label, originally developed for EPR studies,[5,6] is the nitroxide radical MTSL (1-oxyl-2,2,5,5-tetramethyl-Δ3-pyrroline-3-methyl)methanethiosulfonate.[7,8] It enhances the transverse relaxation rate (R2) of protons and is introduced into proteins via site specific labeling of cysteine residues.[9–11]
PRE measurements in proteins commonly monitor 1H line broadening or intensity attenuation of proton resonances, caused by R2 relaxation rate enhancements, and these are used to derive distances, with an accessible distance range for the MTSL spin label to protons of 13–25 Å. Resonances of residue in close proximity to the spin label are broadened beyond detection, while for long distances, the effect becomes undetectable.
Importantly, for large proteins and proton detection, the application of the PRE method is fraught with difficulties since resonance overlap may preclude individual effects to be measured accurately. In addition, complete or near-complete assignments have to be available. Therefore, in order to obtain PRE-based structural information for large proteins and protein complexes, other nuclei beyond 1H may represent viable alternatives.
In addition, current strategies to specifically label side chains using biosynthetic amino acid precursors have been proven to offer ideal avenues for solution NMR spectroscopy studies of large proteins.[12–17] However, this method is inherently subject to certain limitations, requiring to specifically and selectively label many different types of methyl groups in several or in the same sample(s).
Although classical 1H, 13C, and 15N spectroscopic approaches have been used extensively to study proteins in solution, 19F NMR is gaining increasing popularity. As discussed previously[18–21] the 100% naturally abundant 19F atom possesses a spin 1/2 nucleus and a high gyromagnetic ratio that results in excellent sensitivity. In addition, 19F is absent from virtually all naturally occurring biomolecules, thus studies of fluorinated proteins do not suffer from any background signals. Several methods to prepare 19F-modified proteins have been described,[22–27] and recently a simple and inexpensive approach, utilizing the fluoroindole precursor for expressing 19F-Tryptophan-containing proteins has been reported.[28]
In the present work we explore 19F PREs for extracting quantitative distance restraints, using the cyanobacterial lectin CV-N as a model system. Two cysteine residues, Cys50 or Cys52, were introduced in solvent accessible positions in the linker region between the two domains for spin-label attachment. PREs were observed on the 19F nucleus, and amide 1HN protons were used as controls. To that end, uniformly 15N labeled protein with site specific fluorination was generated. Two types of fluorine labels were employed: (i) single fluorine atoms were individually incorporated at the 4-, 5-, 6- or 7 positions of the single tryptophan, Trp49, and (ii) all phenylalanines, Phe4, Phe54 and Phe80, were labeled at the 4 positions.
Cyanovirin-N variants were prepared as described previously,[29a,b] using 4, 5, 6, or 7-fluoroindole,28 and 4-F-Phe in the growth medium for fluorine labeling. Proteins were expressed in sufficient quantities for paramagnetic/diamagnetic labeling, and structural models were created using the mtsslWizard in Pymol,[30] based on the wild-type CV-N solution structure [PDB code 2EZM] as the template.
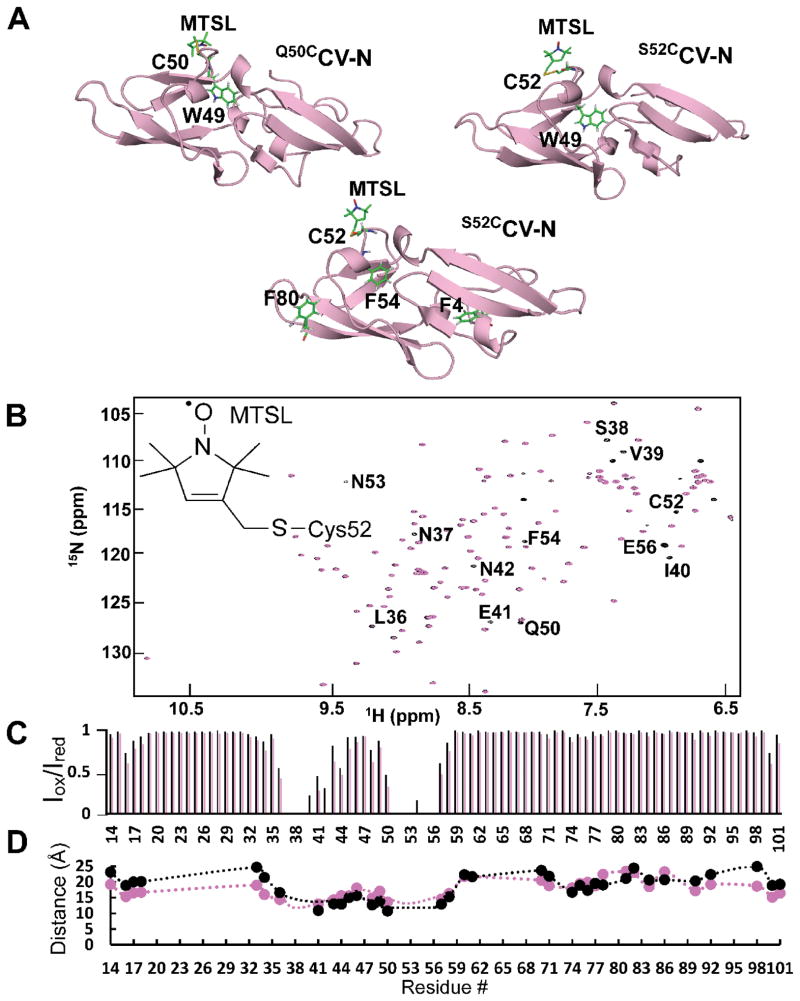
In order to explore a wide range of 19F PREs effects, three different MTSL-tagged systems were created: the Cys50-MTSL modified, 5F-Trp49 CV-N variant (Figure 1A, left), four Cys52-MTSL modified 4F-, 5F-, 6F-, or 7F-Trp49 CV-N variants (Figure 1A, right), and the Cys52-MTSL modified, 4-F Phe4, Phe54 and Phe80 CV-N variants (Figure 1A, center).
Figure 1.
1HN-PREs measured on MTSL-modified S52CCV-N. A. Ribbon representation of Cyanovirin-N variants used for 19F PRE measurements. The Cys50 and Cys52 with the attached MTSL as well as Trp49, Phe4, Phe54 and Phe80, which are fluorine labeled in the various proteins, are shown in stick representation. B. Superposition of 1H-15N HSQC spectra of reduced (black) and oxidized (magenta) uniformly 15N- and spin-labeled S52CCV-N. C. 1HN-PRE signal intensity ratios for oxidized and reduced MTSL-labeled S52CCV-N, using 1 ms (black) and 10 ms (magenta) relaxation delays. D. Distances extracted from 1H-PREs (magenta) and those measured from the molecular model of the MTSL-modified S52CCV-N (black).
1H-15N HSQC spectra of S52CCV-N, MTSL-modified S52CCV-N and wild-type CV-N were compared to ascertain that neither the introduction of the Cys, nor the spin-label perturbed the protein structure in any significant manner (Supporting Information, Figure S1). The chemical shifts of all proteins are essentially identical and only moderate changes were observed for residues in close proximity to the spin-label (Supporting Information, Figure S1).
For MTSL-modified S52CCV-N, 1HN PREs were measured. The superposition of the 1H-15N HSQC spectra of reduced (black) and oxidized (magenta) proteins (Figure 1B) clearly shows severe intensity attenuation of several amide resonances. The equivalent resonances are present with normal intensities in the diamagnetic state (black contours).
The PRE relaxation profile (Iox/Ired vs. residue number) delineates intensity loss for amide resonances of residues in the vicinity of the spin-labeled Cys52 (Figure 1C). Relaxation rates 1HN-Γ2 were extracted from cross-peak intensity ratios in the oxidized and reduced spectra, and distance restraints were derived according to the Solomon-Bloembergen equation,
using a rotational correlation time (τc) of 4.5 ns, based on data available for CV-N in solution.[31]
Distances around the paramagnetic center extracted from 1HN-PREs (magenta) and calculated from the S52CCV-N molecular model (black) are provided Figure 1D, illustrating that the 1HN-Γ2 derived distances are in good agreement with those back-calculated from the MTSL-modified S52CCV-N model structure.
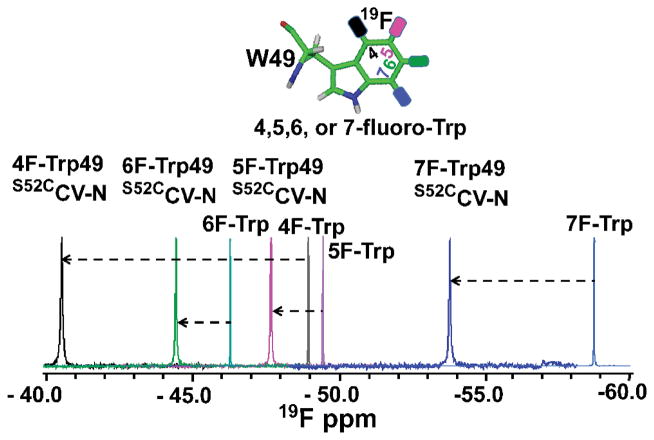
1D 19F-NMR spectra of 4F-, 5F-, 6F-, and 7F-Trp49 labeled S52CCV-N proteins samples as well as for the free 4F-, 5F-, 6F and 7F-Trp amino acids are superimposed in Figure 2. The free amino acid 19F NMR signals are located at −49 ppm, −49.6 ppm, −46.1 ppm, and −58.8 ppm respectively, while the equivalent Trp resonances in the S52CCV-N protein are found at −40.2 ppm, −47.5 ppm, −44.1 ppm, and −53.8 ppm, respectively. All protein resonances are downfield shifted, by varying degrees, compared to the free amino acids, and the largest differences are observed for 4F- (Δδ=9 ppm) and 7F-Trp (Δδ =5 ppm). The overall downfield shifts may arise from the fluorine being embedded into the proteinaceous environment. The most remarkable feature is the wide spread of chemical shifts, which alleviates overlap problems and can be exploited in protein studies.
Figure 2.
Chemical structure and 1D 19F-NMR spectra of 4F-, 5F-, 6F-, 7F-Trp as well as 4F-, 5F-, 6F-, 7F- Trp49 modified S52CCV-N. Chemical shift differences between the free amino acid and the amino acid when incorporated into the S52CCV-N protein are indicated by the dashed lines.
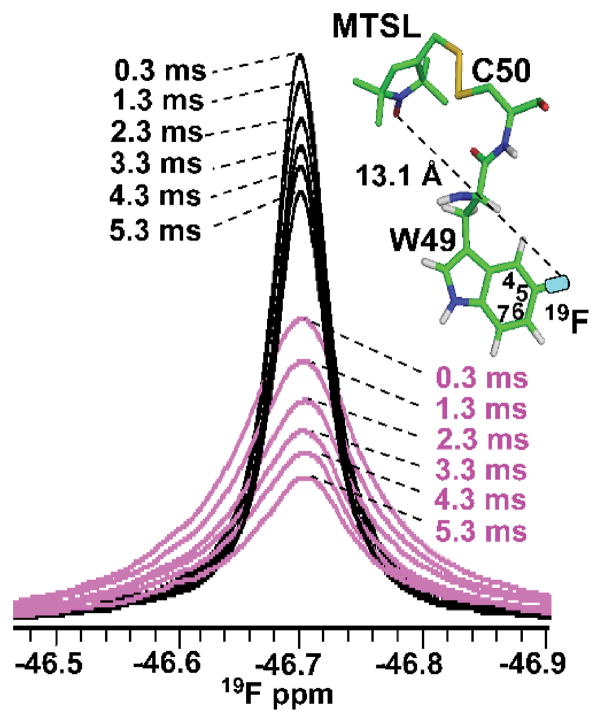
19F-Γ2 relaxation experiments on MTSL-modified, uniformly 15N labeled Q50CCV-N, containing 5F-Trp49 were used to probe the lower PRE based distance limit for fluorine. Resonance intensities, extracted from the oxidized and reduced spectra were converted into paramagnetic relaxation rate enhancements (19F-Γ2). 1D 19F-NMR spectra of oxidized (magenta) and reduced (black) protein, recorded with different relaxation delays (Figure 3, and Figure S2), yielded a fluorine PRE-derived distance between the paramagnetic center attached to Cys50 in Q50CCV-N and the fluorine atom at the 5 position of the Trp49 indole ring of 11.9 Å, in good agreement with the predicted distance (13.1 Å) based on the modelled structure (Table S1).
Figure 3.
19F PREs on 5F-Trp49 in MTSL-modified Q50CCV-N. The 19F-NMR resonance of oxidized (magenta) versus reduced (black) 5F-Trp49 Q50CCV-N is superimposed for 0.3 ms, 1.3 ms, 2.3 ms, 3.3 ms, 4.3 ms and 5.3 ms relaxation delays. The PRE-derived distance is 11.9 ± 0.5 Å and the equivalent distance from the structural model of MTSL-modified Q50CCV-N is 13.1 Å and is shown on the model by a dashed line.
Additional 19F-Γ2 relaxation experiments were carried out on MTSL modified, uniformly 15N labeled S52CCV-N, containing 4F-, 5F-, 6F-, or 7F-Trp49 as the fluorine probe to evaluate more distances.
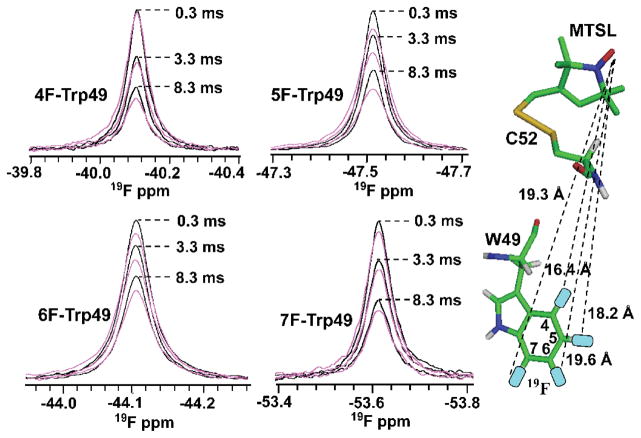
19F-Γ2 relaxation rates were extracted from 1D 19F resonance signal intensity ratios (Iox/Ired) recorded for oxidized (magenta) and reduced (black) spin-label modified S52CCV-N proteins, containing 4F-, 5F-, 6F-, or 7F-Trp49 (Figure 4, and Figure S3). The extracted distances from the PRE data between the paramagnetic center and the 4F-, 5F-, 6F-, and 7F position of Trp49 in S52CCV-N are 15.2 ± 0.9 Å, 16.4 ± 1.2 Å, 19.3 ± 0.9 Å, and 18.6 ±1.4 Å respectively, in excellent agreement with those predicted from the structural model of MTSL-modified S52CCV-N which are 16.4 Å, 18.2 Å, 19.6 Å, and 19.3 Å (Table S1).
Figure 4.
19F PREs of 4F-, 5F-, 6F-, 7F-Trp49 containing MTSL-modified S52CCV-N. The 19F-NMR resonances of oxidized (magenta) versus reduced (black) 4F-, 5F-, 6F-, and 7F-Trp49 S52CCV-N are superimposed for 0.3 ms, 3.3 ms, and 8.3 ms relaxation delays. PRE-derived distances are: 15.2 ± 0.9 Å, 16.4 ± 1.2 Å, 19.3 ± 0.9 Å, and 18.6 ± 1.4 Å, with the equivalent distances from the structural model of MTSL-modified S52CCV-N 16.4 Å, 18.2 Å, 19.6 Å, and 19.3 Å (shown by dashed lines on the model).
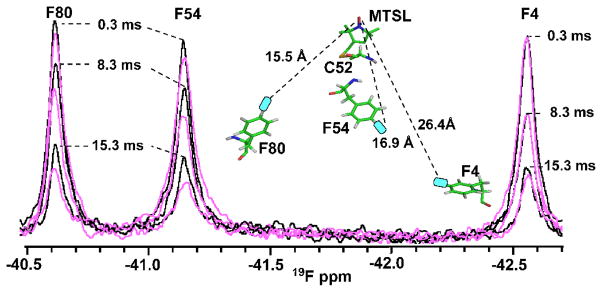
For an estimate of the upper distance limit for fluorine PREs we used uniformly 15N- and 4-fluoro-Phe labeled S52CCV-N protein. Three phenylalanines are present in the protein, Phe4, Phe54 and Phe80. A superposition of oxidized (magenta) and reduced (black) 1D 19F-NMR spectra, recorded with different relaxation delays, is provided in Figure 5.
Figure 5.
19F PREs on 4-F Phe4, 4-F Phe54, and 4-F Phe80 for MTSL-modified S52CCV-N. The 19F-NMR resonances of reduced (black) versus oxidized (magenta) 4-F Phe containing MTSL-modified S52CCV-N are superimposed for 0.3 ms, 8.3 ms, and 15.3 ms relaxation delays. Resonance assignments for Phe4, Phe54 and Phe80 are indicated. The PRE-derived distances are: 23.9 ± 3.1 Å, 16.1 ± 1.4 Å, and 15.7 ± 0.8 Å with the equivalent distances of 26.4 Å, 16.9 Å, and 15.5 Å (shown by dashed lines between the MTSL and the three Phe side chains in the model).
1D-19F Phe4, Phe54 and Phe80 assignment was assessed using S52CCV-N F80A and F54A individual mutants (Supporting Information, Figure S4).
The three distances extracted from the experimentally measured 19F PREs between the paramagnetic center and the fluorine atoms at the 4 positions of Phe4, Phe54 and Phe80 are 23.9 ± 3.1 Å, 16.1 ± 1.4 Å, and 15.1 ± 0.9 Å, respectively, in excellent agreement with those measured from the MTSL S52CCV-N model, which are 26.4 Å, 16.9 Å, and 15.5 Å. Given that all three distances were measured on the same protein, the good agreement reflects the fact that fluorine PRE based distances are of sufficient accuracy to be used as restraints in protein structure determinations.
In summary, we demonstrated that 19F-PRE based distance measurements constitute an excellent alternative to traditional 1HN-PRE based distance extraction. Using CV-N as a model system we tested the methodology with MTSL-tagging at two positions in the protein and placement of fluorine at several positions, around the indole ring of Trp49, as well as in three Phe residues. In agreement with expectation, based on the gyromagnetic γ19F/γ1H ratio, 19F-PRE based distances can be measured over the 12 Å – 24 Å range, which corresponds to ~0.93 of the 1HN-PRE distance range (13 Å – 25 Å). We suggest that the largest advantage of using 19F PRE-based distance measurements over proton PREs is the fact that spectral overlap does not impede their extraction and that any specific distances can be targeted by judicious placement of the MTSL label as well as the fluorine atom(s). This will be particularly beneficial for large proteins, protein complexes or membrane proteins.
Supplementary Material
Acknowledgments
Mike Delk is acknowledged for NMR technical support and Rieko Ishima for insightful discussions. Andrew Zheng helped in the 1HN-PRE data analysis. This work was supported by National Institutes of Health Grant RO1GM080642 (to A.M.G.).
Footnotes
Supporting information for this article is given via a link at the end of the document.
References
- 1.Battiste JL, Wagner G. Biochemistry. 2000;39:5355–5365. doi: 10.1021/bi000060h. [DOI] [PubMed] [Google Scholar]
- 2.Liang B, Bushweller JH, Tamm LK. J Am Chem Soc. 2006;128:4389–4397. doi: 10.1021/ja0574825. [DOI] [PMC free article] [PubMed] [Google Scholar]
- 3.Eliezer D. Meth Mol Biol. 2012;895:127–138. doi: 10.1007/978-1-61779-927-3_10. [DOI] [PMC free article] [PubMed] [Google Scholar]
- 4.Theillet FX, Binolfi A, Liokatis S, Verzini S, Selenko P. J Biomol NMR. 2011;51(4):487–495. doi: 10.1007/s10858-011-9577-2. [DOI] [PubMed] [Google Scholar]
- 5.Hubbell WL, Cafiso DS, Altenbach C. Nat Struct Biol. 2000;7:735–739. doi: 10.1038/78956. [DOI] [PubMed] [Google Scholar]
- 6.Todd AP, Cong J, Levinthal F, Levinthal C, Hubbell WL. Proteins. 1989;6:294–305. doi: 10.1002/prot.340060312. [DOI] [PubMed] [Google Scholar]
- 7.Bermejo GA, Strub MP, Ho C, Tjandra N. J Am Chem Soc. 2009;131:9532–9537. doi: 10.1021/ja902436g. [DOI] [PMC free article] [PubMed] [Google Scholar]
- 8.Volkov AN, Worrall JAR, Holtzmann E, Ubbink M. Proc Natl Acad Sci USA. 2006;103:18945–18950. doi: 10.1073/pnas.0603551103. [DOI] [PMC free article] [PubMed] [Google Scholar]
- 9.Berliner LJ, Grünwald J, Hankovszky HO, Hideg K. Anal Biochem. 1982;119:450–455. doi: 10.1016/0003-2697(82)90612-1. [DOI] [PubMed] [Google Scholar]
- 10.Tang C, Schwieters CD, Clore GM. Nature. 2007;449:1078–1082. doi: 10.1038/nature06232. [DOI] [PubMed] [Google Scholar]
- 11.Clore GM, Iwahara J. Chem Rev. 2009;109:4108–4139. doi: 10.1021/cr900033p. [DOI] [PMC free article] [PubMed] [Google Scholar]
- 12.Gardner KH, Kay LE. J Am Chem Soc. 1997;119:7599–7600. [Google Scholar]
- 13.a) Tugarinov V, Kay LE. J Biomol NMR. 2004;28:165–172. doi: 10.1023/B:JNMR.0000013824.93994.1f. [DOI] [PubMed] [Google Scholar]; b) Lichtenecker R, Ludwiczek ML, Schmid W, Konrat R. J Am Chem Soc. 2004;126:5348–5349. doi: 10.1021/ja049679n. [DOI] [PubMed] [Google Scholar]
- 14.Ayala I, Sounier R, Usé N, Gans P, Boisbouvier J. J Biomol NMR. 2009;43:111–119. doi: 10.1007/s10858-008-9294-7. [DOI] [PubMed] [Google Scholar]
- 15.Gelis I, Bonvin AM, Keramisanou D, Koukaki M, Gouridis G, Karamanou S, Economou A, Kalodimos CG. Cell (Cambridge, Mass) 2007;131:756–769. doi: 10.1016/j.cell.2007.09.039. [DOI] [PMC free article] [PubMed] [Google Scholar]
- 16.Gans P, Hamelin O, Sounier R, Ayala I, Dura MA, Amero CD, Noirclec-Savoye M, Franzetti B, Plevin MJ, Boisbouvier J. Angew Chem Int Ed. 2010;49:1958–1962. doi: 10.1002/anie.200905660. [DOI] [PubMed] [Google Scholar]
- 17.Ayala I, Hamelin O, Amero CD, Pessey O, Plevin MJ, Gans P, Boisbouvier J Chem Commun. 2012;48:1434–1436. doi: 10.1039/c1cc12932e. [DOI] [PubMed] [Google Scholar]
- 18.Danielson MA, Falke JJ. Annu Rev Biophys Biomol Struct. 1996;25:163–195. doi: 10.1146/annurev.bb.25.060196.001115. [DOI] [PMC free article] [PubMed] [Google Scholar]
- 19.Gerig JT. Prog NMR Spectrosc. 1994;26:293–370. [Google Scholar]
- 20.Horst R, Liu JJ, Stevens RC, Wüthrich K. Angew Chem Int Ed. 2013;52:10762–10765. doi: 10.1002/anie.201305286. [DOI] [PMC free article] [PubMed] [Google Scholar]
- 21.Didenko T, Liu JJ, Horst R, Stevens RC, Wüthrich K. Curr Opin Struct Bio. 2013;23:740–747. doi: 10.1016/j.sbi.2013.07.011. [DOI] [PMC free article] [PubMed] [Google Scholar]
- 22.Cellitti SE, Jones DH, Lagpacan L, Hao X, Zhang Q, Hu H, Brittain SM, Brinker A, Caldwell J, Bursulaya B, Spraggon G, Brock A, Ryu Y, Uno T, Schultz PG, Geierstanger BH. J Am Chem Soc. 2008;130:9268–9281. doi: 10.1021/ja801602q. [DOI] [PMC free article] [PubMed] [Google Scholar]
- 23.Frieden C, Hoeltzli SD, Bann JG. Meth Enzymol. 2004;380:400–415. doi: 10.1016/S0076-6879(04)80018-1. [DOI] [PubMed] [Google Scholar]
- 24.Hortin G, Boime I. Meth Enzymol. 1983;96:777–784. doi: 10.1016/s0076-6879(83)96065-2. [DOI] [PubMed] [Google Scholar]
- 25.Kitevski-LeBlanc JL, Prosser RS. Prog Nucl Magn Reson Spectrosc. 2012;62:1–33. doi: 10.1016/j.pnmrs.2011.06.003. [DOI] [PubMed] [Google Scholar]
- 26.Jackson JC, Hammill JT, Mehl RA. J Am Chem Soc. 2007;129:1160–1166. doi: 10.1021/ja064661t. [DOI] [PubMed] [Google Scholar]
- 27.Sykes BD, Hull WE. Meth Enzymol. 1978;49:270–295. doi: 10.1016/s0076-6879(78)49015-9. [DOI] [PubMed] [Google Scholar]
- 28.Crowley PB, Kynea C, Monteith WB. Chem Commun. 2012;48:10681–10683. doi: 10.1039/c2cc35347d. [DOI] [PubMed] [Google Scholar]
- 29.a) Matei E, Zheng A, Furey W, Rose J, Aiken C, Gronenborn AM. J Biol Chem. 2010;285:13057–13065. doi: 10.1074/jbc.M109.094938. [DOI] [PMC free article] [PubMed] [Google Scholar]; b) Matei E, Furey W, Gronenborn AM. Structure. 2008;16:1183–1194. doi: 10.1016/j.str.2008.05.011. [DOI] [PMC free article] [PubMed] [Google Scholar]
- 30.Hagelueken G, Ward R, Naismith JH, Schiemann O. Appl Magn Reson. 2012;42:377–391. doi: 10.1007/s00723-012-0314-0. [DOI] [PMC free article] [PubMed] [Google Scholar]
- 31.Yang F, Bewley CA, Louis JM, Gustafson KR, Boyd MR, Gronenborn AM, Clore GM, Wlodawer A. J Mol Biol. 1999;288:403–412. doi: 10.1006/jmbi.1999.2693. [DOI] [PubMed] [Google Scholar]
Associated Data
This section collects any data citations, data availability statements, or supplementary materials included in this article.


