

Summary
TCD (transcranial doppler) With Transfusions Changing to Hydroxyurea (TWiTCH) trial is a randomized, open-label comparison of hydroxycarbamide (also termed hydroxyurea) versus continued chronic transfusion therapy for primary stroke prevention in patients with sickle cell anaemia (SCA) and abnormal TCD. Severity and location of iron overload is an important secondary outcome measure. We report the baseline findings of abdominal organ iron burden in 121 participants. At enrolment, patients were young (9.8 ± 2.9 years), predominantly female (60:40), and previously treated with transfusions (4.1 ± 2.4 years) and iron chelation (3.1 ± 2.1 years). Liver iron concentration (LIC; 9.0 ± 6.6 mg/g dry weight) and serum ferritin were moderately elevated (2696 ± 1678 μg/l), but transferrin was incompletely saturated (47.2 ± 23.6%). Spleen R2* was 509 ± 399 Hz (splenic iron ∼13.9 mg/g) and correlated with LIC (r2 = 0.14, p=0.0008). Pancreas R2* was increased in 38.3% of patients but not to levels associated with endocrine toxicity. Kidney R2* was increased in 80.7% of patients; renal iron correlated with markers of intravascular haemolysis and was elevated in patients with increased urine albumin-creatinine ratios. Extra-hepatic iron deposition is common among children with SCA who receive chronic transfusions, and could potentiate oxidative stress caused by reperfusion injury and decellularized haemoglobin.
Keywords: Iron overload, sickle cell anaemia, sickle cell radiology, MRI, transfusions
Introduction
Stroke remains one of the most devastating complications to occur in children with sickle cell anaemia (SCA), with serious motor, neurocognitive and psychological sequelae. With the advent of regular Transcranial Doppler (TCD) screening, many children at risk for stroke are identified early and begin chronic transfusion therapy, which has markedly improved stroke-free survival in this vulnerable patient population (Armstrong-Wells et al, 2009;Bernaudin et al, 2011;Enninful-Eghan et al, 2010). However, chronic transfusion therapy for primary stroke prevention must be continued indefinitely, and is associated with a variety of problems for both patients and providers, such as expense, disruption of school and work schedules, ongoing venous access, risk of infection, erythrocyte alloimmunization and transfusion-acquired iron overload that requires tedious and expensive iron chelation therapy(Abboud et al, 2011;Adams and Brambilla 2005).
An alternative to chronic transfusion therapy for children at risk for primary stroke would represent an improvement in their long-term management. The TCD With Transfusions Changing to Hydroxyurea (TWiTCH) trial is a 2-year, randomized, open-label comparison of hydroxycarbamide (also termed hydroxyurea) versus continued chronic transfusion therapy in patients with abnormal TCD (ClinicalTrials.gov NCT 01425307). The primary outcome of the multicentre TWiTCH trial is non-inferiority of hydroxycarbamide to transfusion therapy with respect to TCD velocities. Secondary outcomes include neurological events, sickle cell-related events, changes in liver iron concentration (LIC), and quality of life. Study subjects randomized to the Standard Treatment Arm receive monthly erythrocyte transfusions along with chelation therapy for transfusional iron overload, while those randomized to the Alternative Treatment Arm receive hydroxycarbamide along with serial phlebotomy therapy to lower iron stores. In addition to LIC, all patients in the TWiTCH trial undergo abdominal MRI for R2* iron quantification in other organs, such as the spleen, pancreas and kidney. To date, there are few data regarding the extent and patterns of extra-hepatic deposition of iron in patients with SCA on chronic transfusion therapy. This manuscript reports the baseline amounts of iron within the liver and other abdominal organs, and provides predictors and physiological correlates of extra-hepatic iron deposition in this patient population.
Methods
The TWiTCH study was approved by Cincinnati Children's Hospital Medical Centre as the Institutional Review Board (IRB) of record, as well as all local IRBs and the Data Safety Monitoring Board. All patients and parents provided informed consent, with assent as required locally by age. A total of 24 centres in the US and one in Canada enrolled patients into TWiTCH; 21 of these sites were able to collect abdominal R2* data. A total of 159 patients enrolled in the screening phase of the study; 124 TWiTCH enrolees had screening R2* studies, and 121 of those had valid LIC R2* values (120 pancreas R2*, 119 renal R2*, and 81 spleen R2*), which form the basis for this report.
Abdominal R2* measurements were collected using multiple gradient echo pulse sequences on 1.5 Tesla Magnets (General Electric, 32 examinations; Philips, 15 examinations; Siemens, 74 examinations) using phase array torso or body coils. Imaging parameters varied across machines with the guidelines for liver and spleen R2* parameters described in Table I; pancreas and kidney R2* acquisitions were identical except for target slice thickness of 5-6 mm. Liver and spleen R2* were calculated from three contiguous axial slices(Brewer et al, 2009). Kidney R2* was measured in both the left and right kidney from two contiguous coronal slices(Schein et al, 2008). Pancreas R2* was estimated from 3 contiguous axial slices(Noetzli et al, 2011). All R2* images were analysed centrally at Children's Hospital Los Angeles by a single experienced observer. Each organ was partitioned into sub-regions of similar iron burden; signal decay from each sub-region was fitted to an exponential plus a constant offset as previously described(Meloni et al, 2013).
Table I. Imaging Parameters for all 121 baseline abdominal MRI R2* examinations SNR, signal-to-noise ratio.
| Parameter | Target | Actual (mean ± SD) |
|---|---|---|
| Field of View (mm) | 280-420 | 354.4 ± 35.6 |
| Phase Field of View (%) | 60-100% | 78.7 ± 12.0 |
| Slice Thickness (mm) | 8-12 | 9.6 ± 1.2 |
| In-plane Resolution (mm) | 2-6 | 3.0 ± 0.7 × 3.3 ± 0.8 |
| Number of echoes | > 12 | 13.5 ± 2.6 |
| Shortest echo time (ms) | < 1.2 | 1.10 ± 0.19 |
| Echo spacing (ms) | < 1.5 | 1.05 ± 0.31 |
| Bandwidth (Hz/px) | > 600 | 1741 ± 761 |
| Repetition time (ms) | 97.5 ± 25.9 | |
| Points in frequency direction | 118.0 ± 15.8 | |
| Frequency direction sampling | 120.8 ± 21.7 | |
| Relative SNR metric 1 | 2.4 ± 1.7 |
Predictors and functional correlates of abdominal organ R2* measurements were assessed using univariate and multivariate regression. Log transformation of the R2* measurements was used to improve normality. Predictors included age, sex, years of transfusion therapy, years of chelation, chelator type in the previous year, presence/absence of a spleen and LIC, as well as baseline laboratory parameters including serum ferritin, haemoglobin concentration, C reactive protein (CRP), lactate dehydrogenase (LDH), reticulocyte count and total bilirubin. Functional correlates included systolic and diastolic blood pressure, creatinine, estimated glomerular filtration rate (eGFR) using the Schwartz formula(Schwartz et al, 1976), screening TCD velocity, brain magnetic resonance angiography (MRA) vasculopathy scores(Helton et al, 2014), spleen volume and texture by ultrasound, %Haemoglobin S, platelet count, white blood cell count, serum iron, total iron binding capacity, alanine aminotransferase and transferrin saturation. Variables with near-significant (p<0.10) univariate correlations with organ iron results were further evaluated in multivariate regression models. All statistics were performed by the TWiTCH Data Coordinating Centre (University of Texas Health Science Center, Houston, TX, USA).
Results
Figure 1 illustrates typical imaging quality and representative regions of interest obtained in this study. Liver iron was quantifiable in 121 of 124 examinations; reasons for rejection included lack of necessary MRI acquisition software, noncompliance with imaging parameters, or Digital Imaging and Communications in Medicine (DICOM) incompatibility. Spleens were anatomically absent in 35 patients. Pancreas R2* quantitation was challenging in younger patients who were unable to breath-hold, and was rejected in several patients because of proximity to gastric air (Figure 2), which spuriously increased R2* values in the 40-80 Hz range.
Figure 1.
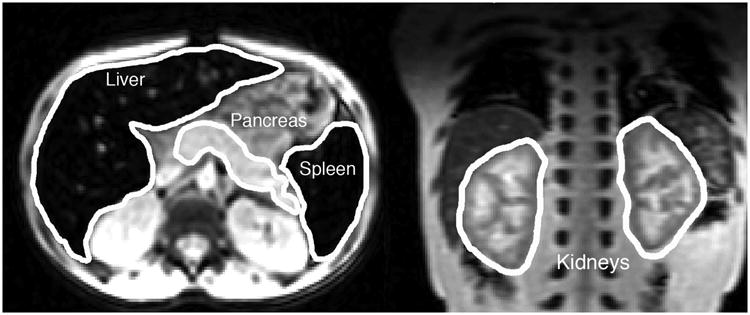
(Left) Representative transverse slice from the T2* acquisition with the liver, spleen and pancreas outlined. Iron has caused the liver and spleen to appear quite dark relative to the other abdominal tissues. (Right) Representative coronal slice demonstrating typical pattern of cortical darkening caused by filtered haemoglobin depositing in the proximal and distal tubules of the kidney.
Figure 2.
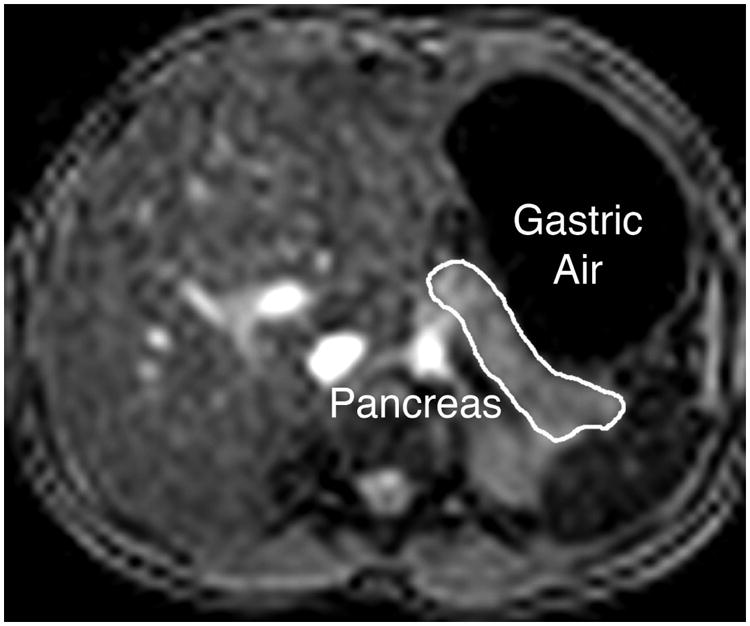
Illustration of close proximity of gastric air to pancreas in some patients; this caused artifactual increases in pancreas R2* in four patients.
Baseline demographics of the study population are summarized in Table II, and illustrates that the TWiTCH subjects were young with a 60/40 female predominance. Chronic transfusion exposure averaged 4.1 years, with evidence of transfusional iron overload, including an average serum ferritin of 2696 μg/l and average LIC of 9.0 mg/g dry weight of liver, which is consistent with several years of transfusions with parenchymal iron deposition. More than 95% of the subjects were already receiving iron chelation, almost exclusively with the oral iron chelator deferasirox.
Table II. Patient Characteristics for the baseline abdominal R2* magnetic resonance imaging cohort.
| Parameter | Mean ± SD |
|---|---|
| N | 121 |
| Age at enrollment (years) | 9.8 ± 2.9 |
| Sex (% male) | 40.0 |
| Body mass index (kg/m2) | 17.8 ± 3.8 |
| Time on transfusion (years) | 4.1 ± 2.4 |
| On chelation therapy (%) | 95.3% |
| Years on chelation (years) | 3.1 ± 2.1 |
| Haemoglobin (g/l)* | 78 ± 8.0 |
| HbS % | 28.5 ± 9.9 |
| Absolute reticulocyte count (×109/l) | 354 ± 123 |
| Serum ferritin (μg/l) | 2696 ± 1678 |
| Serum iron (μmol/l) | 26.2± 10.8 |
| Total iron binding capacity (μmol/l) | 66.1 ± 40.6 |
| Transferrin saturation (%) | 47.2 ± 23.6 |
| Lactate dehydrogenase (u/l) | 599 ± 213 |
| C-reactive protein (mg/l) | 4.8 ± 8.4 |
| Alanine transaminase (u/l) | 48.0 ± 42.2 |
| Creatinine (μmol/l) | 35.4 ± 13.3 |
| Bilirubin (μmol/l) | 47.9 ± 30.8 |
Pre-transfusion haemoglobin in the past 6 months
Table III compares the organ iron burden within the liver to other abdominal organs, and provides evidence of substantial and widespread iron accumulation for most children enrolled in TWiTCH. Spleen iron deposition was present in 100% of participants with splenic tissue. The average splenic R2* value corresponds to an equivalent iron concentration of 13.9 mg/g dry weight, which was actually higher than the corresponding LIC value for each child(Brewer et al, 2009). There was a significant correlation between hepatic and splenic iron measurements (r=0.37, p=0.0009, Figure 3). Liver iron trended lower in patients with MRI detectable spleens (8.1 ± 5.3 versus 11.2 ± 8.8 mg/g dry weight, p=0.11), suggesting that loss of the splenic iron depot may increase hepatic iron loading.
Table III.
Baseline organ iron burden in TWiTCH as assessed by abdominal R2*. Pancreas, kidneyand spleen values are expressed in Hertz; liver iron concentration (LIC) is not expressed in Hertz because the scale factors are not exactly known.
| Organ | N | Mean ± SD [Range] | Normal Range | Percentage Abnormal | Percentage Mild |
|---|---|---|---|---|---|
| LICR2* (mg/g) | 121 | 9.0 ± 6.6 [1.5, 38.6] | < 1.3 | 100% | 47.9% (≤ 7 mg/g) |
| Pancreas R2* (Hz) | 120 | 28.9 ± 8.9 [19, 73.9] | < 28.1 | 38.3% | 38.3% (< 100 Hz) |
| Kidney R2* (Hz) | 119 | 80.6 ± 63.7 [13.3, 396.8] | < 32 | 80.7% | Not defined |
| Spleen R2* (Hz) | 81 | 509 ± 399 [52, 1782] | < 35 | 100% | Not defined |
Figure 3.
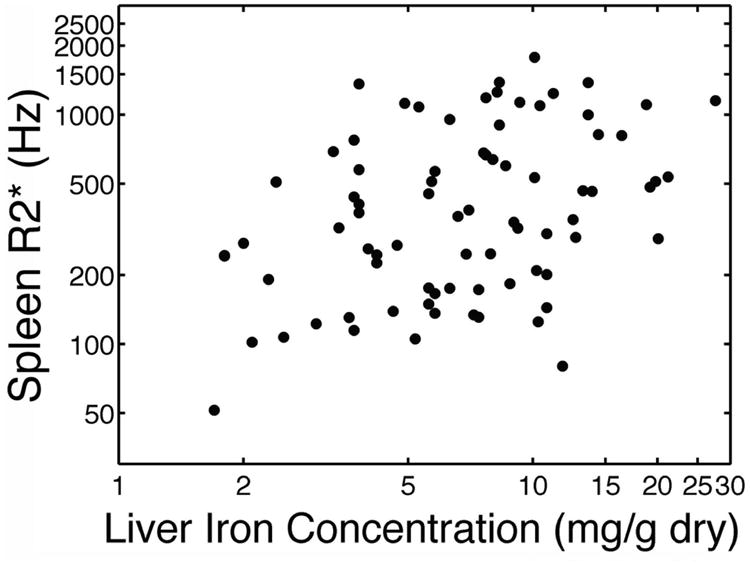
Scattergram depicting splenic R2* versus liver iron concentration. Both axes have a logarithmic scale.
Table IV provides the univariate correlations of selected predictors with abdominal organ iron measures. Predictors with p values < 0.10 were further investigated in multivariate models (Table V). For the spleen R2* measurement, LIC was the strongest predictor (Figure 1). Age, blood pressure, years of transfusion therapy, pre-enrolment haemoglobin, haemoglobin at enrolment, absolute reticulocyte count (ARC), serum ferritin, CRP, MRA vasculopathy score, and platelet count had p values < 0.10 on univariate analysis, but none was significant (p < 0.05) in multivariate analyses (Table V). Spleen R2* trended upward with serum ferritin (p=0.08) and with years of transfusion therapy (p =0.06). The multivariate model demonstrated an adjusted r2 of 0.26. Spleen R2* did not correlate with spleen volume or texture by ultrasound, and was independent of peripheral blood counts including platelets, white blood cell count, haemoglobin, and percentage of HbS.
Table IV. Univariate correlations (r2 and p value) between iron indices (ln scale), clinical history and laboratory values.
| Organ | LIC R2* | Pancreas R2* | Kidney R2* | Spleen R2* |
|---|---|---|---|---|
| LICR2* (mg/g) | --- | 0.14 (<0.0001) | 0.002 (0.63) | 0.14 (0.0008) |
| Pancreas R2* (Hz) | 0.14 (<0.0001) | --- | 0.01 (0.19) | 0.08 (0.01) |
| Kidney R2* (Hz) | 0.002 (0.63) | 0.01 (0.19) | --- | 0.007 (0.47) |
| Spleen R2* (Hz) | 0.14 (0.0008) | 0.08 (0.01) | 0.007 (0.47) | --- |
| Age (years) | 0.03 (0.0503) | 0.003 (0.54) | 0.0007 (0.78) | 0.06 (0.04) |
| Gender (male/female) | 0.009 (0.31) | 0.02 (0.24) | 0.01 (0.20) | 0.03 (0.12) |
| Body mass index (kg/m2) | 0.001 (0.70) | 0.003 (0.55) | 0.02 (0.13) | 0.02 (0.28) |
| Systolic Blood Pressure (mm Hg) | 0.004 (0.51) | 0.01 (0.27) | 0.02 (0.17) | 0.09 (0.009) |
| Diastolic Blood Pressure (mm Hg) | 0.004 (0.52) | 0.03 (0.08) | 0.003 (0.60) | 0.08 (0.01) |
| Years of Transfusion Therapy | 0.01 (0.22) | 0.01 (0.33) | 0.003 (0.53) | 0.04 (0.09) |
| Years of Chelation | 0.02 (0.18) | 0.02 (0.16) | 0.001 (0.75) | 0.005 (0.57) |
| Currently on chelation (yes/no) | 0.0005 (0.81) | 0.0002 (0.89) | 0.04 (0.04) | 0.003 (0.62) |
| Exjade in the past year (yes/no) | 0.04 (0.03) | 0.004 (0.52) | 0.009 (0.30) | 0.0007 (0.81) |
| Desferal in the past year (yes/no) | 0.05 (0.01) | 0.02 (0.12) | 0.0004 (0.84) | 0.02 (0.19) |
| Haemoglobin at enrollment (g/l) | 0.002 (0.65) | 0.02 (0.13) | 0.10 (0.0004) | 0.04 (0.06) |
| Average pre-treatment Hb over last 6 months (g/l) | 0.004 (0.52) | 0.003 (0.58) | 0.04 (0.03) | 0.03 (0.12) |
| HbS (%) | 0.001 (0.79) | 0.003 (0.59) | 0.01 (0.28) | 0.008 (0.43) |
| Absolute reticulocyte count (×109/l) | 0.02 (0.14) | 0.005 (0.46) | 0.04 (0.04) | 0.09 (0.01) |
| Serum ferritin (μg/l) | 0.33 (<0.0001) | 0.06 (0.01) | 0.002 (0.65) | 0.04 (0.09) |
| Serum Iron (μg/l) | 0.001 (0.73) | 0.007 (0.40) | 0.03 (0.12) | 0.007 (0.52) |
| Total Iron Binding Capacity (μmol/l) | 0.12 (0.0003) | 0.02 (0.13) | 0.12 (0.0004) | 0.01 (0.37) |
| Transferrin saturation (%) | 0.19 (<0.0001) | 0.002 (0.65) | 0.02 (0.22) | 0.0001 (0.95) |
| Lactate dehydrogenase (u/l) | 0.06 (0.01) | 0.0009 (0.75) | 0.24 (<0.0001) | 0.001 (0.74) |
| C-reactive protein (mg/l) | 0.008 (0.38) | 0.02 (0.21) | 0.0001 (0.90) | 0.09 (0.01) |
| Alanine transaminase (u/l) | 0.03 (0.0481) | 0.004 (0.53) | 0.02 (0.17) | 0.006 (0.50) |
| Creatinine (μmol/l) | 0.006 (0.41) | 0.001 (0.69) | 0.12 (0.0001) | 0.01 (0.38) |
| Bilirubin (μmol/l) | 0.05 (0.02) | 0.008 (0.35) | 0.04 (0.02) | 0.001 (0.76) |
| Estimated glomerular filtration rate (ml/min/1.73m2) | 0.01 (0.28) | 0.002 (0.67) | 0.04 (0.04) | 0.007 (0.46) |
| Transcranial doppler maximum velocity, screening (cm/s) | 0.006 (0.39) | 0.02 (0.21) | 0.01 (0.23) | 0.004 (0.56) |
| Magnetic resonance imaging vasculopathy score (1-5) | 0.04 (0.53) | 0.13 (0.02) | 0.13 (0.02) | 0.12 (0.09) |
| Platelet count (×109/l) | 0.02 (0.16) | 0.02 (.18) | 0.0009 (0.76) | 0.08 (0.01) |
| White cell count (×109/l) | 0.03 (0.06) | 0.04 (0.04) | 0.01 (0.27) | 0.02 (0.17) |
| Spleen present (yes/no) | 0.02 (0.14) | 0.0001 (0.93) | 0.05 (0.01) | -- |
| Spleen volume (yes/no) | 0.009 (0.38) | 0.04 (0.09) | 0.001 (0.74) | <0.0001 (0.96) |
| Spleen inhomogeneous (yes/no) | 0.01 (0.27) | 0.02 (0.19) | 0.01 (0.30) | 0.03 (0.13) |
| Spleen coarse echotexture (yes/no) | 0.04 (0.05) | 0.02 (0.20) | <0.0001 (0.95) | 0.02 (0.26) |
Table V.
Multivariate correlations (coefficient and p value) between iron indices (ln scale), clinical history and laboratory values.
| Liver | Pancreas | Renal | Spleen | |||||
|---|---|---|---|---|---|---|---|---|
| Independent variable* | Coeff | P | Coeff. | P | Coeff. | P | Coeff. | P |
| Age (years) | 0.04 | 0.047 | -0.04 | 0.47 | ||||
| SBP (mm Hg) | 0.01 | 0.32 | ||||||
| DBP (mm Hg) | 0.003 | 0.34 | 0.02 | 0.15 | ||||
| Years of transfusion therapy | 0.14 | 0.06 | ||||||
| Currently on chelation (yes/no) | -0.30 | 0.12 | ||||||
| Deferasirox in past year (yes/no) | -0.39 | 0.07 | ||||||
| Deferoxamine in past year (yes/no) | 0.21 | 0.50 | ||||||
| Haemoglobin at enrolment (g/l) | -0.22 | 0.02 | -0.23 | 0.18 | ||||
| Average pre-treatment haemoglobin over last 6 months, g/l | -0.06 | 0.51 | ||||||
| Absolute reticulocyte count (× 109/l) | -0.0006 | 0.32 | 0.0004 | 0.60 | ||||
| Serum Iron (μg/l) | 0.0002 | <0.001 | 0.00001 | 0.40 | 0.0001 | 0.08 | ||
| Total Iron Binding Capacity (μmol/l) | -0.0006 | 0.04 | -0.001 | 0.006 | ||||
| Transferrin saturation (%) | 0.006 | 0.07 | ||||||
| Lactate dehydrogenase (u/l) | -0.0005 | 0.04 | 0.001 | <0.001 | ||||
| C-reactive protein (mg/l) | 0.03 | 0.15 | ||||||
| Alanine transaminase (u/l) | 0.001 | 0.26 | ||||||
| Creatinine (μmol/l) | -0.92 | 0.09 | ||||||
| Bilirubin (μmol/l) | -0.04 | 0.31 | 0.02 | 0.59 | ||||
| eGFR (ml/min/1.73m2) | -0.0003 | 0.57 | ||||||
| MRI vasculopathy score (1-5) | 0.006 | 0.72 | 0.17 | 0.15 | -0.06 | 0.80 | ||
| Platelet count (×109/l) | 0.002 | 0.06 | ||||||
| White blood cell count (×109/l) | -0.002 | 0.92 | 0.007 | 0.38 | ||||
| Spleen volume (ml) | -0.0002 | 0.13 | ||||||
| Spleen coarse echo texture (yes/no) | 0.08 | 0.49 | ||||||
| Model r2 | 0.59 | <0.0001 | 0.08 | 0.29 | 0.44 | <0.0001 | 0.38 | 0.003 |
| Adjusted r2 | 0.52 | 0.02 | 0.38 | 0.26 | ||||
| In model including “Spleen present”: | ||||||||
| Spleen present | -0.32 | 0.07 | ||||||
| Model r2 | 0.49 | <0.0001 | ||||||
| Adjusted r2 | 0.41 | |||||||
Coeff., coefficient; SBP, systolic blood pressure; DBP, diastolic blood pressure; eGFR, estimated glomerular filtration rate; MRI, magnetic resonance imaging
Variables are included in the multivariate model if the univariate p value <0.10.
Minimal pancreatic iron overload was detected, with only 38.3% of the children having R2* values above the normal range (Table III). Pancreas R2* was independent of subject age, sex, years of transfusion and years of chelation. Pancreas R2* correlated with LIC (r = 0.32, p=0.005), but the relationship had threshold behaviour because 11/14 (79%) participants with LIC ≥ 18 mg/g had clear pancreatic iron overload (≥28.1), compared to 35/106 (33%) with LIC < 18 mg/g (p=0.002 by Fischer's exact test). No child had a pancreas R2* exceeding 100 Hz, which is the level associated with cardiac iron and endocrine toxicities in thalassemia major patients(Meloni et al, 2014;Noetzli et al, 2009).
Kidney iron (R2*) was detectable in 119 (98%) of baseline R2* measurements (Table III). Similar to the pancreas, kidney R2* was independent of age, sex, LIC, serum ferritin, years of transfusion and years of chelation. Kidney R2* was proportional to LDH (p<0.001) and inversely proportional to baseline haemoglobin concentration (p<0.02) and total iron binding capacity (p=0.006) in the multivariate model. These “predictors” of kidney R2* are consistent with the hypothesis that filtered decellularized haemoglobin is responsible for the cortical iron deposition observed in patients with SCA(Schein et al, 2008). Kidney R2* was also proportional to serum creatinine and eGFR (p=0.0001 and 0.04, respectively, in the univariate analysis). Kidney R2* trended upward with urine albumin/creatinine ratio (p=0.098), and patients with albumin/creatinine ratios greater than 30 had significantly higher kidney R2* (Figure 4). Kidney R2* also trended higher with the brain MRA vasculopathy grade (p=0.19). In univariate analyses, it was also related to use of chelation therapy, haemoglobin at enrolment (p=0.02 in multivariate analyses), average pre-treatment haemoglobin, ARC, total iron binding capacity (p=0.006 multivariate), LDH (p<0.001 multivariate), bilirubin, MRA vasculopathy score, and presence of a spleen. In multivariate analyses, haemoglobin at enrolment, total iron binding capacity and LDH were significant (p=0.02, p=0.006, and p<0.001, respectively).
Figure 4.
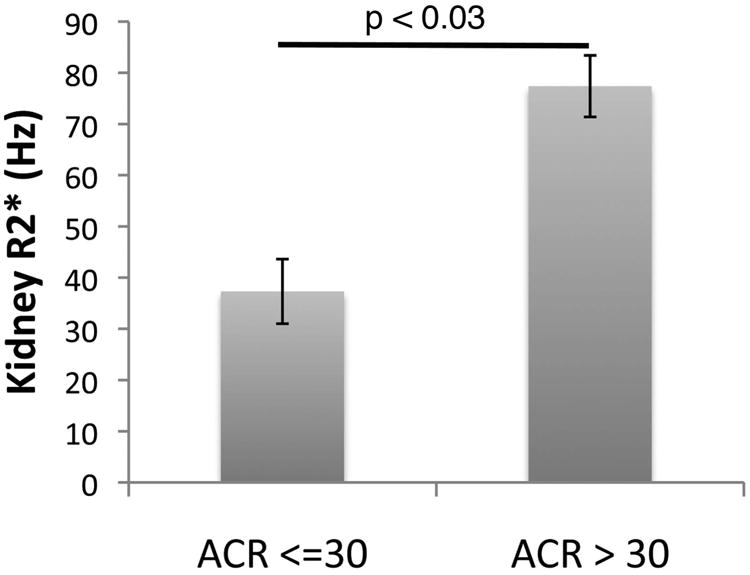
Bar graph depicting the kidney R2* value in patients with and without proteinuria, defined as a urinary albumin-creatinine ratio (ACR) greater than 30. Error bars represent standard error of the mean.
Discussion
This study documents the severity and heterogeneity of abdominal parenchymal iron loading in a large, paediatric cohort of children with SCA receiving chronic transfusions. In addition to the large size of this cohort, a real strength of this study relates to the fact that observations were made with standardized MRI protocols (Table I) across many different medical centres. With an average age of less than 10 years, and just over 4 years of monthly transfusions, children enrolled in TWiTCH had elevated iron accumulation in both the liver and spleen, most had iron deposition in the kidney, and some even had pancreatic deposition. If the severity of parenchymal iron deposition was surprising, the heterogeneity is perhaps not, because liver, pancreas, kidney and spleen have different mechanisms and rates of iron uptake. Initially, transfusion-acquired iron is stored within the reticuloendothelial system (Kupffer cells, bone marrow and splenic macrophages) but redistributes over time into hepatocytes, endocrine glands and the heart(Noetzli et al, 2008;Noetzli et al, 2011;Noetzli et al, 2009). As a result, the spleen could be expected to be the most heavily loaded organ, followed by the liver, which was observed in this young cohort (Table III). These observations document the fact that the spleen in SCA, however small and even non-functional from an immune standpoint, still serves as an important depot for transfusional iron. Using an approximate calibration curve, splenic iron averaged 13.9 mg/g in this population, nearly 40% higher than the average LIC for the whole population(Brewer et al, 2009).
The lack of correlation between parenchymal iron deposition in the liver and spleen with the duration of transfusion therapy reflects the use of iron chelation therapy in more than 95% of patients. Liver iron was associated with deferasirox and deferoxamine use in the previous year on univariate analysis. Iron stores, therefore, most likely represent compliance with iron chelation therapy, which is difficult to quantitate and not captured in this study. The significance of splenic iron overload is difficult to ascertain, given the lack of good markers of splenic function, and the overlay of microvascular obstruction and splenic infarction. However, the fact that even non-functional splenic tissue can accumulate iron suggests an important protective role for the spleen in chronically transfused patients with SCA. Prospective studies using MRI R2* technology should be used when surgical splenectomy is recommended for hypersplenism or other reasons, to determine the importance of the spleen acting as a ‘sump’ for transfusional iron overload in this patient population.
Pancreas iron loading was uncommon in the TWiTCH cohort. The risk of pancreatic (and cardiac) iron deposition from chronic transfusions is known to vary significantly by disease state, being most rapid in Blackfan-Diamond anaemia and least rapid in thalassemia intermedia syndromes (Porter 2007;Wood 2008). Multiple factors appear to contribute to this phenomenon, including the rate of effective erythropoiesis(Gafter-Gvili et al, 2004;Meloni et al, 2014;Sahlstedt et al, 2009), degree of systemic inflammation(Walter et al, 2006), as well as the rate and duration of transfusional iron loading(Noetzli et al, 2011;Wood et al, 2004). Effective erythropoiesis as occurs in SCA serves to regenerate apotransferrin, which lowers transferrin saturation and the risk of labile plasma iron(Gafter-Gvili et al, 2004;Sahlstedt et al, 2009). Chronic inflammation in patients with SCA is associated with high circulating hepcidin levels, low transferrin saturations, and increased iron retention in the reticuloendothelial system(Ganz 2006). Chronically transfused patients with SCA are known to have a higher inflammatory cytokine background and lower transferrin saturations than thalassemia major patients(Walter et al, 2006). Regardless of the mechanism, the relatively low baseline transferrin saturation in our cohort (47.6%) helps to explain the low prevalence of pancreatic iron loading. Significant labile plasma iron, which more easily enters the parenchymal cells, does not appear in the blood until serum transferrin is more than 85% saturated(Piga et al, 2009;Pootrakul et al, 2004). Endocrine glands and the heart only develop pathological iron overload through passage of labile iron species through nonspecific divalent channels, possibly L or T type calcium channels(Kumfu et al, 2012;Oudit et al, 2003). Previous single centre studies suggest that patients with SCA have relatively low cardiac and pancreatic iron burden (Meloni et al, 2014;Noetzli et al, 2011;Wood 2008;Wood et al, 2004) as well as minimal pancreatic and cardiac toxicities(Vichinsky et al, 2005). Although cardiac iron was not assessed in this study, cardiac iron has never been documented in the absence of significant (R2* > 100 Hz) pancreatic iron overload(Meloni et al, 2014;Noetzli et al, 2011;Noetzli et al, 2009). Measurements such as fasting glucose and glucose tolerance testing were not performed in TWiTCH, so it was not possible to investigate the functional significance of the observed pancreas iron deposition.
In contrast to iron deposition within the liver, spleen and pancreas, iron loading within the kidney depends almost entirely on cell free haemoglobin and haeme species, rather than on transfusional iron-laden macrophages or labile plasma iron. Filtered haemoglobin binds to megalin and cubulin receptors and is taken up by endocytosis into the proximal and distal convoluted tubules of the kidney(Gburek et al, 2002), creating the classic cortical loading pattern observed by MRI(Schein et al, 2008;Solecki et al, 1983). In our cohort, kidney R2* correlated most strongly with LDH (positive association) and baseline haemoglobin level (negative). Our novel association between kidney R2* and albuminuria suggests a relationship between early sickle nephropathy and renal iron deposition. Given that all of these children were receiving transfusions that suppress some of their endogenous sickle erythropoiesis, these predictors may also result from intrinsic differences in the patients' own red blood cell membranes or vascular endothelium, as well as iatrogenic sources of haemolysis, such as erythrocyte alloimmunization and antigen-mismatched transfusions.
Our study had a few limitations. Although the MRI core laboratory standardized acquisitions as much as possible, complete MRI parameter standardization was impossible. Quantification of the transfusional iron burden, prior to the baseline examination, was not obtained. Patient compliance with iron chelation therapy was also not documented. Since there was little prior data on predictors of extrahepatic iron deposition in sickle cell disease patients, our statistics were performed as associations of discovery, leaving them vulnerable to Type 1 error. Predictors identified in this manuscript should be validated in an independent data set.
In summary, we have defined a substantial iron burden within the abdominal organs of a large cohort of children with SCA who are receiving chronic transfusions for proven cerebrovascular disease. In addition to liver deposition, every child with splenic tissue present on MRI had evidence of splenic parenchymal iron deposition, and most had evidence of renal iron accumulation as well. Serial measurements with R2* will occur at the end of the study, which will allow a direct comparison of protocol-directed therapeutic interventions (chelation versus phlebotomy) and provide further insights into the loading and unloading of iron within this patient population.
Acknowledgments
This work was supported by the National Heart Lung and Blood Institute (R01HL095647-05 and 5 R01 HL095511-05). We would like to credit all participating sites and investigators. The authors would also like to thank Resonance Health for their help setting up and interpreting the FerriScan® analyses for this study.
Participating sites and clinical investigators are listed as follows: Texas Children's Hospital (Alex George), Children's Hospital Boston (Matt Heeney), Cincinnati Children's Hospital Medical Center (Theodosia Kalfa), Children's Hospital of Minneapolis (Steve Nelson), Children's Healthcare of Atlanta, Eggleston (Clark Brown), Hughes Spaulding (Beatrice Gee), Scottish Rite (Clark Brown), Children's Hospital of Philadelphia (Janet Kwiatkowski), Toronto Sick Kids Hospital (Issac Odame), Children's National Medical Center (Lori Luchtman-Jones), Columbia University (Margaret Lee), Rainbow Babies and Children's Hospital (Connie Piccone), University of South Alabama (Hamayun Imran), Medical University of South Carolina, Charlston (Sherron Jackson), Cohen Children's Medical Center, New Hyde Park (Banu Aygun), St. Jude Children's Research Hospital, Memphis (Kerry Nottage), State University of New York Downstate, Brooklyn (Scott Miller), University of Alabama, Birmingham (Lee Hilliard), University of Miami (Ofelia Alvarez), University of Mississippi, Jackson (Margaret Smith), University of Texas Southwestern, Dallas (Zora Rogers), Wayne State University, Detroit (Ingrid Sarniak), Lurie Children's Hospital of Chicago (Alexis Thompson), Children's Hospital of the King's Daughter, Norfolk (William Owen), Nemour's Children's Hospital, Jacksonville (Cynthia Gauger), University of South Carolina, Columbia (Carla Roberts), Duke University Medical Center, Durham (Jennifer Rothman), and Eastern Carolina University, Greenville (Beng Fuh).
Footnotes
Author contributions: All authors participated in the design, execution and authorship of this manuscript. Patient recruitment was performed by all the TWiTCH investigators. Statistics and data analysis were performed by JCW, SLP, and BRD.
References
- Abboud MR, Yim E, Musallam KM, Adams RJ. Discontinuing prophylactic transfusions increases the risk of silent brain infarction in children with sickle cell disease: data from STOP II. Blood. 2011;118:894–898. doi: 10.1182/blood-2010-12-326298. [DOI] [PMC free article] [PubMed] [Google Scholar]
- Adams RJ, Brambilla D. Discontinuing prophylactic transfusions used to prevent stroke in sickle cell disease. N Engl J Med. 2005;353:2769–2778. doi: 10.1056/NEJMoa050460. [DOI] [PubMed] [Google Scholar]
- Armstrong-Wells J, Grimes B, Sidney S, Kronish D, Shiboski SC, Adams RJ, Fullerton HJ. Utilization of TCD screening for primary stroke prevention in children with sickle cell disease. Neurology. 2009;72:1316–1321. doi: 10.1212/WNL.0b013e3181a110da. [DOI] [PubMed] [Google Scholar]
- Bernaudin F, Verlhac S, Arnaud C, Kamdem A, Chevret S, Hau I, Coic L, Leveille E, Lemarchand E, Lesprit E, Abadie I, Medejel N, Madhi F, Lemerle S, Biscardi S, Bardakdjian J, Galacteros F, Torres M, Kuentz M, Ferry C, Socie G, Reinert P, Delacourt C. Impact of early transcranial Doppler screening and intensive therapy on cerebral vasculopathy outcome in a newborn sickle cell anemia cohort. Blood. 2011;117:1130–1140. doi: 10.1182/blood-2010-06-293514. quiz 1436. [DOI] [PubMed] [Google Scholar]
- Brewer CJ, Coates TD, Wood JC. Spleen R2 and R2* in iron-overloaded patients with sickle cell disease and thalassemia major. Journal of Magnetic Resonance Imaging. 2009;29:357–364. doi: 10.1002/jmri.21666. [DOI] [PMC free article] [PubMed] [Google Scholar]
- Enninful-Eghan H, Moore RH, Ichord R, Smith-Whitley K, Kwiatkowski JL. Transcranial Doppler ultrasonography and prophylactic transfusion program is effective in preventing overt stroke in children with sickle cell disease. J Pediatr. 2010;157:479–484. doi: 10.1016/j.jpeds.2010.03.007. [DOI] [PMC free article] [PubMed] [Google Scholar]
- Gafter-Gvili A, Prokocimer M, Breuer W, Cabantchik IZ, Hershko C. Non-transferrin-bound serum iron (NTBI) in megaloblastic anemia: effect of vitamin B(12) treatment. Hematol J. 2004;5:32–34. doi: 10.1038/sj.thj.6200332. [DOI] [PubMed] [Google Scholar]
- Ganz T. Molecular pathogenesis of anemia of chronic disease. Pediatr Blood Cancer. 2006;46:554–557. doi: 10.1002/pbc.20656. [DOI] [PubMed] [Google Scholar]
- Gburek J, Verroust PJ, Willnow TE, Fyfe JC, Nowacki W, Jacobsen C, Moestrup SK, Christensen EI. Megalin and cubilin are endocytic receptors involved in renal clearance of hemoglobin. J Am Soc Nephrol. 2002;13:423–430. doi: 10.1681/ASN.V132423. [DOI] [PubMed] [Google Scholar]
- Helton KJ, Adams RJ, Kesler KL, Lockhart A, Aygun B, Driscoll C, Heeney MM, Jackson SM, Krishnamurti L, Miller ST, Sarnaik SA, Schultz WH, Ware RE. Magnetic resonance imaging/angiography and transcranial Doppler velocities in sickle cell anemia: results from the SWiTCH trial. Blood. 2014;124:891–898. doi: 10.1182/blood-2013-12-545186. [DOI] [PMC free article] [PubMed] [Google Scholar]
- Kumfu S, Chattipakorn S, Chinda K, Fucharoen S, Chattipakorn N. T-type calcium channel blockade improves survival and cardiovascular function in thalassemic mice. European Journal of Hematology. 2012;88:535–548. doi: 10.1111/j.1600-0609.2012.01779.x. [DOI] [PubMed] [Google Scholar]
- Meloni A, Zmyewski H, Rienhoff HY, Jr, Jones A, Pepe A, Lombardi M, Wood JC. Fast approximation to pixelwise relaxivity maps: validation in iron overloaded subjects. Magn Reson Imaging. 2013;31:1074–1080. doi: 10.1016/j.mri.2013.05.005. [DOI] [PMC free article] [PubMed] [Google Scholar]
- Meloni A, Puliyel M, Pepe A, Berdoukas V, Coates TD, Wood JC. Cardiac iron overload in sickle-cell disease. American Journal of Hematology. 2014;89:678–683. doi: 10.1002/ajh.23721. [DOI] [PubMed] [Google Scholar]
- Noetzli LJ, Carson SM, Nord AS, Coates TD, Wood JC. Longitudinal analysis of heart and liver iron in thalassemia major. Blood. 2008;112:2973–2978. doi: 10.1182/blood-2008-04-148767. [DOI] [PMC free article] [PubMed] [Google Scholar]
- Noetzli LJ, Papudesi J, Coates TD, Wood JC. Pancreatic iron loading predicts cardiac iron loading in thalassemia major. Blood. 2009;114:4021–4026. doi: 10.1182/blood-2009-06-225615. [DOI] [PMC free article] [PubMed] [Google Scholar]
- Noetzli LJ, Coates TD, Wood JC. Pancreatic iron loading in chronically transfused sickle cell disease is lower than in thalassaemia major. British Journal of Hematology. 2011;152:229–233. doi: 10.1111/j.1365-2141.2010.08476.x. [DOI] [PubMed] [Google Scholar]
- Oudit GY, Sun H, Trivieri MG, Koch SE, Dawood F, Ackerley C, Yazdanpanah M, Wilson GJ, Schwartz A, Liu PP, Backx PH. L-type Ca(2+) channels provide a major pathway for iron entry into cardiomyocytes in iron-overload cardiomyopathy. Nature Medicine. 2003;9:1187–1194. doi: 10.1038/nm920. [DOI] [PubMed] [Google Scholar]
- Piga A, Longo F, Duca L, Roggero S, Vinciguerra T, Calabrese R, Hershko C, Cappellini MD. High nontransferrin bound iron levels and heart disease in thalassemia major. American Journal of Hematology. 2009;84:29–33. doi: 10.1002/ajh.21317. [DOI] [PubMed] [Google Scholar]
- Pootrakul P, Breuer W, Sametband M, Sirankapracha P, Hershko C, Cabantchik ZI. Labile plasma iron (LPI) as an indicator of chelatable plasma redox activity in iron-overloaded beta-thalassemia/HbE patients treated with an oral chelator. Blood. 2004;104:1504–1510. doi: 10.1182/blood-2004-02-0630. [DOI] [PubMed] [Google Scholar]
- Porter JB. Concepts and goals in the management of transfusional iron overload. American Journal of Hematology. 2007;82:1136–1139. doi: 10.1002/ajh.21100. [DOI] [PubMed] [Google Scholar]
- Sahlstedt L, von Bonsdorff L, Ebeling F, Parkkinen J, Juvonen E, Ruutu T. Non-transferrin-bound iron in haematological patients during chemotherapy and conditioning for autologous stem cell transplantation. Eur J Haematol. 2009;83:455–459. doi: 10.1111/j.1600-0609.2009.01310.x. [DOI] [PubMed] [Google Scholar]
- Schein A, Enriquez C, Coates TD, Wood JC. Magnetic resonance detection of kidney iron deposition in sickle cell disease: A marker of chronic hemolysis. Journal of Magnetic Resonance Imaging. 2008;28:698–704. doi: 10.1002/jmri.21490. [DOI] [PMC free article] [PubMed] [Google Scholar]
- Schwartz GJ, Haycock GB, Edelmann CM, Jr, Spitzer A. A simple estimate of glomerular filtration rate in children derived from body length and plasma creatinine. Pediatrics. 1976;58:259–263. [PubMed] [Google Scholar]
- Solecki R, von Zglinicki T, Muller HM, Clausing P. Iron overload of spleen, liver and kidney as a consequence of hemolytic anaemia. Exp Pathol. 1983;23:227–235. doi: 10.1016/s0232-1513(83)80062-0. [DOI] [PubMed] [Google Scholar]
- Vichinsky E, Butensky E, Fung E, Hudes M, Theil E, Ferrell L, Williams R, Louie L, Lee PD, Harmatz P. Comparison of organ dysfunction in transfused patients with SCD or beta thalassemia. American Journal of Hematology. 2005;80:70–74. doi: 10.1002/ajh.20402. [DOI] [PubMed] [Google Scholar]
- Walter PB, Fung EB, Killilea DW, Jiang Q, Hudes M, Madden J, Porter J, Evans P, Vichinsky E, Harmatz P. Oxidative stress and inflammation in iron-overloaded patients with beta-thalassaemia or sickle cell disease. British Journal of Hematology. 2006;135:254–263. doi: 10.1111/j.1365-2141.2006.06277.x. [DOI] [PMC free article] [PubMed] [Google Scholar]
- Wood JC. Cardiac iron across different transfusion-dependent diseases. Blood Rev. 2008;22 Suppl 2:S14–21. doi: 10.1016/S0268-960X(08)70004-3. [DOI] [PMC free article] [PubMed] [Google Scholar]
- Wood JC, Tyszka JM, Ghugre N, Carson S, Nelson MD, Coates TD. Myocardial iron loading in transfusion-dependent thalassemia and sickle-cell disease. Blood. 2004;103:1934–1936. doi: 10.1182/blood-2003-06-1919. [DOI] [PubMed] [Google Scholar]