Abstract
Dietary leucine was incrementally restricted to test whether limiting this essential amino acid (EAA) would fully reproduce the beneficial responses produced by dietary methionine restriction. Restricting leucine by 85% increased energy intake and expenditure within five to seven days of its introduction and reduced overall accumulation of adipose tissue. Leucine restriction (LR) also improved glucose tolerance, increased hepatic release of FGF21 into the blood stream, and enhanced insulin-dependent activation of Akt in liver. However, LR had no effect on hepatic lipid levels and failed to lower lipogenic gene expression in the liver. LR did affect remodeling of white and brown adipose tissue, increasing expression of both thermogenic and lipogenic genes. These findings illustrate that dietary LR reproduces many but not all of the physiological responses of methionine restriction. The primary differences occur in the liver, where methionine and leucine restriction cause opposite effects on tissue lipid levels and expression of lipogenic genes. Together these findings suggest that the sensing systems which detect and respond to dietary restriction of EAAs act through mechanisms that both leucine and methionine are able to engage, and in the case of hepatic lipid metabolism, may be unique to specific EAAs such as methionine.
Introduction
Diets in which the concentration of a single essential amino acid (EAA) has been reduced have attracted significant interest because they produce well-defined and beneficial sets of physiological responses, including effects on energy balance, lipid metabolism, and insulin sensitivity [1–4]. The best studied of these are diets devoid of leucine and diets in which methionine has been restricted to a specific low level [1,3–5]. A correspondingly strong case can be made that the biological systems monitoring the composition of dietary protein provide regulatory input to the control of energy balance and intermediary metabolism, but the associated sensing and signaling mechanisms that coordinate these responses are poorly defined. Given that a subgroup of the amino acids (e.g., EAAs) that make up proteins cannot be synthesized endogenously, the ability to detect and respond to dietary EAA deficiencies represents an important survival mechanism. The well-documented in vivo responses to perturbation of dietary EAA composition make a compelling case that EAAs are the entities being sensed.
The acute responses to leucine deprivation and methionine restriction share several similarities, including downregulation of hepatic lipogenic genes, increased oxidative genes in white adipose tissue (WAT), and increased energy expenditure (EE) [2,3,5]. Both diets increase circulating concentrations of fibroblast growth factor 21 (FGF21) [5–8] and sympathetic nervous system (SNS) stimulation of adipose tissue [5,9], inducing a concomitant activation of oxidative and thermogenic gene programs [3,5]. In contrast to these similarities, leucine deprivation and methionine restriction have opposite effects on ingestive behavior, with leucine deprivation causing a 20 to 30% decrease in food intake while methionine restriction produces a significant and chronic increase in food consumption [10,11]. Another significant difference is that leucine deprivation downregulates lipogenic gene expression in both liver and adipose tissue, whereas methionine restriction produces a reciprocal down- and up-regulation of lipogenic genes in liver and adipose tissue, respectively [2]. Viewed together, these findings raise the interesting question of whether dietary restriction of leucine would reproduce the effects of methionine restriction. Alternatively, the effects of methionine restriction on energy intake and lipogenic gene expression may be specific to methionine or indicative of response differences between EAA deprivation and restriction. Using a series of diets formulated to contain progressive degrees of leucine restriction, we found that 85% leucine restriction reproduces the effects of methionine restriction on body weight, adiposity, EE and WAT remodeling, but not its effects on lipid metabolism and insulin signaling in all tissues. These findings make the case that the subtle differences in dietary EAA concentration between deprivation and restriction are accurately sensed and linked to both common and unique sets of responses.
Materials and Methods
Animals and Diets
All vertebrate animal experiments were reviewed and approved by the Pennington Institutional Animal Care and Use Committee using guidelines established by the National Research Council, the Animal Welfare Act, and the PHS Policy on humane care and use of laboratory animals. The animals used in all experiments were male C57BL/6J mice from our breeding colony maintained at Pennington. Beginning at 5 weeks of age all mice were adapted to the control (CON) diet prior to being randomized to dietary groups in each experiment. The CON diet contains 1.11% leucine by weight and a series of diets containing progressive increases in the degree of leucine restriction were evaluated in three experiments. For example, leucine was restricted to 0.67% leucine by weight (40% LR), to 0.30% leucine by weight (73% LR), to 0.22% leucine by weight (80% LR), and to 0.17% leucine by weight (85% LR). The diets were formulated as extruded pellets and the energy content of CON and each LR diet was 15.96 kJ/g, with 18.9% of energy coming from fat (corn oil), 64.9% carbohydrate, and 14.8% from a custom mixture of L-amino acids. Diets and water were provided ad libitum and lights were on from 7 AM to 7 PM. Housing temperature was ~23°C. Animals were singly housed, provided with corncob bedding, TEK-fresh nesting material, and PVC pipes for enrichment. Three studies were conducted to determine the optimal degree of leucine restriction.
Experiment 1
Five week-old male C57BL/6J mice (n=13) were adapted to the CON diet for 1 week. Mice were then randomized to remain on the CON diet (1.11% leucine by weight; n=6) or be switched to a diet containing a 40% reduction in leucine (0.67% leucine by weight; n=7). Mice received their diets for 8 wks. Weekly food intake, body weight, and body composition measurements were obtained. Mice were euthanized by decapitation following CO2-induced narcosis. Tissues were quickly harvested and snap frozen in liquid nitrogen for later processing.
Experiment 2
Five week-old male C57BL/6J mice (n=24) were adapted to the CON diet for 1 week. Mice were then randomized to remain on the CON diet (1.11% leucine by weight; n=8) or be switched to a diet containing a 73% reduction in leucine (0.30% leucine by weight; n=8) or an 80% reduction in leucine (0.22% leucine by weight; n=8). Mice received their diets for 11 wks. Weekly food intake, body weight, and body composition measurements were conducted. Mice were euthanized by decapitation following CO2-induced narcosis. Trunk blood was collected and processed for serum; tissues were quickly harvested and snap frozen in liquid nitrogen.
Experiment 3 Cohort 1
Five week-old male C57BL/6J mice (n=30) were adapted to the CON diet for 3 weeks. Mice were then placed in the TSE PhenoMaster/LabMaster Home Cage Indirect Calorimetry System (TSE Systems, Inc., Chesterfield, MO) for continuous measurements of VO2, CO2, and activity. All mice remained on the CON diet in the indirect calorimeter for 3 days prior to being randomized to either the CON diet or the LR diet (85% LR). After randomization to diets, mice remained in the home-cage chambers for an additional 11 days. Weekly food intake, body weight, and body composition measurements were obtained for the duration. Body composition was determined by nuclear magnetic resonance (NMR; Bruker Optics Inc., Billerica, MA). After 8 weeks on the respective diets, mice were evaluated using insulin tolerance tests (ITT), and one week later, glucose tolerance tests (GTT). One week later, EE was measured again over four days by indirect calorimetry. Eleven mice from each group were subsequently euthanized, trunk blood was collected and tissues were quickly harvested and snap frozen in liquid nitrogen. The remaining subset of each dietary group (n=4/grp) were anesthetized and perfused with saline, followed by 10% neutral buffered formalin (NBF) through the left ventricle. Tissues from these mice were harvested, stored in 10% NBF, processed, embedded in paraffin, and used for histological analysis.
Cohort 2
Five week-old male C57BL/6J mice (n=32) were adapted to the CON diet for 1 week. Mice were then randomized to the CON diet (n=16) or 85% LR diet (n=16) and fed their respective diets for 8 weeks. Then, mice were fasted for four hours and injected with vehicle (saline) or insulin (0.8 U/kg) 12 minutes prior to being euthanized by decapitation following CO2-induced narcosis. Tissues were quickly harvested and snap frozen in liquid nitrogen.
Cell Culture Studies
HepG2 cells were cultured in DMEM supplemented with 10% FBS, L-glutamine, and penicillin/streptomycin (Invitrogen, Grand Island, NY). Cells were washed with PBS and normal or leucine-restricted DMEM without FBS but with L-glutamine, and penicillin/streptomycin was added. Normal DMEM contains 802 μmol/L leucine, whereas the LR medium contains only 40.1 μmol/L leucine. Following 18 h treatment with CON or LR media, cells were treated with vehicle or 10 nM insulin. After 10 minutes, cell lysates were collected for measurement of Akt phosphorylation.
Indirect Calorimetry
Energy expenditure was measured in each mouse using a TSE PhenoMaster/LabMaster Home Cage System. Body composition of each mouse was measured by NMR prior to entry and upon exit from the metabolic chambers. Mice were acclimated in the metabolic chambers for 12 h prior to continuous measurement of VO2, VCO2, and voluntary activity at 40 minute intervals. Activity was measured using an ActiMot2 system. Energy expenditure was calculated as (VO2*(3.815+(1.232*RER))*4.1868), while respiratory exchange ratios (RER) were calculated as the ratio of VCO2 produced to VO2 consumed.
Histology
To assess the extent of “browning” within inguinal white adipose tissue (IWAT), sections of IWAT were stained with anti-perilipin (Cell Signaling, Danvers, MA, USA), and anti-wheat germ agglutinin-Oregon Green, as described previously [5]. The slides were scanned on a Hamamatsu NanoZoomer in fluorescence mode, and the resulting images were cropped and exported as JPEG images for analysis in Cell Profiler (http://www.cellprofiler.org/citations.shtml). Cells were identified as “white” or “beige” based on presence of unilocular or multi-locular lipid droplets and counted, as previously described [5]. Paraffin-embedded brown adipose tissue (BAT) were sectioned at 5 μm and stained for hematoxylin and eosin (H&E) and scanned on a Hamamatsu NanoZoomer.
Insulin Tolerance Tests
Mice were fasted for 4 h in a cage with fresh bedding prior to ITTs. Insulin (0.6 U/kg) was administered via intraperitoneal (i.p.) injection, and blood was sampled via tail nick at time 0 (before insulin injection), and 15, 30, 45, 60 minutes after insulin injection. Blood glucose concentrations were determined using a OneTouch UltraSmart glucometer.
Glucose Tolerance Tests
Mice were fasted for 14 h in a cage with fresh bedding prior to GTTs. Glucose (1g/kg) was administered via i.p. injection. Blood was sampled via tail nick at time 0 (before glucose injection), and 15, 30, 60, 90, 120 minutes after glucose injection. Blood glucose concentrations were determined using a OneTouch UltraSmart glucometer.
RNA Isolation and Quantitative Real-time PCR
Total RNA was isolated using an RNeasy Mini Kit (QIAGEN Inc., Valencia, CA, USA). One microgram of total RNA was reverse transcribed to produce complementary DNA. Gene expression was measured by RT-PCR (Applied Biosystems, Foster City, CA, USA) by measurement of SYBR Green. mRNA concentrations were normalized to cyclophilin expression. Cyclophilin expression was constant within tissues between diets. Primers used are listed in Table 1.
Table 1.
Primers used for RT-PCR
| Gene Symbol | Gene Name | Primer Sequences |
|---|---|---|
| Acaca | Acetyl-CoA carboxylase-1 | Fwd: 5′-CTCACCCAACCCAGAAAGGCCAA-3′ Rev: 5′-CAGGATCAGCTGGGATACTGAGT-3′ |
| Cidea | Cell death-inducing DFFA-like effector a | Fwd: 5′-ATCACAACTGGCCTGGTTACG-3′ Rev: 5′-TACTACCCGGTGTCCATTTCT-3′ |
| Cox7a | Cytochrome c oxidase subunit VIIa | Fwd: 5′-CAGCGTCATGGTCAGTCTGT-3′ Rev: 5′-AGAAAACCGTGTGGCAGAGA-3′ |
| Cox8b | Cytochrome c oxidase subunit VIIIb | Fwd: 5′-AGTTCACAGTGGTTCCCAAAG-3′ Rev: 5′-ACCATGAAGCCAACGACTATG-3′ |
| Dio2 | Deiodinase, iodothyronine, Type II | Fwd: 5′-GCTGCGCTGTGTCTGGAA-3′ Rev: 5′-TGGAATTGGGATCATCTTCAC-3′ |
| Fasn | Fatty Acid synthase | Fwd: 5′-TCCTGGAACGAGAACACGATCT-3′ Rev: 5′-GAGACGTGTCACTCCTGGACTTG-3′ |
| Fgf21 | Fibroblast growth factor 21 | Fwd: 5′-TGACACCCAGGATTTGAATGAC-3′ Rev: 5′-GCAGCCAATGATGTGTGCTTAC-3′ |
| Ppia | Cyclophilin | Fwd: 5′-CTTCGAGCTGTTTGCAGACAAAGT-3′ Rev: 5′-AGATGCCAGGACCTGTATGCT-3′ |
| Scd1 | Stearoyl-CoA desaturase-1 | Fwd: 5′-GTGCCGTGGGCGAGGGCTTC-3′ Rev: 5′-AGCCCAAAGCTCAGCTACTCTT-3′ |
| Ucp1 | Uncoupling protein 1 | Fwd: 5′-GATCCAAGGTGAAGGCCAGG-3′ Rev: 5′-GTTGACAAGCTTTCTGTGGTGG-3′ |
SDS-PAGE and Immunoblotting
Lysates were prepared from liver, IWAT, epididymal WAT, brown adipose tissue (BAT), and skeletal muscle or HepG2 cells in RIPA buffer [50 mM Tris, pH 7.4, 150 mM NaCl, 1 mM EDTA, 1% NP40, protease and phosphatase inhibitor mixes (Pierce, Thermo Fisher Scientific Inc., Rockford, IL)], aspirated three times with a 20G needle and centrifuged at 10,000 rpm for 10 min. Protein concentrations were determined using the Lowry assay. For Westerns, tissue lysates were separated on a 12.5% criterion gel (Biorad, Hercules, CA), transferred onto PVDF membranes (12V, overnight), and probed with specific antibodies. UCP1 was measured in IWAT and BAT, as previously described [5]. The pAkt (ser473) and Akt antibodies were from Millipore (Temecula, CA). The PDC-E2 antibody was from Santa Cruz Biotechnology, Inc. (Dallas, TX, USA). The β-actin antibody was from Sigma (St. Louis, MO). The membranes were re-probed for appropriate loading controls. Detected proteins were quantitated using Image J and the relative expression of target proteins was used to test for diet-induced differences in expression.
Serum Measurements
Serum insulin and FGF21 concentrations were measured using ELISA kits (Millipore, Temecula, CA; R&D Systems, Minneapolis, MN, respectively).
Statistical Analysis
For indirect calorimetry, group differences in EE (kJ/mouse/h) were compared using ANCOVA (JMP Statistical Software, Version 11; SAS Institute Inc., Cary, NC) as previously described (5), calculating least squares means that account for variation in EE attributable to differences in lean mass, fat mass, activity and energy intake among the mice. The least squares means ± SEM for each diet were compared using an unpaired t-test. For insulin signaling measurements, pAKT/Akt band densities were compared using a 2-way ANOVA with Tukey’s correction for multiple comparisons.
Results
Dietary Leucine Restriction Alters Energy Balance
Experiments 1 and 2
Initial experiments were used to gauge the optimal degree of leucine restriction. Restricting leucine by 40% had no discernible effect on body weight or food intake in Exp 1 (data not shown). A subsequent evaluation of 73%, and 80% LR in Exp 2 showed that neither diet increased food intake relative to the Control group. However, 80% LR produced a significant decrease in body weight relative to controls (CON, 27.6 ± 0.8 g; 80% LR, 22.3 ± 0.3 g), while 73% LR caused a small insignificant decrease in body weight (25.8 ± 0.7 g). Together, these data suggest that 80% LR is near the threshold of being effective, and at this level begun to increase EE without producing a compensatory increase in energy intake.
Experiment 3
To test this hypothesis, a diet restricting leucine by 85% was formulated and tested for its effects on energy balance. After 11 weeks, mice fed the 85% LR diet had 14% lower body weights and 27% less adiposity than mice on the CON diet (Table 2). The mice fed the CON diet decreased their percent lean mass during the study while increasing their adiposity by 3.2% (Table 2). In contrast, the mice on the LR diet maintained essentially the same body composition throughout the study (Table 2). The stable body weight and composition in the LR group during the study occurred despite a 17% increase in energy intake over the same period (Table 2).
Table 2.
Energy balance parameters for mice fed control or leucine-restricted diets for 11 wks.
| Diet | P Value | ||
|---|---|---|---|
| CON | LR | ||
| Initial Body Weight (g) | 21.5 ± 0.50 | 21.8 ± 0.48 | 0.7070 |
| Final Body Weight (g) | 26.2 ± 0.77 | 22.5 ± 0.56 | 0.0014* |
| Initial Adiposity (% Body Weight)a | 14.3 ± 0.68 | 13.2 ± 1.02 | 0.4097 |
| Final Adiposity (% Body Weight) | 17.5 ± 1.59 | 12.8 ± 0.51 | 0.0134* |
| Initial Leanness (% Body Weight)a | 71.6 ± 0.68 | 73.3 ± 0.93 | 0.1596 |
| Final Leanness (% Body Weight) | 67.8 ± 1.28 | 72.5 ± 0.38 | 0.0029* |
| Energy Intakeb (kJ/d/mouse) | 45.4 ± 1.17 | 53.1 ± 1.59 | 0.0012* |
| Energy Intakeb (kJ/d/g) | 1.84 ± 0.04 | 2.41 ± 0.06 | <0.0001* |
| Energy Expenditurec (kJ/h/mouse) | 1.95 ± 0.04 | 2.40 ± 0.03 | <0.0001* |
| Total Activity (AU) | 1264 ± 67 | 1320 ± 56 | 0.5362 |
| Insulin (ng/μL)d | 1.35 ± 0.16 | 0.61 ± 0.30 | 0.0350* |
Body composition was measured by NMR as described in the Materials and Methods and % adiposity and % lean were calculated as fat or lean mass/body weight x 100.
The average food intake less spillage was determined over a 24 h period each week in mice on each diet, converted to kJ, and expressed per mouse or per unit of body weight. Means represent average daily energy intake over the entire study and were compared as described above.
Energy expenditure was measured 10 wks after initiating diets using indirect calorimetry and analyzed by analysis of covariance as described in the Materials and Methods using diet as the main effect and calculating least squares means using lean mass, fat mass, and activity as covariates. Body weight, adiposity, energy intake and total activity were compared using unpaired t-tests. Least squares means were compared using residual variance as the error term and presented as mean ± SEM (n=8/grp). Means denoted with different superscripts within housing temperatures differ at P < 0.05.
Serum insulin concentrations were determined following a four hour fast. Four of the nine insulin values in the LR group were below the detectable limits of the assay, leaving five values for the LR group.
Means ± SEM are presented for each variable and based on n=8–9 per group. * Indicates statistically significant differences at p<0.05.
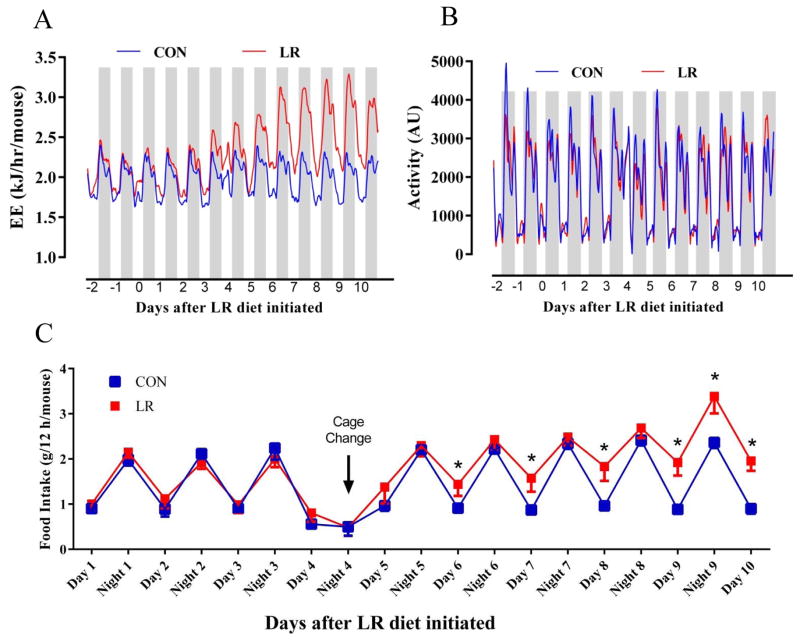
Measurements of the temporal changes in EE after initial exposure to the LR diet showed that baseline EE was stable and comparable among all mice prior to the diet switch on day 0 (Fig. 1A). The mice in both dietary groups showed a comparable oscillation of EE between night and day for the first five days, and mice on the CON diet did not vary from this pattern over the following seven days (Fig. 1A). In contrast, shortly after initiation of LR, the mice in this group showed evidence of increasing night time EE beginning on day 4 and increasing further over the following three nights (Fig. 1A). Comparison of day and night time mean EE showed that it was the night of day 5 when EE in the LR group became significantly higher than Controls. Thereafter, both day time and night time EE in the LR group were significantly higher than Controls (Fig. 1A). The observed changes in EE were unrelated to diet-dependent changes in voluntary activity, as the day time and night time activity was indistinguishable in the two groups (Fig. 1B). The body weights of the LR group had not yet diverged after 11 d of LR (CON, 24.7 ± 0.9 g; LR 22.5 ± 0.6 g; P=0.062), primarily because of a compensatory increase in energy intake in the LR group (Fig. 1C). The increase in energy intake in the LR group became evident 6 d after initiating LR, and the group difference expanded in the following days as both day and night time food intake differed between groups (Fig. 1C). The timing of the increase in energy intake in the LR group roughly coincides with the timing of the LR-induced increase in EE (Figs. 1A, 1C), suggesting the interesting possibility that the effect of the diet on the two components of energy balance are linked. It should also be noted that after 11 wks on the LR diet, the increase in energy intake per mouse averaged 18%, slightly less than the 23% increase in EE observed in this group (Table 2). This difference, integrated over the final 10 wks of the study translated into an energy balance that prevented significant accumulation of adipose tissue and a stable body weight (Table 2).
Figure 1. Time-dependent increase in energy expenditure and food intake by leucine restriction.
Energy expenditure (A), activity (B), and food intake (C) were measured in a TSE PhenoMaster/LabMaster Home Cage System. Mice were acclimated to the control (CON) diet and TSE system for 3 days prior to half of the sixteen mice being randomized to remain on CON diet or be switched to the leucine restricted (LR) diet. Mouse boxes were changed out on Day 4 as indicated in Fig. 1C, resulting in a loss of several hours of sampling, causing a blip on the EE and activity graphs and an appearance of less food intake on Day 4. Shaded bars in Figs. 1A and 1B denote night (lights off) and intervening light areas denote lights on. Means annotated with asterisks in Fig. 1C differ at P<0.05.
Dietary Leucine Restriction Increases Glucose Tolerance and Hepatic Insulin Signaling
Experiment 3, Cohort 1
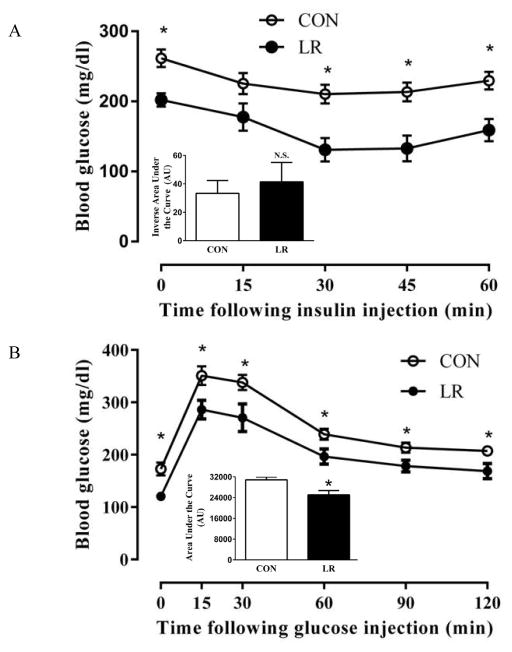
After 11 wks on the respective diets, serum insulin concentrations were significantly lower in LR-fed mice compared to CON (Table 2). In fact, four of the nine insulin values in the LR group were below the detection limits of the assay. ITTs and GTTs were used to test for diet-induced changes in insulin and glucose tolerance, respectively. Mice fed the LR diet had significantly lower fasting blood glucose concentrations (Fig. 2A), and at three of four time points following insulin injection, glucose concentrations were lower in the LR group (Fig. 2A). However, the inverse area under the curve did not differ between the groups (Fig. 2A, inset), indicating that the pattern and degree of glucose lowering by insulin was comparable between groups. Despite their lower fasting insulin levels (Table 2), LR-fed mice maintained lower blood glucose than CON mice following an i.p. injection of glucose (Fig. 2B). The improvement in glucose tolerance was also evident by the decreased area under the curve in the LR-fed mice (Fig. 2B, inset).
Figure 2. Effect of leucine restriction on insulin tolerance (A) and glucose tolerance (B).
Insulin sensitivity was measured in 10 mice/group using ITTs 8 weeks after initiating diets (A). Mice were fasted for 4 h prior to ITT. Blood glucose concentrations were measured at baseline and every 15 minutes for an hour after a single i.p. injection of insulin (0.6 U/kg). Glucose tolerance was measured in 11 mice/group using GTTs 9 weeks after initiating diets (B). Mice were fasted for 14 h prior to GTT. Blood glucose concentrations were measured at baseline and at five time points over the course of two hours following a single i.p. injection of glucose (1 g/kg body weight). Means annotated with an asterisk at each time differ from controls at P<0.05. Area under the curves of ITTs and GTTs are presented as bar graph insets for the respective tests. Means ± SEM are presented in arbitrary units and annotation with asterisks denotes that means differ at P<0.05.
Experiment 3, Cohort 2
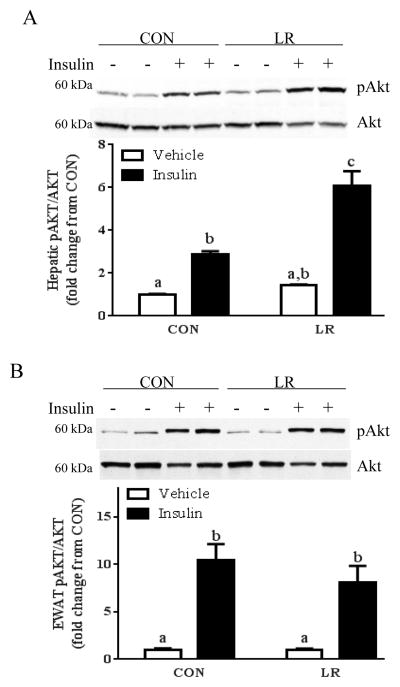
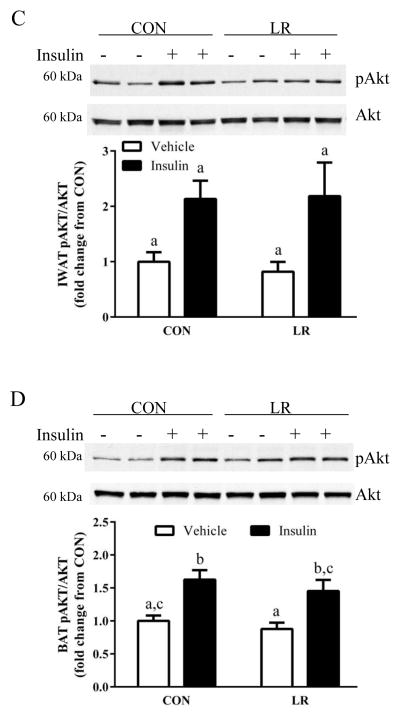
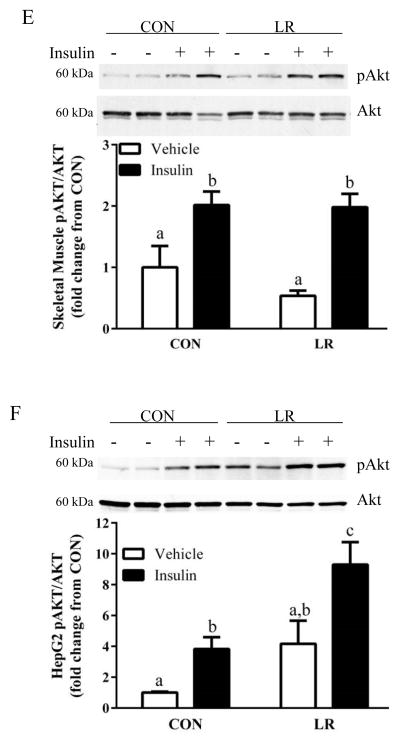
To begin to identify the tissues affected by LR, the effects of the diet on hepatic insulin signaling were assessed by measuring insulin-stimulated Akt phosphorylation. Basal Akt phosphorylation did not differ between CON and LR-fed mice, but insulin-dependent Akt phosphorylation was significantly enhanced in LR-fed mice compared to CON (Fig. 3A). In contrast, basal and insulin-stimulated Akt phosphorylation in epididymal WAT, IWAT, BAT, and skeletal muscle did not differ between CON and LR mice (Fig. 3B–E), suggesting that the LR-induced increase in insulin signaling was liver-specific. The lack of an increase in insulin signaling in other tissues is consistent with the lack of an improvement in whole body insulin tolerance (Fig. 3A). The LR-induced increase in hepatic insulin sensitivity is not simply due to the reduction in body weight, but rather is a result of direct effects of LR on the liver. This conclusion is supported by findings from an in vitro model of LR created by culturing HepG2 cells overnight in leucine-restricted media. After 18 hours of leucine restriction, insulin-stimulated Akt phosphorylation was significantly enhanced compared to the response in cells cultured in control media (Fig. 3F). Together, these findings support the view that restriction of leucine may act directly on the liver to enhance insulin-dependent signaling in hepatocytes.
Figure 3. Effect of leucine restriction on insulin-dependent Akt activation in liver (A), epididymal WAT (B), inguinal WAT (C), BAT (D), and skeletal muscle (E).
Mice were fed control (CON) or leucine-restricted (LR) diets for 8 weeks. After a 4 h fast, 12 mice/group were injected with either vehicle or insulin (0.8 U/kg) 12 minutes prior to sacrifice. Representative western blots of pAkt (ser473) and total Akt and corresponding band densities from the respective blots are presented in each panel. HepG2 cells were cultured in CON or LR media for 18 hours followed by a 10 min incubation with 10 nM insulin prior to cell harvest. Representative Western blot of pAkt and total Akt and corresponding band densities presented in panel 3F. Means ± SEM are presented, and means annotated with different letters differ at P<0.05.
Dietary Leucine Restriction Remodels Adipose Tissue
Experiment 3, Cohort 1
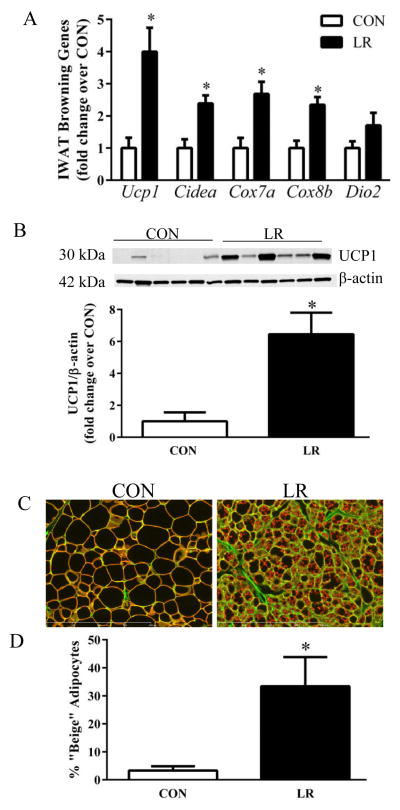
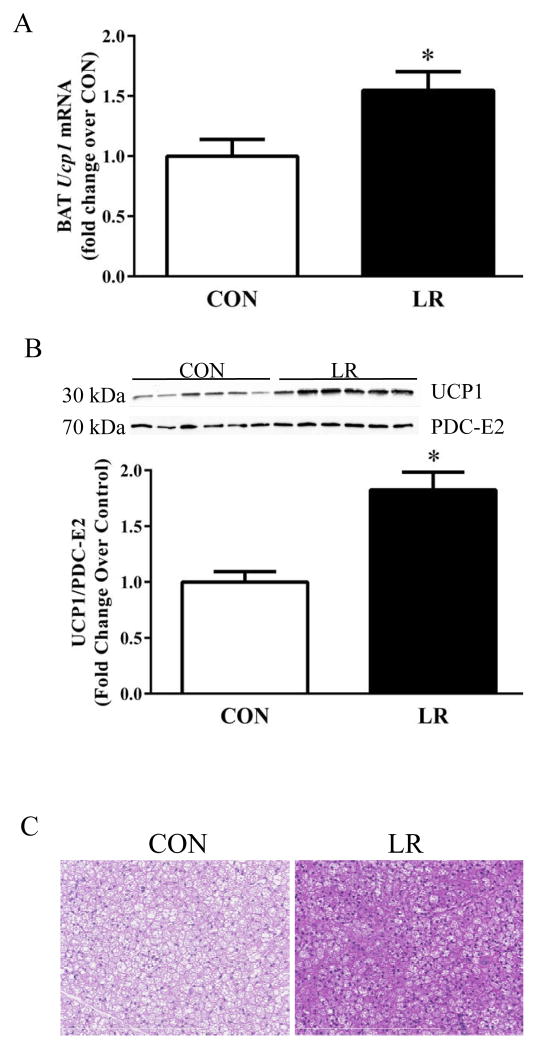
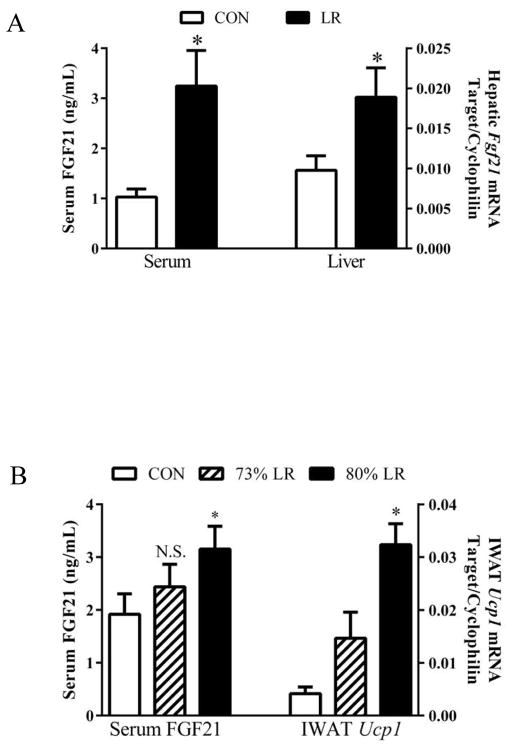
The impact of the diets on remodeling of IWAT was evaluated by measuring diet-dependent changes in expression of genes associated with browning and thermogenesis. LR increased expression of Ucp1, Cidea, Cox7a, and Cox8b mRNA (Fig. 4A) and produced a 6-fold increase in expression of UCP1 protein (Fig. 4B). Remodeling of IWAT was also evaluated using a second, imaging-based approach to detect changes in the number of multilocular cells within the depot. This approach, validated previously (5), is based on identifying cells containing both a green (cell membrane) and red, perilipin signature indicative of multilocular adipocytes. Using this approach to scan entire IWAT tissue sections, LR induced a 10-fold increase in the number of “beige” adipocytes containing multi-locular lipid droplets in the depot (Fig. 4C). LR also caused a significant change in UCP1 expression and cell morphology in BAT, increasing Ucp1 mRNA and protein expression by 1.5-fold and 2-fold, respectively (Fig. 5A&B). The morphological changes are evident in Fig. 5C, where LR caused a decrease in lipid droplet size and an increase in acidophilic staining. Collectively, the observed changes in BAT and WAT are consistent with the SNS-dependent remodeling of adipose tissue and increase in EE observed after cold exposure, leucine deprivation, and methionine restriction [3,9,12–14]. The present findings suggest that LR is increasing EE through the same mechanism to affect SNS-dependent remodeling and activation of thermogenesis in adipose tissue. Recent studies support the view that dietary methionine restriction rapidly and persistently increases hepatic expression and release of FGF21 [8], and FGF21 was shown to act centrally to increase SNS activity, enhance browning of white fat, and increase EE [15–17]. Fig. 6A shows that LR increased hepatic expression of Fgf21 mRNA and produced a corresponding increase in circulating FGF21. In Exp 2, less severe leucine restriction also produced a concentration-dependent increase in plasma FGF21, although only the increase produced by 80% LR reached significance (Fig. 6B). Interestingly, the 73% LR and 80% LR also produced a dose-dependent increase in IWAT UCP1 mRNA (Fig. 6B). Together, these data suggest that the increased browning of WAT produced by LR could be causally-linked to the observed diet-dependent increases in hepatic Fgf21.
Figure 4. Effect of leucine restriction on remodeling of inguinal WAT.
Mice were fed control (CON) or leucine-restricted (LR) diets for 11 weeks prior to harvest of tissue for analysis of (A) mRNA levels of browning genes, (B) western blot of UCP1 protein in IWAT, and (C) representative IHC images of IWAT from mice fed the CON or LR diets. Scale bar: 400 μm. Cell membranes were stained with wheat germ agglutinin (green) and lipid droplet membranes were stained with perilipin (red) to detect multilocular cells. (D) Number of multilocular, beige adipocytes graphed as percent of total adipocytes in each dietary group. Means ± SEM are presented for each variable and based on n=9 animals per group for A, n=6 per group for B, and n=4 per group for C&D. Means annotated with asterisks differ at P<0.05.
Figure 5. Effect of leucine restriction on remodeling of brown adipose tissue.
Mice were fed control (CON) or leucine-restricted (LR) diets for 11 weeks prior to harvest of tissue for analysis of (A) Ucp1 mRNA levels, (B) Western blot of BAT for UCP1 and the loading control PDC-E2, and (C) representative images of H&E stains. Scale bar: 200 μm. Means ± SEM are presented for each variable and based on n=9 animals per group for A, 10 per group for B, and 4 per group for C. Means annotated with asterisks differ at P<0.05.
Figure 6. Effect of leucine restriction on hepatic expression and serum concentrations of FGF21.
Mice were fed control (CON) or leucine-restricted (LR) diets for 11 weeks prior to harvest of tissue and serum for analysis of (A) serum FGF21 concentrations (left) and hepatic FGF21 mRNA (right). (B) Effects of 73% LR and 80% LR on serum FGF21 concentrations (left) and corresponding Ucp1 mRNA expression in IWAT (right). Means annotated with asterisks differ at P<0.05.
Dietary Leucine Restriction alters lipid metabolism in adipose tissue, but not liver
Experiment 3, Cohort 1
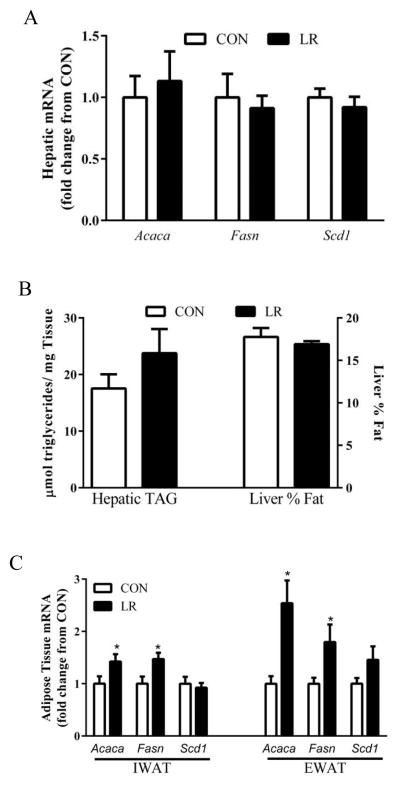
Leucine deprivation was previously shown to decrease lipogenic gene expression in both liver [10] and WAT [3] while methionine restriction decreases lipogenic gene expression in the liver while increasing these genes in WAT [18–20]. The responses to leucine restriction differed from both leucine deprivation and methionine restriction in the sense that hepatic expression of Acaca, Fasn and Scd1 mRNA were unchanged by leucine restriction (Fig. 7A). Liver triglyceride was also unaffected by LR (Fig. 7B), but like methionine restriction, LR increased expression of the lipogenic genes, Acaca and Fasn in IWAT and EWAT (Fig. 7C). Together, these findings suggest that the sensing mechanisms mediating the transcriptional effects of leucine deprivation, methionine restriction, and LR in the liver may be some combination of mechanisms that are specific to the EAA and degree of dietary restriction.
Figure 7. Effects of leucine restriction on markers of hepatic and adipose tissue lipid metabolism.
Mice were fed control (CON) or leucine-restricted (LR) diets for 11 weeks prior to harvest of tissues for analysis of (A) hepatic lipogenic gene mRNA expression (B) hepatic triglyceride content determined by enzymatic, colorometric assay (left) or nuclear magnetic resonance of dissected livers of mice, and (C) mRNA expression of lipogenic genes in the inguinal or epididymal WAT of mice fed CON or LR diets. Means annotated with an asterisk differ from their corresponding control at P<0.05.
Discussion
It has long been recognized that dietary composition plays a deterministic role in overall health [21–24]. Recent work has refocused attention on dietary protein, with special emphasis on how the concentration and composition of dietary protein affects ingestive behavior (29, 32–33), energy balance [25], fecundity [26], and lifespan [27]. The systems which sense and respond to changes in dietary protein remain poorly defined, but since EAAs cannot be synthesized endogenously, the ability to detect and respond to deficiencies in their supply represents an important survival mechanism. Molecular and cellular mechanisms of EAA sensing have been identified (8, 14–15, 34), but the broader and more difficult task is to understand how these EAA responsive systems are functionally organized to produce the complex physiological and behavioral responses that occur when an EAA deficiency is detected.
In the present work, diets with leucine incrementally restricted were used with the goal of determining whether leucine restriction would reproduce the well-established beneficial metabolic responses that occur when methionine is restricted. The default position is that restriction of leucine or any other EAA can fully reproduce the responses produced by methionine restriction. Alternatively, some of the responses to methionine restriction may be specific, and derived from the multiple roles that methionine and its metabolites play in one carbon metabolism and regulation of redox reactions. A second possibility is that dietary leucine restriction will be translated as a less severe form of leucine deprivation, affecting the same responses but producing less robust effects. After careful assessment of a defined set of physiological and biochemical responses to 85% leucine restriction, our findings support the following four conclusions relative to our original hypotheses. First, for most of the monitored responses (e.g., food intake, BW, EE, WAT remodeling, WAT thermogenic and lipogenic genes, liver FGF21, glucose tolerance, fasting insulin, and hepatic Akt activation by insulin), leucine restriction faithfully reproduced the established effects of methionine restriction on these variables (16–17, 22, 26–27, 30, 35–36). Second, a subset of responses to leucine restriction (e.g., liver triglycerides, liver lipogenic genes, insulin-dependent activation of Akt in WAT, BAT and muscle) did not reproduce the effects of methionine restriction on these variables. Third, two of the responses common to leucine restriction and methionine restriction (e.g., increased food intake, increased lipogenic genes in WAT) are completely opposite to the effect of leucine deprivation on these variables (2, 5, 14). Fourth, three of the responses (e.g., increased EE, WAT remodeling, increased WAT thermogenic genes) are similarly increased by leucine restriction, methionine restriction, and leucine deprivation and are thought to be the product of SNS activation (5–6, 30). Collective interpretation of these findings leads to several important conclusions and predictions about the mechanism(s) through which EAA and leucine-modified diets are working. For example, the large cadre of responses found to be similarly regulated by leucine and methionine restriction argues that EAAs are being sensed within a specific concentration range and that these sensing mechanisms orchestrate the components of the response. A second prediction is that restriction of any EAA within this concentration range would reproduce this cadre of responses. With respect to mechanism, since some of the responses appear at different times after introduction of EAA-restricted diets, it seems likely that some of the later developing components may be secondary to earlier components of the response. For example, leucine and methionine restriction increase hepatic transcription and release of FGF21 soon after introduction of the diets, indicating that the liver is a key initial site for sensing and responding to EAA restriction. FGF21 acts directly in peripheral tissues to affect gene expression and increase glucose utilization (7, 12), while also acting centrally to increase SNS activation and increase energy expenditure (10, 25). Recent studies have also shown that leucine deprivation activates the SNS by increasing corticotrophin releasing hormone expression in the hypothalamic paraventricular nucleus [9]. It is unclear whether leucine and methionine restriction act through a similar mechanism to activate the SNS or whether the diet-induced increases in FGF21 are sufficient to produce SNS activation. Future experiments with FGF21 null mice will be important in assessing the importance of FGF21 as a mediator of the effects of EAA restriction.
We also identified a group of responses that were unaffected by leucine restriction but previously reported as highly responsive to methionine restriction. For example, methionine restriction produces a significant down-regulation of lipogenic genes in the liver, a decrease in de novo lipogenesis, and a decrease in hepatic lipids (3, 16), but none of these variables was affected by leucine restriction. These differences suggest the interesting possibility of methionine-specific effects on hepatic lipid metabolism. An alternative interpretation is that the effects of leucine on hepatic lipid metabolism are concentration-dependent since previous work showed that leucine deprivation downregulated genes associated with fatty acid and triglyceride synthesis [10]. It is also possible that the pronounced anorexigenic response to leucine deprivation could be indirectly affecting hepatic gene expression [10,28]. In contrast, support for a methionine-specific effect in the liver comes from recent work showing that the reduction of hepatic glutathione produced by methionine restriction slows the reactivation cycle of the protein tyrosine phosphatase, PTEN [8]. This has the effect of extending the half-life of PIP3 and amplifying PIP3-dependent signaling [8]. It is unclear whether lipogenic gene expression is also down regulated through this mechanism or whether methionine restriction regulates these genes through an altogether different mechanism.
The other significant difference between leucine and methionine restriction was the failure of leucine restriction to enhance insulin-dependent Akt activation in WAT, BAT and muscle, while methionine restriction was effective in all three tissues [8]. Both diets amplified this signaling pathway in liver and produced comparable increases in hepatic transcription and release of FGF21 [8]. Therefore, it was somewhat surprising that leucine restriction failed to enhance insulin signaling in BAT, WAT, and muscle. The enhanced insulin signaling in these tissues after methionine restriction again suggests specific effects that are attributable to methionine and not reproduced by leucine. The underlying mechanism is unclear but may involve unique perturbations of methionine metabolism that influence the synthesis or degradation of signaling molecules as previously described [8].
The present findings provide compelling evidence that restriction of leucine comes close to fully recapitulating the physiological and biochemical responses produced when dietary methionine is restricted. However, like methionine restriction, translational implementation of leucine restriction will require developing palatable diets that selectively limit the leucine content of dietary protein. In the current preclinical context, restricting leucine by 85% of the level of leucine in the control diet was most effective, which is comparable to the 80% reduction of methionine that has proven most effective. Although these findings suggest that restricting other EAAs would be similarly effective, the results also suggest that some of the effects of methionine restriction, particularly on hepatic lipid metabolism, are specific to this EAA. This distinction should prove useful in distinguishing between transcriptional effects linked to EAA signaling and those specific to methionine restriction. Systematic studies will also be required to carefully identify restriction thresholds for each EAA that avoid the food aversive responses produced by EAA deprivation (2, 11, 14). Identifying the respective thresholds for each EAA is an essential next step in advancing our understanding of the sensing and signaling mechanisms that link dietary EAA restriction to the beneficial biological responses that are produced.
Acknowledgments
The authors thank Kodi Bethay for excellent technical support, and Cindi Tramonte for administrative support. This work was supported in part by ADA 1-12-BS-58 (TWG), NIH DK-096311 (TWG), and NIH F32 DK098918 (DW). This work also made use of the Genomics and Cell Biology & Bioimaging core facilities supported by NIH P20-GM103528 (TWG) and NIH 2P30 DK072476.
Footnotes
Disclosure Summary: The authors have no relevant conflict of interest to disclose.
References
- 1.Orgeron M, Stone KP, Wanders D, Cortez CC, Van NT, Gettys TW. In: Progress in Molecular Biology and Translational Science. Tao Y, editor. Academic Press; Auburn, AL: 2014. pp. 351–376. [DOI] [PMC free article] [PubMed] [Google Scholar]
- 2.Anthony TG, Morrison CD, Gettys TW. Remodeling of lipid metabolism by dietary restriction of essential amino acids. Diabetes. 2013;62:2635–2644. doi: 10.2337/db12-1613. [DOI] [PMC free article] [PubMed] [Google Scholar]
- 3.Cheng Y, Meng Q, Wang C, Li H, Huang Z, Chen S, Xiao F, Guo F. Leucine deprivation decreases fat mass by stimulation of lipolysis in white adipose tissue and upregulation of uncoupling protein 1 (UCP1) in brown adipose tissue. Diabetes. 2010;59:17–25. doi: 10.2337/db09-0929. [DOI] [PMC free article] [PubMed] [Google Scholar]
- 4.Xiao F, Huang Z, Li H, Yu J, Wang C, Chen S, Meng Q, Cheng Y, Gao X, Li J, Liu Y, Guo F. Leucine Deprivation Increases Hepatic Insulin Sensitivity via GCN2/mTOR/S6K1 and AMPK Pathways. Diabetes. 2011;60:746–756. doi: 10.2337/db10-1246. [DOI] [PMC free article] [PubMed] [Google Scholar]
- 5.Wanders D, Burk DH, Cortez CC, Van NT, Stone KP, Baker M, Mendoza T, Mynatt RL, Gettys TW. UCP1 is an essential mediator of the effects of methionine restrictin on energy balance but not insulin sensitivity. FASEB Journal. 2015;29:2603–2615. doi: 10.1096/fj.14-270348. [DOI] [PMC free article] [PubMed] [Google Scholar]
- 6.De Sousa-Coelho AL, Marrero PF, Haro D. Activating transcription factor 4-dependent induction of FGF21 during amino acid deprivation. Biochem J. 2012;443:165–171. doi: 10.1042/BJ20111748. [DOI] [PubMed] [Google Scholar]
- 7.Ables GP, Perrone CE, Orentreich D, Orentreich N. Methionine-Restricted C57BL/6J Mice Are Resistant to Diet-Induced Obesity and Insulin Resistance but Have Low Bone Density. PLoS ONE. 2012;7:e51357. doi: 10.1371/journal.pone.0051357. [DOI] [PMC free article] [PubMed] [Google Scholar]
- 8.Stone KP, Wanders D, Orgeron M, Cortez CC, Gettys TW. Mechanisms of Increased in Vivo Insulin Sensitivity by Dietary Methionine Restriction in Mice. Diabetes. 2014;63:3721–3733. doi: 10.2337/db14-0464. [DOI] [PMC free article] [PubMed] [Google Scholar]
- 9.Cheng Y, Zhang Q, Meng Q, Xia T, Huang Z, Wang C, Liu B, Chen S, Xiao F, Du Y, Guo F. Leucine deprivation stimulates fat loss via increasing CRH expression in the hypothalamus and activating sympathetic nervous system. Mol Endocrinol. 2011;25:1624–1635. doi: 10.1210/me.2011-0028. [DOI] [PMC free article] [PubMed] [Google Scholar]
- 10.Guo F, Cavener DR. The GCN2 eIF2alpha kinase regulates fatty-acid homeostasis in the liver during deprivation of an essential amino acid. Cell Metab. 2007;5:103–114. doi: 10.1016/j.cmet.2007.01.001. [DOI] [PubMed] [Google Scholar]
- 11.Orentreich N, Matias JR, DeFelice A, Zimmerman JA. Low methionine ingestion by rats extends life span. J Nutr. 1993;123:269–274. doi: 10.1093/jn/123.2.269. [DOI] [PubMed] [Google Scholar]
- 12.Barbatelli G, Murano I, Madsen L, Hao Q, Jimenez M, Kristiansen K, Giacobino JP, De MR, Cinti S. The emergence of cold-induced brown adipocytes in mouse white fat depots is determined predominantly by white to brown adipocyte transdifferentiation. Am J Physiol Endocrinol Metab. 2010;298:E1244–E1253. doi: 10.1152/ajpendo.00600.2009. [DOI] [PubMed] [Google Scholar]
- 13.Lee YH, Petkova AP, Konkar AA, Granneman JG. Cellular origins of cold-induced brown adipocytes in adult mice. FASEB J. 2014;29:286–299. doi: 10.1096/fj.14-263038. [DOI] [PMC free article] [PubMed] [Google Scholar]
- 14.Plaisance EP, Henagan TM, Echlin H, Boudreau A, Hill KL, Lenard NR, Hasek BE, Orentreich N, Gettys TW. Role of β-adrenergic receptors in the hyperphagic and hypermetabolic responses to dietary methionine restriction. Am J Physiol Regul Integr Comp Physiol. 2010;299:R740–R750. doi: 10.1152/ajpregu.00838.2009. [DOI] [PMC free article] [PubMed] [Google Scholar]
- 15.Douris N, Stevanovic D, Fisher FM, Cisu TI, Chee MJ, Ly NN, Zarebidaki E, Adams AC, Kharitonenkov A, Flier JS, Bartness TJ, Maratos-Flier E. Central Fibroblast Growth Factor 21 Browns White Fat via Sympathetic Action in Male Mice. Endocrinology. 2015;156:2470–2481. doi: 10.1210/en.2014-2001. [DOI] [PMC free article] [PubMed] [Google Scholar]
- 16.Owen BM, Ding X, Morgan DA, Coate KC, Bookout AL, Rahmouni K, Kliewer SA, Mangelsdorf DJ. FGF21 Acts Centrally to Induce Sympathetic Nerve Activity, Energy Expenditure, and Weight Loss. Cell Metab. 2014;20:670–677. doi: 10.1016/j.cmet.2014.07.012. [DOI] [PMC free article] [PubMed] [Google Scholar]
- 17.Fisher FM, Kleiner S, Douris N, Fox EC, Mepani RJ, Verdeguer F, Wu J, Kharitonenkov A, Flier JS, Maratos-Flier E, Spiegelman BM. FGF21 regulates PGC-1alpha and browning of white adipose tissues in adaptive thermogenesis. Genes Dev. 2012;26:271–281. doi: 10.1101/gad.177857.111. [DOI] [PMC free article] [PubMed] [Google Scholar]
- 18.Hasek BE, Boudreau A, Shin J, Feng D, Hulver M, Van N, Laque A, Stewart LK, Stone K, Wanders D, Ghosh S, Pessin JE, Gettys TW. Remodeling the integration of lipid metabolism between liver and adipose tissue by dietary methionine restriction in rats. Diabetes. 2013;62:3362–3372. doi: 10.2337/db13-0501. [DOI] [PMC free article] [PubMed] [Google Scholar]
- 19.Perrone CE, Mattocks DA, Hristopoulos G, Plummer JD, Krajcik RA, Orentreich N. Methionine restriction effects on 11b-HSD1 activity and lipogenic/lipolytic balance in F344 rat adipose tissue. J Lipid Res. 2008;49:12–23. doi: 10.1194/jlr.M700194-JLR200. [DOI] [PubMed] [Google Scholar]
- 20.Perrone CE, Mattocks DA, Plummer JD, Chittur SV, Mohney R, Vignola K, Orentreich DS, Orentreich N. Genomic and Metabolic Responses to Methionine-Restricted and Methionine-Restricted, Cysteine-Supplemented Diets in Fischer 344 Rat Inguinal Adipose Tissue, Liver and Quadriceps Muscle. J Nutrigenet Nutrigenomics. 2012;5:132–157. doi: 10.1159/000339347. [DOI] [PubMed] [Google Scholar]
- 21.Fogelholm M, Anderssen S, Gunnarsdottir I, Lahti-Koski M. Dietary macronutrients and food consumption as determinants of long-term weight change in adult populations: a systematic literature review. Food Nutr Res. 2012;56:19103–19148. doi: 10.3402/fnr.v56i0.19103. [DOI] [PMC free article] [PubMed] [Google Scholar]
- 22.Kratz M, Baars T, Guyenet S. The relationship between high-fat dairy consumption and obesity, cardiovascular, and metabolic disease. Eur J Nutr. 2012;51:418. doi: 10.1007/s00394-012-0418-1. [DOI] [PubMed] [Google Scholar]
- 23.Le KA, Bortolotti M. Role of dietary carbohydrates and macronutrients in the pathogenesis of nonalcoholic fatty liver disease. Curr Opin Clin Nutr Metab Care. 2008;11:477–482. doi: 10.1097/MCO.0b013e328302f3ec. [DOI] [PubMed] [Google Scholar]
- 24.Zivkovic AM, German JB, Sanyal AJ. Comparative review of diets for the metabolic syndrome: implications for nonalcoholic fatty liver disease. Am J Clin Nutr. 2007;86:285–300. doi: 10.1093/ajcn/86.2.285. [DOI] [PubMed] [Google Scholar]
- 25.Laeger T, Henagan TM, Albarado DC, Redman LM, Bray GA, Noland RC, Munzberg H, Hutson SM, Gettys TW, Schwartz MW, Morrison CD. FGF21 is an endocrine signal of protein restriction. J Clin Invest. 2014;124:3913–3922. doi: 10.1172/JCI74915. [DOI] [PMC free article] [PubMed] [Google Scholar]
- 26.Wilder SM, Le Couteur DG, Simpson SJ. Diet mediates the relationship between longevity and reproduction in mammals. Age (Dordr) 2012;35:921–927. doi: 10.1007/s11357-011-9380-8. [DOI] [PMC free article] [PubMed] [Google Scholar]
- 27.Raubenheimer D, Simpson SJ. Integrative models of nutrient balancing: application to insects and vertebrates. Nutr Res Rev. 1997;10:151–179. doi: 10.1079/NRR19970009. [DOI] [PubMed] [Google Scholar]
- 28.Anthony TG, McDaniel BJ, Byerley RL, McGrath BC, Cavener DR, McNurlan MA, Wek RC. Preservation of liver protein synthesis during dietary leucine deprivation occurs at the expense of skeletal muscle mass in mice deleted for eIF2 kinase GCN2. J Biol Chem. 2004;279:36553–36561. doi: 10.1074/jbc.M404559200. [DOI] [PubMed] [Google Scholar]


