Abstract
We investigate the performance of a new thin-film Lu2O3:Eu scintillator for single-cell radionuclide imaging. Imaging the metabolic properties of heterogeneous cell populations in real time is an important challenge with clinical implications. We have developed an innovative technique called radioluminescence microscopy, to quantitatively and sensitively measure radionuclide uptake in single cells. The most important component of this technique is the scintillator, which converts the energy released during radioactive decay into luminescent signals. The sensitivity and spatial resolution of the imaging system depend critically on the characteristics of the scintillator, i.e. the material used and its geometrical configuration. Scintillators fabricated using conventional methods are relatively thick, and therefore do not provide optimal spatial resolution. We compare a thin-film Lu2O3:Eu scintillator to a conventional 500 μm thick CdWO4 scintillator for radioluminescence imaging. Despite its thinness, the unique scintillation properties of the Lu2O3:Eu scintillator allow us to capture single positron decays with over fourfold higher sensitivity, a significant achievement. The thin-film Lu2O3:Eu scintillators also yield radioluminescence images where individual cells appear smaller and better resolved on average than with the CdWO4 scintillators. Coupled with the thin-film scintillator technology, radioluminescence microscopy can yield valuable and clinically relevant data on the metabolism of single cells.
Keywords: radionuclide imaging, radioluminescence, microscopy, cancer metabolism
1. Introduction
Radioluminescence microscopy is a technique to image radionuclide uptake at the single-cell level. In this study, we report the fabrication of a 10 μm thin Lu2O3:Eu scintillator, and compare its radioluminescence performance to a more conventional scintillator. Our goal is to determine the importance of scintillator properties with respect to image quality and spatial resolution. To our knowledge, this is the first reported use of a thin-film scintillator to study the uptake of small radiolabeled molecules in single live cells.
The imaging of metabolic processes in live and intact cells may provide valuable insight into normal cell developmental processes such as stem cell differentiation, as well as abnormal cell behaviors such as cancer. For example, hematopoetic stem cells have been documented to alter their metabolic glucose uptake based on their differentiation potential.[1] Also, the increased metabolic activity of cancers forms the basis of positron emission tomography (PET).[2] The ability to image the uptake of glucose in single cells ex vivo would therefore facilitate the characterization of heterogeneity in cell metabolism with diverse biological applications.
To date, cell metabolism data has typically been measured using bulk methods where cells are either lysed and their metabolites studied using stable isotope labeling,[3] or where entire organs are analyzed using radionuclides and tools such as liquid scintillation counting or gamma counting.[4] While these methods provide important metrics to quantify cell metabolism, they do not capture cell heterogeneity down to the single-cell level. Additionally, many of these methods are terminal in that the cells are destroyed after the data is collected. There are few options available to quantify single-cell metabolism. 2-NBDG, a fluorescent analog of glucose, has been used to quantify glucose metabolism in live cells. However, a report has found that 2-NBDG ceases to be fluorescent once it is taken up by cells.[5]
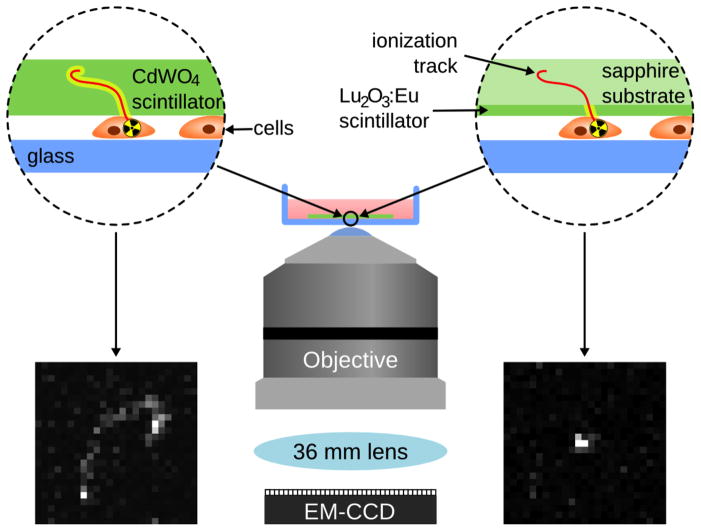
To address this need, we have developed a technique called radioluminescence microscopy that allows us to image the uptake of radiotracers by living cells. This technique has been used to image cancer cells in real time.[6] Using 18F-fluorodeoxyglucose (FDG), a radiolabeled glucose analog widely used in clinical practice, the technique can measure the radiotracer amount, and therefore the glucose uptake, within individual cells.[7] In order to perform this type of imaging, scintillators are used to absorb ionizing radiation and convert it into luminescence.[8] As 18F decays through positron emission, a scintillator near the cells captures this beta decay and converts it into optical photons. These photons can then be imaged with high capture efficiency through the combination of a highly sensitive EMCCD (electron-multiplying charge-coupled device) camera, and a microscopy setup specially optimized for maximizing light collection (Figure 1). In a typical acquisition, each individual positron emission produces an ionization track along its path, yielding many photons wherever its path intersects the scintillator, and these photons can be captured and recorded into an image frame. By combining many such frames, the distribution of the labeled molecule can be inferred and displayed as a radioluminescence micrograph. In contrast to single-molecule fluorescence microscopy, where the light source forms a diffraction-limited point, in radioluminescence microscopy, the light source is an extended, three-dimensional shape, up to 100 μm in length and about 10 nm wide. Within a thick scintillator, light is emitted all along the track, and it can therefore be challenging to localize the origin of the particle. In contrast, when a thin-film scintillator is used, light only emanates from the active volume of the scintillator, which is in close proximity to the cells (Figure 1). As a result, localization of the emitting molecule is greatly enhanced. If single cells in a monolayer are incubated with FDG in glucose-depleted media, they will take up FDG similarly to glucose. FDG will remain trapped in the cells once it is taken up, acting as a positron emitter. When these cells are then imaged, the resultant ionization tracks will be localized to individual cells, allowing for the reconstruction of a radioluminescence image of single cells. Increased glucose uptake will result in a greater number of detected ionization tracks near a given cell. As previously demonstrated, this technique is comparable to fluorescent analogs of glucose[6] and can be used to image live cells in real time.
Figure 1.
Schematic of a typical radioluminescence microscopy setup using a 500 μm CdWO4 scintillator (left) and a 10 μm Lu2O3:Eu scintillator (right). The thin-film Lu2O3:Eu scintillator produces a truncated ionization track as shown here, as compared to the thicker CdWO4 scintillator, which produces a longer ionization track.
2. Results
Scintillators are made of materials that can efficiently absorb ionizing radiation and convert it into light, and choosing the right scintillator material is absolutely critical for radioluminescence microscopy. Although we use a microscope specially designed to maximize the collection and detection of luminescence, detecting very dim scintillation light can be challenging. Furthermore, the energy released during positron decay forms a continuum, ranging from a few keVs to hundreds of keVs. While energetic positrons produce a bright cloud of ionization, weaker ones are more challenging to detect. Thus, the ideal scintillator material should have bright emission, especially in the green-red region where EMCCD cameras have the highest sensitivity, high stopping power for charged particles, low stopping power for secondary emissions (annihilation and Bremsstrahlung photons), low afterglow, high transparency in the visible range, and absolutely no hygroscopicity.
Initial studies using radioluminescence microscopy used a thick CdWO4 scintillator, which was chosen for its low cost and commercial availability. As shown in Table 1, CdWO4 is a dense, non-hygroscopic material, with high stopping power for positrons[9] but with low light yield and emissions mainly in the blue region of the visible spectrum, a suboptimal region for EMCCD cameras.[10] Furthermore, conventional fabrication methods do not permit the construction of CdWO4 scintillators thinner than 100 μm, unless special sol-gel processes are employed.[11]
Table 1.
A comparison of the material properties of Lu2O3:Eu and CdWO4 scintillators.
| Scintillator type | Light yield [photons/keV] | Emission maximum [nm] | Effective Z | Total stopping power [MeV/cm] | Hygroscopic | Thickness [μm] | Density [g/cm3] |
|---|---|---|---|---|---|---|---|
| Lu2O3:Eu | 48 | 610 | 67.3 | 21.4 | No | 6–10 | 9.5 |
| CdWO4 | 12–15 | 480 | 64 | 19.0 | No | 500 | 7.9 |
In contrast, Lu2O3:Eu has an emission maximum of 610 nm (where EMCCD cameras have a greater quantum efficiency) and a light yield three times greater than CdWO4 (Table 1).[10, 12] Furthermore, this unique material has the highest density (9.5 g/cm3) of any known scintillator, meaning that a thin coating of this material should capture enough energy for single radioactive decay events to be detected with high signal-to-noise ratio (SNR). As demonstrated in Figure 1, we expect that the thinness of the Lu2O3:Eu scintillator coupled with its improved scintillation properties should allow us to obtain more sharply resolved radioluminescence images, since individual molecules will be detected more accurately. The synthesis of rare earth-based Eu-doped nanostructures has previously been reported.[13] The Lu2O3:Eu material used in this study is also deposited in a columnar structure, which reduces the light spread within the scintillator layer and focuses the scintillation light towards the camera. In this manner, more of the light is transmitted towards the objective, and less is dissipated towards the sides of the scintillator. Therefore, the Lu2O3:Eu scintillator should enable the capture of a greater number of positrons from radioactive decay events. Functionally, we hypothesize that the tracks captured using the Lu2O3:Eu scintillator will be closer to the position of the positron-emitting cell than when using the CdWO4 scintillator, thereby producing better spatial resolution, as shown in Figure 1.
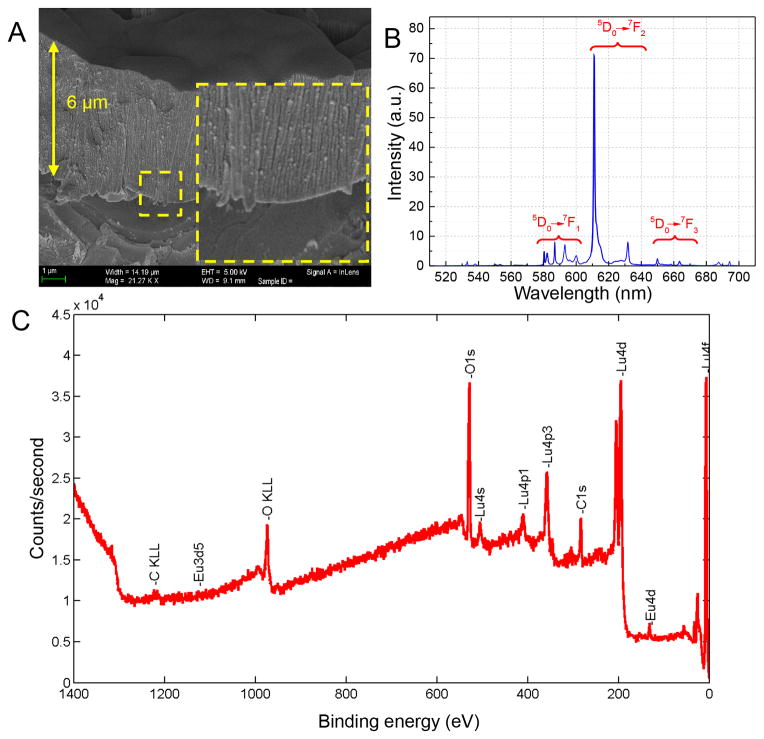
To test our hypothesis, transparent Lu2O3:Eu scintillator coatings are deposited on a sapphire substrate by means of an electron-beam physical vapor deposition technique (EBPVD) [14] with a 5% Eu initial dopant concentration. This method uses a highly energetic electron flux to heat up the refractory oxide above its melting temperature. The resulting Lu2O3:Eu scintillator films measure between 6 and 10 μm in thickness as demonstrated by SEM in Figure 2a. The columnar structure of the scintillator coating is clearly visible. An X-ray excited photoemission spectrum of the deposited film confirms the presence of Lu2O3:Eu, as demonstrated by the 610 nm peak corresponding to the 5D0→7F2 transition (Figure 2b), corresponding to observed spectra in literature.[15] Other transitions are also annotated. Transparency measurements (Figure S1) for substrates to be used for vapor deposition indicate that a sapphire substrate is a more transparent substrate, and performs better than silica. Therefore, the films are deposited on single-crystal sapphire substrates to promote optical transparency. Additionally, elemental analysis (Figure 2c) performed using X-ray photoelectron spectroscopy confirms the presence of Lu2O3:Eu on the sapphire substrate. This analysis demonstrates that the actual concentration of Eu is 2.4%, which is reported to have excellent light yield.[16]
Figure 2.
Figure 2a. Scanning electron microscopy demonstrates that a 6 μm film coating of Lu2O3:Eu has been deposited onto a sapphire substrate. The columnar structure of the material is clearly visible. Figure 2b. 20 keV X-ray excited photoemission spectrum of Lu2O3:Eu. Figure 2c. X-ray photoelectron spectroscopy demonstrates the presence of lutetium, oxygen, as well as the europium dopant.
We then directly compare Lu2O3:Eu scintillators to CdWO4 scintillators using radioluminescence microscopy. In order to directly compare the sensitivities of the two scintillators, we place a known quantity of FDG onto the scintillators. This is done by adding a known amount of FDG to Optimal Cutting Temperature compound (OCT) and quickly freezing the OCT. We then cut thin 10 μm sections using a cryotome, and place these slices directly onto the scintillators for imaging. Autoradiography images demonstrate that the FDG is evenly distributed through the sample (Figure S2). Thousands of individual tracks are imaged and analyzed in order to quantify the differences between the two types of scintillators. Since only the beginning of the track is captured with the thin-film scintillator, the individual radioluminescence track lengths are dramatically different, as demonstrated in Figure 1. We observe that the tracks imaged using the thicker scintillators are longer than the thin film scintillators, matching our initial hypothesis.
We then quantify individual track properties (intensity and area) using a custom algorithm, which automatically identifies, segments, and analyzes individual tracks. Track intensity is determined by summing up the number of photons detected across the entire ionization track. If individual track intensities are lower than the camera noise floor, weaker positrons will not be detected and image quality will be compromised. For the same initial amount of FDG used, we capture and analyze 2,722 tracks for the CdWO4 scintillator and 11,246 tracks for the Lu2O3:Eu scintillator. As demonstrated in Figure 3a, we observe that when individual track intensity is summed up across the length of the track, the Lu2O3:Eu tracks are approximately 60% less intense (mean intensity of 15894±60.57) than the CdWO4 tracks (mean intensity of 38610±402.4). This is primarily due to the fact that individual tracks appear shorter on the thin film Lu2O3:Eu scintillator.
Figure 3.
Figure 3a. When individual track intensities are compared, Lu2O3:Eu scintillators have lower track intensities than the CdWO4 scintillators. Figure 3b. When individual track areas are compared, Lu2O3:Eu scintillators have smaller track areas than the CdWO4 scintillators. Figure 3c. When individual track intensities per area are compared, Lu2O3:Eu scintillators have a higher track intensity per area than the CdWO4 scintillators. For all figures, the black line represents the mean, and the red line represents the median of the data.
Similarly, we compare individual track areas from the two scintillators as shown in Figure 3b, determining the spatial spread of the track itself. If the area of the track is increased, this suggests that the ionization track may be less localized relative to the positron-emitting source. Because of the thinness of the Lu2O3:Eu scintillator, we observe that individual tracks are approximately 70% smaller than for the CdWO4 scintillator. The Lu2O3:Eu scintillator tracks have a mean area of 154±0.61 μm2 as compared to the tracks in the CdWO4 scintillator, which have a mean area of 486±5.7 μm2.
Finally, we compare intensity per area of each individual track for both the CdWO4 and Lu2O3:Eu scintillators in Figure 3c. When individual track intensity is divided by individual track area, we find that the CdWO4 scintillator produces a lower mean intensity per area as compared to the Lu2O3:Eu scintillator. The intensity per area is very significant because the number of pixels over which the light is spread determines the brightness of the image. If the intensity per area is higher, then a brighter image with less noise can be read out from the camera. For the same initial number of radioactive decay emitters, the Lu2O3:Eu scintillator produces a greater number of individual tracks, tracks with smaller area and a greater intensity per square micron. The last two factors imply that the thin film Lu2O3:Eu scintillator performs better in a radioluminescence microscopy setup than the CdWO4 scintillator.
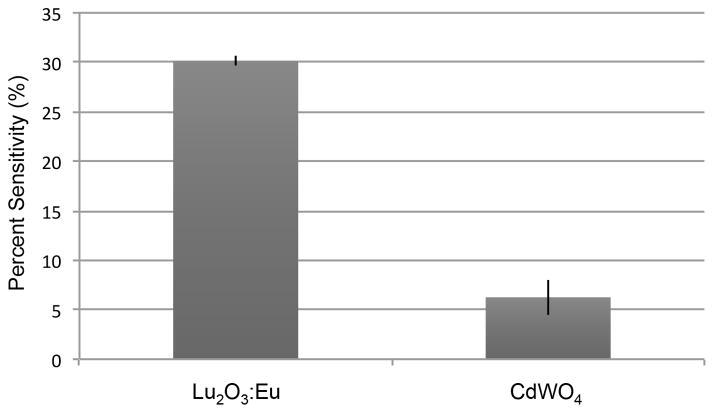
We then use this information to estimate the sensitivity of each of the two scintillators. Since we begin the experiment with a known quantity of positron-emitting FDG, we can calculate the theoretical activity that each scintillator is exposed to. Then, once the radioluminescence image is acquired, a region of interest with a known area is drawn at the center of the image. All the tracks in the region of interest are counted, and the number of frames, the time at which the acquisition is started, and the time taken to acquire the radioluminescence image are used to calculate the measured activity detected by the scintillator. The scintillator sensitivity is computed as the ratio of the theoretical activity to the measured activity. As shown in Figure 4, the average CdWO4 sensitivity is 7.6%, while the Lu2O3:Eu sensitivity is 30.1%. FDG will emit positrons in all directions, so 50% of positrons emitted will be in the opposite direction to the scintillator. Therefore, 50% is the maximum sensitivity that can be physically achieved.
Figure 4.
A comparison of the sensitivities of the Lu2O3:Eu scintillator and the CdWO4 scintillator.
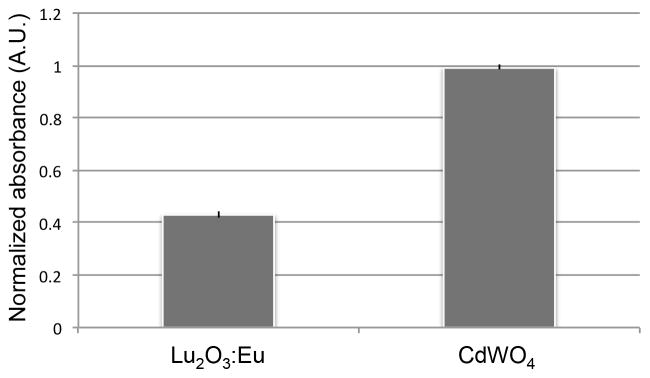
Having determined the relative sensitivities of the two scintillators, we then study their biocompatibility. We have previously established that the cell compatibility of CdWO4 is comparable to that of glass.[6] In this study, we compare CdWO4 to Lu2O3:Eu. As demonstrated in Figure 5, both scintillators exhibit short-term cell biocompatibility. When a WST1 assay is performed on the two scintillators 48 hours after cell seeding, we find that there are approximately 67% fewer cells on the Lu2O3:Eu scintillator than on the CdWO4 scintillator. Greater scintillator sensitivity is therefore offset by worse cell biocompatibility. The Lu2O3:Eu scintillator is therefore optimal for shorter term, more confluent cultures or whole tissue, while CdWO4 may be a more suitable material for rarer cell types or for experiments that require longer term culture or repeated imaging as part of a time-course or time-lapse experiment. It is to be noted that it is possible to image cells using radioluminescence microscopy where the cells are seeded onto a glass dish as opposed to the scintillator surface, and are only in contact with the scintillator briefly during the imaging process itself, which generally lasts for an hour or less. Additionally, the surface of the Lu2O3:Eu scintillator may be further modified with thicker biomaterial-based coatings in order to improve biocompatibility.
Figure 5.
Normalized WST1 comparison of thin film Lu2O3:Eu and CdWO4 scintillators. Both materials demonstrate short-term biocompatibility.
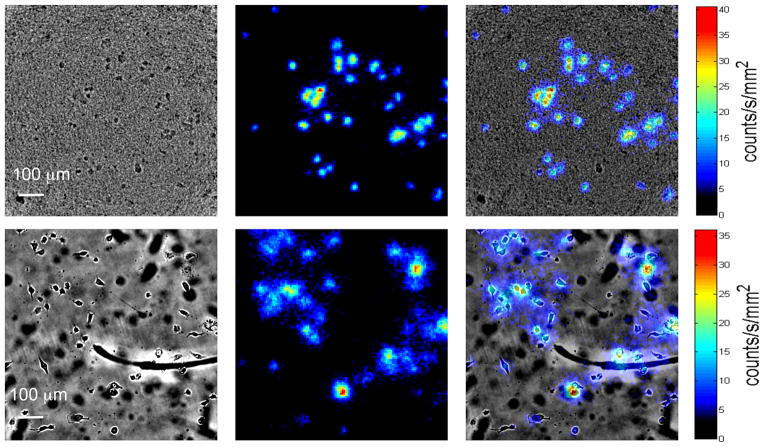
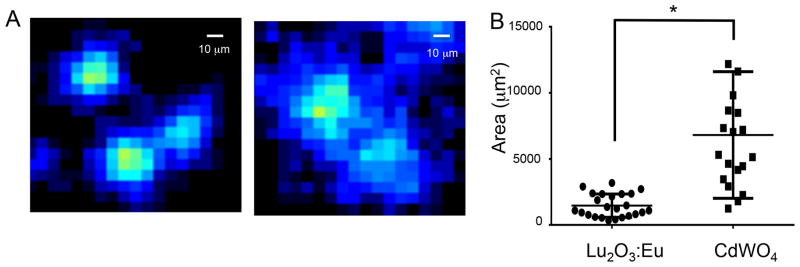
Finally, a cell-based radioluminescence experiment is performed with both scintillators using MDA-MB-231 cells. Cells are first starved of glucose, and then incubated with FDG before being imaged using radioluminescence microscopy. A visualization of the data acquisition process is shown in Supplementary Movie 1. As shown in Figure 6, radioluminescence micrographs demonstrate that cells may be imaged using both types of scintillators. As the overlay panel demonstrates, the radioluminescence signal does in fact localize to individual cells. While cells are visible through the Lu2O3:Eu material, the transparency of the material may also be improved in future iterations with the addition of elements such as gadolinium.[17] As is to be expected, the cell images using the thin film Lu2O3:Eu scintillators are sharper and better resolved than the CdWO4 images (Figure 7a). Using the Lu2O3:Eu scintillator, we are able to distinguish cells that are only 10 μm apart, as opposed to roughly 22 μm for the CdWO4 scintillator. Similar resolution is observed with a second thin film Lu2O3:Eu sample, as demonstrated in Figure S3. Further, when individual cell surface areas are quantified using ImageJ (Figure 7b), we observe that the thin film Lu2O3:Eu scintillators produce significantly smaller areas than the thicker CdWO4 scintillators (p<0.0001; two-tailed t-test), suggesting an improvement in spatial resolution.
Figure 6.
Brightfield, radioluminescence, and overlaid micrographs of MDA-MB-231 cells imaged using Lu2O3:Eu (top) and CdWO4 (bottom) scintillators.
Figure 7.
Figure 7a. Radioluminescence micrographs of Lu2O3:Eu (left) and CdWO4 (right) scintillators. The Lu2O3:Eu scintillators produced more sharply defined images. Figure 7b. When average radioluminescence cell area was quantified in both images, the thin film Lu2O3:Eu scintillator produced smaller cell areas on average than the CdWO4 scintillator. The star indicates statistical significance using a two-tailed t-test, with a p value of 0.0001.
3. Discussion
Similar to other scintillator-based imaging techniques,[18] radioluminescence microscopy uses scintillator properties to study biological processes on a physical scale not previously possible. Our results indicate that the spatial resolution of radioluminescence spectroscopy is dramatically impacted by the properties of the scintillator used. The material of the scintillator, the method of deposition and therefore the nanostructure of the scintillator, and the thickness of the scintillator all contribute to the resolution of the final image. The relative importance of each of these factors, of course, still remains to be determined. Individual scintillator properties must be systematically varied in order to determine the critical parameters of each of these scintillator properties.
One of the surprising findings of our study was that the thin-film Lu2O3:Eu scintillator was almost 4 times as sensitive as the CdWO4 scintillator, despite being many times thinner. This result suggests that the Lu2O3:Eu scintillator is capturing a greater number of lower energy positrons than the CdWO4 scintillator. Radionuclides such as 18F emit beta particles over a wide range of energies, ranging from few keVs to hundreds of keV. While high-energy particles produce bright scintillation flashes, weaker particles are more difficult to detect. The Lu2O3:Eu scintillator can more readily detect such low-energy events because approximately three times more light is emitted per unit of energy absorbed and, furthermore, the columnar structure of the crystal acts as a light guide that efficiently channels the scintillation light towards the camera, preventing it from escaping through the sides. Counterintuitively, the thinness of the crystal also helps the microscope detect more beta particles. Because scintillation only occurs in the thin active area of the scintillator, the tracks have smaller area (Figure 3b) and are easier to localize (Supplementary Movie 1). Therefore, nearly all the tracks captured using the Lu2O3:Eu scintillator can be used for image reconstruction, whereas a large fraction of those captured using CdWO4 are discarded due to their poor quality. Finally, some preliminary computer simulations (data not shown) have suggested that nearly 40% of the energy absorbed by the scintillator is absorbed in the first 10 μm, which perhaps also explains why no drop in sensitivity was observed with the thin-film scintillator.
Dopant concentration may also play an important role in the photophysical properties of lutetium-based scintillator materials in the context of radioluminescence microscopy. Increasing the dopant concentration reduces the distance an exciton has to migrate to transfer its energy to a luminescent center, thus increasing light yield and, in turn, the sensitivity of the microscope. However, higher dopant concentration will not necessarily facilitate greater emission of light after a certain point. As dopant concentration increases, self-absorption of the scintillation light and other factors may result in a net reduction of light yield. Additional research is therefore needed to optimize the dopant concentration of the Lu2O3 material to maximize light emission and minimize self-absorption.
These data indicate that it may be eventually possible to image single cells as part of more confluent cultures or even tissue sections. Alternative radiotracers can also be used to provide non-metabolic data about cells. Radioluminescence microscopy can be used in conjunction with other types of microscopy (such as fluorescent microscopy) to provide multiplexed information about single cell behavior.
4. Conclusion
In conclusion, we have demonstrated that thin-film Lu2O3:Eu scintillators are a compelling alternative to thicker CdWO4 scintillators for radioluminescence microscopy applications. Lu2O3:Eu scintillators demonstrate significantly greater sensitivity and produce brighter ionization tracks (per area). These films can be used to culture cells, and demonstrate short-term biocompatibility, although in their current version they are less biocompatible than CdWO4 scintillators. Finally, the Lu2O3:Eu scintillators also produce radioluminescence micrographs that are better resolved than micrographs derived from CdWO4 scintillators. Lu2O3:Eu scintillators can therefore be used to image radioactive tracers in single cells that are part of more confluent cultures or tissue. The experiments described in this paper provide a foundation for better quantification of single cell metabolic heterogeneity using radioluminescence microscopy.
5. Experimental Section
Scintillator fabrication and characterization
High density europium-doped Lu2O3 was deposited onto c-plane oriented, single-crystal sapphire wafers using the electron-beam physical vapor deposition (EBPVD) method. The target material was synthesized by means of co-precipitation using Lu2O3 and 5% (mol) Eu2O3 powders (Stanford Advanced Materials, Irvine, CA). The powder was calcined in 5 sccm high purity oxygen flow at 1000°C for 2 hours. Then it was isostatically cold pressed into the form of 1″ diameter pellets with an average thickness of 5 mm. The targets were evaporated by electron beam. The substrate was placed above the target and mounted on a heater heated up during deposition to improve crystallinity. SEM was performed using a Zeiss Ultra Plus field emission scanning electron microscope. Transparency was measured with a Stover scatteromoter that uses a red laser to quantify the light transmission and scatter through the sample. The emission spectrum of the Lu2O3:Eu scintillator was taken at the 1-BM-A beam line of the Advanced Photon Source (Argonne National Laboratory, Argonne, IL). The 20 keV X-ray excited photoemission spectrum was recorded using an Andor Neo camera combined with a Shamrock spectrograph. The X-ray flux (if necessary at all) was 2*106 photons/sec. X-Ray photoelectron spectroscopy was done using a PHI VersaProbe Scanning XPS Microprobe, with a depth profiling of 1000 nm. CdWO4 scintillators (1 cm × 1 cm × 0.5 mm; two-sides polished) were ordered from MTI Corporation.
Radioluminescence microscopy setup
All imaging was performed using a bioluminescence microscope (LV200, Olympus) outfitted with a 40X/1.3 NA oil objective (UPLFLN40XO, Olympus), and a deep-cooled electron-multiplying charge-coupled device (EM-CCD; ImageEM C9100-14, Hamamatsu). The C9100-14 CCD is a back-thinned frame transfer device, with a 1024×1024 array of 13 μm×13 μm pixels. The LV200 is also equipped with temperature, humidity, and CO2 regulation for extended live cell imaging. All samples were imaged using 4×4 binning and an electron-multiplication gain of 1200.
Sensitivity characterization
The sensitivity of the two scintillators was calculated by mixing 3.7 MBq of FDG with OCT thoroughly, and quick-freezing the mixture on dry ice. A Microm 550M cryostat microtome was used to cut 10 μm slices of the resultant OCT block. The resulting slices had an activity area concentration of 9.45–10.93 Bq/mm2. A slice was placed directly on the scintillator, and the scintillator was placed in a glass bottom dish with the scintillation surface facing the camera. 3600 frames were acquired, each using a 1 second exposure. Autoradiography images were taken using the Perkin Elmer Cyclone Plus phosphor imager using a multisensitive phosphor screen.
Cell-based radioluminescence experiments and analysis
MDA-MB-231 human breast cancer cells were purchased from the American Type Culture Collection (ATCC, Manassas, VA) and cultured in DMEM (Gibco) medium supplemented with 10% fetal bovine serum. For radioluminescence experiments, the sensitive side of the scintillator plate was adsorbed with fibronectin (10 μg/ml) for 1h. The scintillator was then washed 3x with PBS, and 105 cells were seeded directly onto the scintillator plate. Imaging was performed the following day. The cells were incubated in glucose-free media for 1 hour. The cells were then incubated with FDG (up to 250 Ci/mL for up to 60 minutes) and then imaged using radioluminescence microscopy for up to 30,000 frames (100 ms/frame).
WST1 assay
A WST1 assay (Roche) was performed on cells seeded onto Lu2O3:Eu and CdWO4 scintillators. 105 cells were seeded onto fibronectin-adsorbed scintillators in a 12 well plate, and were cultured for 48 hours. Prior to the assay, the scintillators were transferred to a cell-free 12 well plate so that only the cells on the scintillators were assayed. The results were standardized to absorbance/μm2 and normalized to the CdWO4 scintillator.
Image analysis
Radioluminescence image correction and analysis were performed using MATLAB R2012b (Mathworks, Natick, MA). Radioluminescence micrographs were corrected by subtraction of a dark image, taken with the same exposure time but with a non-radioactive sample in the microscope. These images were further corrected for field flatness using a flat-field calibration map acquired using a uniform distribution of FDG. Gaussian filtering was applied where appropriate to reduce noise. Hot spots produced by gamma rays or annihilation photons were removed by applying a custom algorithm that can detect sharp features well above neighboring pixels. All radioluminescence images were corrected for radioactive decay by using the timestamp of the first acquired image as the reference time point. ImageJ was used to analyze individual cell areas from radioluminescence images by manually circling visible cell areas.
Supplementary Material
Acknowledgments
We acknowledge funding from NIH grants R01CA186275 and 1R43GM110888-01. We thank our collaborators Matthew D. Moore, Russell Woods, Antonino Miceli and Peter Kenesei at the Advanced Photon Source of Argonne National Laboratory, as well as Stanislav Stoupin, beamline scientist at 1-BM-A. We also acknowledge the Stanford small-animal imaging facility and the Olympus Corporation for use of the LV200 microscope. We would like to thank George Montoya and Shawn Scatliffe from the Stanford Radiochemistry facility, and Chuck Hitzman from the Stanford Nanocharacterization Laboratory.
Contributor Information
Debanti Sengupta, Stanford University School of Medicine, A226 Building A, 1050 Arastradero Road, Palo, Alto, CA 94304, USA.
Stuart Miller, RMD, Inc., 44 Hunt Street, Watertown, Massachusetts 02472, USA.
Zsolt Marton, RMD, Inc., 44 Hunt Street, Watertown, Massachusetts 02472, USA.
Frederick Chin, Department of Radiology, Stanford University Medical Center, Stanford, CA 94305, USA.
Vivek Nagarkar, RMD, Inc., 44 Hunt Street, Watertown, Massachusetts 02472, USA.
Prof. Guillem Pratx, Stanford University School of Medicine, A247 Building A, 1050 Arastradero Road, Palo Alto, CA 94304, USA
References
- 1.Simsek T, Kocabas F, Zheng J, DeBerardinis RJ, Mahmoud AI, Olson EN, Schneider JW, Zhang CC, Sadek HA. Cell Stem Cell. 2010;7:380. doi: 10.1016/j.stem.2010.07.011. [DOI] [PMC free article] [PubMed] [Google Scholar]
- 2.Gambhir SS. Nat Rev Cancer. 2002;2:683. doi: 10.1038/nrc882. [DOI] [PubMed] [Google Scholar]
- 3.Fan T, Lane AN, Higashi RM, Farag MA, Gao H, Bousamra M, Miller DM. Mol Cancer. 2009;8:1476. doi: 10.1186/1476-4598-8-41. [DOI] [PMC free article] [PubMed] [Google Scholar]
- 4.Mertens K, Mees G, Lambert B, Van de Wiele C, Goethals I. Cancer Biother Radiopharm. 2012;27:183. doi: 10.1089/cbr.2011.1125. [DOI] [PubMed] [Google Scholar]
- 5.Yoshioka K, Saito M, Oh KB, Nemoto Y, Matsuoka H, Natsume M, Abe H. Biosci Biotechnol Biochem. 1996;60:1899. doi: 10.1271/bbb.60.1899. [DOI] [PubMed] [Google Scholar]
- 6.Pratx G, Chen K, Sun C, Martin L, Carpenter CM, Olcott PD, Xing L. PLoS One. 2012;7:e46285. doi: 10.1371/journal.pone.0046285. [DOI] [PMC free article] [PubMed] [Google Scholar]
- 7.Pratx G, Chen K, Sun C, Axente M, Sasportas L, Carpenter C, Xing L. J Nucl Med. 2013;54:1841. doi: 10.2967/jnumed.112.113365. [DOI] [PMC free article] [PubMed] [Google Scholar]
- 8.Lecoq P, Annenkov A, Gektin A, Korzhik M, Pedrini C. Inorganic scintillators for detector systems: physical principles and crystal engineering. Springer Science & Business Media; 2006. [Google Scholar]
- 9.National Institute of Standards and Technology. Stopping Power and Range Tables for Electrons. 2015 May 12; http://physics.nist.gov/PhysRefData/Star/Text/ESTAR.html.
- 10.van Eijk CW. Nucl Instrum Methods Phys Res A. 2003;509:17. [Google Scholar]
- 11.Lennstrom K, Limmer SJ, Cao G. Thin Solid Films. 2003;434:55. [Google Scholar]
- 12.Lempicki A, Brecher C, Szupryczynski P, Lingertat H, Nagarkar V, Tipnis S, Miller S. Nucl Instrum Methods Phys Res A. 2002;488:579. [Google Scholar]
- 13.Huan J, Hu L, Fang X. ACS Appl Mater Inter. 2014;6:1462. doi: 10.1021/am4037417. [DOI] [PubMed] [Google Scholar]
- 14.Marton Z, Bhandari HB, Brecher C, Miller SR, Singh B, Nagarkar VV. IEEE T Nucl Sci. 2014;60 [Google Scholar]
- 15.Zeler J, Jerzykiewicz LB, Zych E. Materials. 2014;7:7059. doi: 10.3390/ma7107059. [DOI] [PMC free article] [PubMed] [Google Scholar]
- 16.Dujardin C, Garcia-Murillo A, Pedrini C, Madej C, Goutaudier C, Koch A, Petrosyan A, Ovanesyan K, Shirinyan G, Weber M. Synthesis and scintillation properties of some dense X-ray phosphors. presented at Proceedings of the 5th International Conference on Inorganic Scintillators and Their Applications (SCINT99); 1999. [Google Scholar]
- 17.Seeley Z, Dai Z, Kuntz J, Cherepy N, Payne S. Opt Mater. 2012;35:74. [Google Scholar]
- 18.Wang F, Raval Y, Tzeng TRJ, Anker JN. Adv Healthc Mater. 2015;4:903. doi: 10.1002/adhm.201400685. [DOI] [PMC free article] [PubMed] [Google Scholar]
Associated Data
This section collects any data citations, data availability statements, or supplementary materials included in this article.


