

Abstract
The PD-1:PD-L1 immune signaling axis mediates suppression of T cell-dependent tumor immunity. PD-1 expression was recently found to be upregulated on tumor-infiltrating murine (CD11c+CD11b+CD8−CD209a+) and human (CD1c+CD19−) myeloid dendritic cells (TIDC), an innate immune cell type also implicated in immune escape. However, there is little knowledge concerning how PD-1 regulates innate immune cells. In the present study, we examined the role of PD-1 in TIDC derived from mice bearing ovarian tumors. Similar to lymphocytes, TIDC expression of pd-1 was associated with expression of the adapter protein SHP-2, which signals to NF-κB, however, in contrast to its role in lymphocytes, we found that expression of PD-1 in TIDC tonically paralyzed NF-kB activation. Further mechanistic investigations showed that PD-1 blocked NF-kB-dependent cytokine release in a SHP-2-dependent manner. Conversely, inhibition of NF-kB-mediated antigen presentation by PD-1 occurred independently of SHP-2. Collectively, our findings revealed that PD-1 acts in a distinct manner in innate immune cells compared to adaptive immune cells, prompting further investigations of the signaling pathways controlled by this central mediator of immune escape in cancer.
Keywords: Tolerance, tumor microenvironment, myeloid cells, MDSCs, immunity
INTRODUCTION
The immune system has a complex but crucial role in modulating malignancies. Correlations between presence or absence of infiltrating immune cells in the tumor microenvironment (TME) and prognosis have been found in many cancers (1). Infiltrating immune cells in the TME include primarily CD4+ and CD8+ T cells, dendritic cells (DCs), macrophages, and regulatory T-cells (Tregs) (2). Although infiltration by T-cells has been shown to correlate with better outcome, some subsets of adaptive immune system cells, such as regulatory (CD4+CD25+FOXP3+) T cells (Tregs) in ovarian cancer, have been shown to correlate with poor prognosis (3–5). In the context of innate immune cells; while the infiltration of suppressor cells such as myeloid derived suppressor cells (MDSCs) and tumor associated macrophages (TAMs) have been shown to correlate with disease progression and poor prognosis, the role of infiltrating DCs is not clearly understood (6–8). DCs are the sentinel antigen presenting cells (APCs) that shape the outcome of immune response by presenting antigen and providing other necessary signals to T-cells. In various tumors, including ovarian, up to 40% of the infiltrating immune cells comprise of DCs (9, 10), yet their role in TME is debatable due to conflicting observations relating to promotion or control of disease progression (7, 11–14). Recent evidence suggests that tumor-infiltrating DCs (TIDCs), as cancer progresses, may switch their role from immunostimulatory to immunosuppressive (9), which could to some extent shed light on why conflicting observations are made about the role of DCs in the tumors. Such transitions may be facilitated in TME by various soluble factors such as VEGF, IDO, TGF-β1, arginase I, induction of microRNAs, and expression of surface molecules such as TIM-3, PD-L1, and PD-1 (15–20). Our previous work showed that over the course of ovarian cancer progression the TIDCs became increasingly PD-1 positive and that this expression of PD-1 paralyzed the TIDCs by inhibiting their ability to respond via production of cytokines or costimulatory molecules expression (10).
Programmed cell death-1 (PD-1) is an inhibitory receptor that is found primarily expressed on antigen-activated T and B cells. PD-1 expression on tumor-infiltrating T cells is associated with blunted effector responses and exhaustion (21). Upon TCR ligation, PD-1 interacts with its ligand PD-L1, and is phosphorylated on tyrosine residues in the immune receptor tyrosine based inhibitory motif (ITIM) of its cytoplasmic tail followed by recruitment of Src homology domain-containing phosphatase-2 (SHP-2) (22). Activated SHP-2 subsequently dephosphorylates proximal signaling complexes of the TCR like ZAP70/CD3ζ diminishing downstream PI3K and AKT activation leading to inactivation and death of T cells (23). In contrast to T-cells, ligation of PD-1 on B-cells leads to inhibition of B-cell receptor (BCR) signaling via recruitment of SHP-2 to PD-1 cytoplasmic tail resulting in dephosphorylation of BCR-proximal signal transduction molecules like Syk, PLCγ2, and Erk1/2 (24). In addition to its expression on T cells and B-cells, PD-1 is also now known to be expressed on and affect the functions of innate immune cells such as macrophages, monocytes, natural killer (NK) cells and more recently it has been shown to be expressed on dendritic cells (DCs) as well (10). Early evidences suggest that PD-1 suppresses innate cell function (10). However, how PD-1 regulates innate immune cells remains unexplored and of particular importance is whether or not it acts tonically or as co-receptor.
In the present study, we analyzed distal signaling of PD-1 in ovarian TIDCs. We show that PD-1 is expressed on and affect the functions of DCs obtained from human ovarian tumors and ascites. We also show that PD-1 on DCs inhibits the NFκB activation and hence a range of NFκB inducible genes. We further addressed the mechanism by which PD-1 suppresses critical DC functions such as co-stimulatory molecule expression, antigen presentation and cytokine release. Suppression of DC function appears to be largely mediated through SHP-2 dependent inhibition of NFκB activation. However, the findings also suggest that there are SHP-2 independent mechanisms as well. These findings have implications for the development and use of PD-1 and/or PD-L1 blockade therapeutic strategies for cancer immune therapy.
MATERIALS AND METHODS
Animals
Four- to 12-wk-old female C57BL/6J (B/6J) mice from local breeding colonies or the Jackson Laboratory (Bar Harbor, ME) were used for experimentation. Animal care and use was in accordance with institutional guidelines.
DC isolation from patient samples
This study was approved by the Mayo IRB. Blood samples were obtained from normal donors (n=15) and ovarian cancer patients (n=11). Tumor (n=15) and ascites (n=11) samples were obtained from ovarian cancer patients. Tumor specimens were minced into <1 mm3 pieces, isolated into single cells using gentleMACS™ tissue dissociator (Miltenyi, San Diego, CA), passed through a 40μm filter and processed by ficoll gradient as previously described (10, 25). CD1c+ cells used in in vitro assays were isolated from the samples using human CD1c+ (BDCA-1+) DC isolation kit (Miltenyi). Blockade of human PD-1 was accomplished using a purified PD-1 antibody from BioLegend (Cat. # 329912, San Diego, CA).
Cell lines and tumor implantation
ID8 tumor cells, obtained from Dr. K. Roby (University of Kansas) in 2005, were derived from immortalized ovarian epithelial cells generated by repeated passage in culture and were grown in DMEM media (10, 26). They were last authenticated as mouse origin by IDEXX BioResearch in early 2014. Tumor cells (5 × 10⁶ cells/500 μl) were injected intraperitoneally in saline. Tumor and ascites were harvested between 40 and 70 days post implantation.
Leukocyte fractionation and culture
Mouse leukocytes were obtained from B/6J mice spleens by grinding the spleen through a 70-μm nylon cell strainer. The splenocytes were processed as previously described (10). Mononuclear leukocytes from ascites or tumor of tumor-bearing mice were isolated as described previously (25). From single-cell suspensions, unique cells were magnetically isolated using an Automacs sorting machine (Miltenyi) based on the CD11c, CD4 and CD8 microbead isolation kits.
Multiplexed microsphere cytokine immunoassay
Multiplex assays were done as previously described (27). Supernatants were removed from wells containing 2.5 − 5.0 × 10⁵ unstimulated or stimulated DCs derived from ascites of ID8 tumor-bearing mice. Cytokines were measured using multiplex microspheres as per the manufacturer’s direction (Bio-Rad, San Diego, CA).
Flow cytometry
Cell-surface molecule staining and flow cytometry were done essentially as previously described (28). For flow cytometric analysis, a similar number of events, usually 20,000 – 100,000, were collected for all groups. Antibodies against human CD1c-APC, CD19-PerCPCy5.5, PD-1-PE, and CD40-PE, CD80-PE were from eBioscience (San Diego, CA) and BD Biosciences (San Jose, CA) respectively. Anti-mouse SIINFEKL/H-2Kb (25-D1.16 clone) and H-2Kb antibodies were from eBioscience. Isotype-matched nonspecific antibodies were used as controls.
Immunofluorescent staining
CD11c+ cells were purified from ascites of ID8 tumor-bearing mice as described above and plated into chamber slides and then incubated at 37°C for 3 h to allow for adherence. Media was removed, and the cells were washed and further incubated for 2 h with pure hamster anti–mouse PD-1 antibody (10), or appropriate isotype control (eBioscience) in the same media followed by washing twice and further incubation for 1 h with goat anti hamster Alexa Fluor 594 for PD-1. Next, the cells were incubated with purified rabbit anti-mouse SHP-2 antibody (Cell Signaling Technology, Danvers MA) in media for 2 h, followed by 1 h incubation with chicken anti rabbit Alexa Fluor 488 for SHP-2. The chambers were removed, and the slide itself was treated with two drops of Prolong Gold anti-fade reagent (Invitrogen). A coverslip was placed on the slide and allowed to dry overnight. The cells were visualized using a confocal microscope.
Determination of phosphorylated NF-κB p65 in CD11c+ DCs
Phosphorylated p65 in purified ascites derived CD11c+ DCs was evaluated using the PathScan phospho-NF-κB p65 sandwich ELISA kit according to the manufacturer’s instructions (Cell Signaling Technology, Danvers, MA). NFκB Activation Inhibitor VI, BOT-64 from Santa Cruz Biotech was used at 10 μM. PTP IV inhibitor (SHP-2 inhibitor) from EMD Millipore was used at a concentration 2.5 μM. After TIDC isolation from ascites, the cells were allowed to settle overnight in media and were then treated for 2 hrs with inhibitor, DMSO control, or nothing. After 2 hrs, in order to stimulate p65 activity, the cells were then treated for 40 minutes with one of the following: 10 μg/ml anti PD-1 antibody (G4 clone), 10 μg/ml isotype control IgG, or 1 μg/ml LPS. The anti-PD-1 antibody (G4 clone) was produced in hybridoma core at Mayo Clinic, and has been repeatedly shown in literature to be a non-agonist blocking antibody in the settings of cancer and infectious diseases (10, 29–32). The cells were then washed with ice cold PBS, and lysed using the manufacturer’s lysis buffer with PMSF added. The p65 levels were read using Soft Max Pro software (Molecular Devices, Sunnyvale, CA) for HRP-TMB endpoint.
Immunoprecipitation and Western Blot
IκBα antibodies and SHP-2 antibodies were from Cell Signaling Technology, PD-1 and SHP-2 antibodies were from R&D Systems. DCs obtained from ascites were lysed in lysis buffer (150 mM NaCl, 20 mM Tris Cl (pH7.4), 5 mM EDTA, 1 mM CaCl2, 10 mM NaF, 1% Triton X 100, 5% glycerol, HALT phosphatase inhibitor (Thermo Scientific, Waltham, MA), Protease inhibitor, and PMSF). Proteins were immunoprecipitated with polyclonal SHP-2 antibody (Cell Signaling Technology, Danvers MA) or isotype control. Proteins were separated by SDS-PAGE and analyzed by immunoblotting for PD-1 (R&D Systems) and SHP-2 (R&D Systems).
qPCR assay
CD11c+ cells obtained from the ascites of ID8 tumor bearing B6/J mice were treated for 48 hrs with nothing (control), 10 μg/ml αPD-1 antibody (G4 clone), 1 μg/ml LPS, or 10 μg/ml isotype control IgG. Total RNA from treated or untreated CD11c+ cells was extracted using RNeasy plus mini kit from Qiagen according to manufacturer’s protocol. The RNA was reverse transcribed with RT2 first strand kit from Qiagen. RT2 SYBR Green qPCR Mastermix, and Mouse NFκB Signaling Targets PCR Array were purchased from Qiagen and used according to manufacturer’s instructions.
TNFα ELISA assay
For murine TNF-α, ELISA kits from eBioscience were used according to manufacturer’s protocol. CD11c+ cells were isolated from ascites of tumor-bearing mice or humans, settled overnight in culture and then treated with DMSO, 10 μM, 2.5 μM, 1.25 μM PTP Inhibitor IV (SHP-2 inhibitor) from EMD Millipore (Billerica, MA), or 10uM NFKB Activation Inhibitor VI, BOT-64 from Santa Cruz Biotech (Santa Cruz, CA) for 2 hrs. The cells were then treated with 10 μg/ml anti-PD1 antibody (G4 clone), 10 μg/ml isotype control IgG, 10 μg/ml anti-PD-L1 antibody (10B5.2 clone) or 1 μg/ml LPS for 24–40 hrs, after which the supernatants were harvested and TNFα was measured. The TNFα levels were read using “Soft Max Pro” software for a HRP-TMB endpoint. Human IL-6 and TNF-α were measured similarly with relevant kits from eBioscience.
Antigen Presentation Assay
CD11c+ cells isolated from ascites were cultured in vitro in the presence of 10 μg/ml anti-PD1 antibody, 10 μg/ml isotype control IgG, or media alone for 24 hrs. Cells were then analyzed for class I (H-2Kb) expression using flow cytometry. For antigen presentation study, after culture with anti-PD1 antibody or isotype control IgG the DCs were washed with PBS and incubated with either media alone or media containing 4 μg/mL OVA AF647 for 8–9 hrs. Cells were then harvested and analyzed for H-2Kb:SIINFEKL expression by flow cytometry. To determine the role of NFκB and SHP-2 in antigen presentation by DCs, CD11c+ cells were incubated with NFκB Activation Inhibitor VI, BOT-64 and PTP Inhibitor IV (SHP-2 inhibitor) for 2 hrs and then the cells were washed with PBS, were cultured in the presence of anti-PD1 antibody, 10 μg/ml isotype control IgG, or media alone for 24 hrs followed by incubation with OVA-AF647 as described above. For in vivo experiments, mice were treated with 7 doses of 200 μg of anti-PD1 antibody (G4 clone) starting at 25 days post tumor implantation and were injected with 40 μg of OVA AF647 intraperitoneally on the night before the harvest of ascites. Ascites was harvested next day and isolated cells were stained for H-2Kb:SIINFEKL expression and analyzed by flow cytometry. Isotype-matched nonspecific Abs was used as controls.
Statistical analyses
Statistical analysis was performed using GraphPad Prism version 6.00 (GraphPad, San Diego, CA; http://www.graphpad.com). The Student t test, Mann–Whitney U test, or two-way ANOVA test was performed to determine statistically significant difference. A p value <0.05 was considered significant.
RESULTS
PD-1 suppresses cytokine production and co-stimulatory molecules expression by human TIDCs
Several prior studies have demonstrated that TIDCs are immune suppressive (33, 34). Results from our recent work shows that PD-1 is expressed on mouse CD11c+ myeloid TIDCs (hereinafter referred to as TIDCs) in murine models of cancer and PD-1 appears to lock in their immune suppressive phenotype (10, 35). In the present study, we aimed to determine whether human ovarian CD1c+ TIDCs also express PD-1. CD1c is a marker for myeloid DCs in humans but is also expressed on B cells. Thus, single cell suspensions obtained from peripheral blood, tumors and ascites samples of ovarian cancer patients were stained for both CD1c and CD19 markers. As shown in Figs. 1A–B, CD1c+CD19− ascites TIDCs (hereinafter referred as human TIDCs) represent 4.8 ± 0.2% (mean ± s.e.m., n=11) of the total mononuclear cells whereas CD1c+ B cells represent 8.1 ± 0.3% (n=11). The levels of TIDCs in humans are consistent with our prior estimations of 6–10% of the total mononuclear cells in mouse ovarian cancer (10). Furthermore, we found that human ovarian cancer solid tumor contained approximately the same level of TIDCs as 4.3 ± 0.1% (mean ± s.e.m., n=15, p=0.5). As shown in Figs. 1C–D, increased levels of PD-1 expression were observed on the human TIDCS obtained from ascites (MFI 49 ± 6, n=10) and tumor (MFI 62 ± 6, n=15) samples of ovarian cancer patients when compared to DCs derived from the blood of healthy donors (MFI 11 ± 0.5, n=15). Differential expression of PD-1 was also confirmed using RT-PCR and although a weak signal was observed with DCs derived from the blood of healthy volunteers, this did not manifest as cell surface expression. (Supplementary Figure S1). This supports the conclusion that PD-1 expression is driven via DC intrinsic transcription rather than protein transfer in the tumor microenvironment. Additionally, the data show that up regulation of PD-1 on myeloid DCs only occurs in the tumor microenvironment and not in the periphery of the same patients as the PD-1 MFI of the peripheral blood myeloid cells was 11 ± 6 (n=11). Thus, these results demonstrate that PD-1 is restrictively expressed in the human cancer microenvironment.
Figure 1. PD-1 is up regulated on human TIDCs but not on peripheral CD1c+ DC.

Panel A shows the distribution of CD1c and CD19 staining in tumor specimens in a representative dot plot. Panel B shows the individual and mean (±s.e.m.) levels of both CD1c+CD19− TIDCs and CD1c+CD19+ B cells in 11 ovarian ascites specimens. Representative staining of PD-1 on CD1c+CD19− TIDCs is shown in Panel C. Panel D shows individual and mean (±s.e.m.) PD-1 staining on CD1c+CD19− DCs from 15 normal healthy volunteer blood samples, 11 ascites specimens, 11 patient blood samples, 15 ovarian tumor cancer specimens. P values were calculated with a Student’s T test. Inset values show fold increase (±s.e.m.) in PD-1 expression (MFI=mean fluorescence intensity) relative to normal healthy PBMC-derived CD1c+CD19− DC.
Given the role of PD-1 on TIDCs in regulating their immunostimulatory functions (10), we wanted to determine whether PD-1 expressed on TIDCs in human cancer microenvironment regulates cytokine production and co-stimulatory molecules expression. CD1c+CD19− cells obtained from tumors were treated overnight with blocking anti-PD1 antibody and 48 hrs following incubation supernatants were measured for TNF-α and IL-6. As shown in Figs. 2A–B, treatment resulted in a significant increase in the release of cytokines TNF-α and IL-6 when compared to treatment with isotype antibody. Similarly, as shown in Figs. 2C–D, we observed that blockade of PD-1 increased expression of co-stimulatory molecules CD80 and CD40 on TIDCs. No effect of treatment with anti-PD1 antibody was observed on DCs obtained from peripheral blood of healthy donors as would be expected given the low levels of PD-1 expression in blood-derived DCs. Thus, the behavior of PD-1 on TIDCs that is seen in mice is relevant to human disease.
Figure 2. PD-1 suppresses cytokine production and co-stimulatory molecules expression on human TIDCs.

Panels A–B show mean levels (±s.e.m., n=4) of TNF-α and IL-6, respectively, in the culture media following treatment of human ovarian TIDCs with anti-PD1 antibody (αPD-1) or isotype control antibody (ISO). Panels C-D shown mean (± s.e.m., N=4–6) levels, measured as mean fluorescent intensity (MFI) of CD80 and CD40, respectively, on CD1c+CD19− cells derived from the peripheral blood on healthy volunteers (HV), ovarian cancer ascites and tumor samples, after in vitro treatment with isotype control antibody (ISO), or anti-PD1 antibody (αPD-1). Representative histograms also accompany each of Panels C and D. P values were calculated with a Student’s T test.
PD-1 regulates expression of NFkB targets in murine TIDCs
The role of PD-1 in regulating T cell function has been well studied (36) and we recently showed that PD-1, expressed on TIDCs, upon its interaction with PD-L1, suppressed cytokine production and this suppression was reversed up on in vitro treatment of PD-1+ DCs with anti-PD1 blocking antibody (10). DCs have been shown to exhibit the trogocytosis function to pick up proteins and use them as functional components (37). To provide evidence that the PD-1 expression observed on the TIDCs is driven via DC intrinsic transcription, we show using RT-PCR that TIDCs express high levels of PD-1 mRNA (Supplementary Fig. S2). In the present study, we hypothesized that PD-1 inhibits expression of genes that are responsive to NFkB activation. To address this, the expression of 84 key genes regulated by NFkB signaling in ID8-derived CD11c+ cells treated with anti-PD1 antibody was determined. PD-1 blockade increased the expression of (64 of 84 genes, > 2-fold increase) the majority of NFkB target genes in DCs and this effect was higher than the up regulation of NFkB target genes observed in the DCs treated with LPS, the latter of which is consistent with prior findings that LPS-induced activation of cytokine gene expression is suppressed in TIDCs as compared to bone marrow-derived DCs (10)(Figs. 3A–C). These results show that PD-1 expressed on ovarian tumor-derived CD11c+ cells globally inhibits NFkB-responsive gene transcription, thus suggesting that the effects of PD-1 on paralyzing TIDCs are in part due to blocking NFkB activation.
Figure 3. PD-1 on mouse TIDCs regulates activation of NFkB.

Shown is the fold regulation of (relative to untreated DC) expression of NFkB target genes in tumor-infiltrating DCs treated for 48 hrs with anti-PD-1 antibody, LPS and Isotype control antibody. Panel A shows fold change for genes upregulated by ≥ 10 fold by anti-PD-1 treatment, Panel B for genes upregulated 5–10 fold and Panel C for genes upregulated < 5 fold. Representative of 2 experiments yielding similar results.
PD-1 regulation of cytokine production and co-stimulatory molecules expression by mouse TIDCs is IKK dependent
The IkBα protein inhibits NFkB proteins by keeping them in an inactive state. Canonically, upon ligand-mediated IKK activation, degradation of IkBα ensues leading to entry of free NFkB dimers into the nucleus to mediate transcription. Alternatively, non-canonical pathways have also been reported (38). Thus, we asked whether PD-1 regulation of NFkB activation in TIDCs is mediated through IkBα protein degradation using immunoblotting. As shown in Fig. 4A, treatment of TIDCs with anti-PD1 antibody resulted in the degradation of IkBα, showing that PD-1 interacts with the canonical NFkB pathway. In our prior work, as well as the present work, we showed that PD-1 regulates cytokine production and co-stimulatory molecules expression by TIDCs (10). Thus, we asked whether increase in the production of cytokines (IL-10, IL-6, IL-12(p70), G-CSF and TNF-α) and expression of co-stimulatory molecules (CD40, CD80 and CD86) by ovarian TIDCs upon PD-1 blockade is mediated by the canonical NFkB pathway. As shown in Figs. 4B–E, the effect of PD-1 blockade on cytokine release was completely reversed by the inclusion of the NFkB Activation Inhibitor VI, BOT-64 which is a cell-permeable benzoxathiole compound that inhibits IKK-β. There was no difference in viability of cells between those that were treated or untreated with the inhibitor (data not shown). Our analysis showed that inhibition of IKK-β also reversed, albeit not completely, anti-PD-1-induced increased of co-stimulatory molecules CD40, CD80 and CD86 expression by TIDCs (Figs. 4F–H). In control experiments, we observed that phosphorylation of NFkB subunit p65 induced by PD-1 blockade was reversed by the inclusion of IKK-β inhibitor for both anti-PD-1 treatment and LPS (Fig. 4I). Lastly, we also show that PD-L1 blockade using anti-PD-L1 antibody increases the cytokine production (e.g. TNF-α) by TIDCs similar to the effects seen with anti-PD-1 antibody (Fig. 4J); hence confirming that the anti-PD-1 mediated effects are due to disruption of PD-1:PD-L1 axis activation. These results show that PD-1 regulates cytokine production and co-stimulatory molecules expression by ovarian TIDCs through blockade of the canonical NFkB pathway, which represents a newly identified signaling pathway for PD-1.
Figure 4. PD1 may regulate mouse TIDCs function through the classical NFkB pathway.

Panel A shows a representative blot of IkBα levels in ID8 derived TIDCs treated for 30 minutes with control vehicle, anti PD-1 antibody, isotype control antibody or LPS. Panels B–E shows the mean (± s.e.m., N=2–3 replicates levels of TNF-α, IL-6, G-CSF and IL-10, respectively, in the culture media following treatment of ID8 derived TIDCs with anti-PD-1, isotype antibody and LPS with or without IKK inhibitor. Representative of 2 experiments yielding similar results. Panels F–H show mean (±s.e.m., N=2 replicates) CD40 (Panel F), CD80 (Panel G) and CD86 (Panel H) expression on ID8 tumor derived DC treated in vitro with anti-PD1 blocking or isotype antibody in the presence or absence of IKK inhibitor. Representative histograms also accompany each of Panels F–H. Panel I shows the mean (± s.e.m. N=6) phosphorylated p65 levels (measured in absorbance units, Abs) in ID8 derived TIDCs treated identically to that in panels B, C, D and E. Figure S2. Blockade of PD-1: PD-L1 signaling axis enhances TNF-α production by TIDCs. Panel J shows the mean (± s.e.m., N=3) pg/mL values of TNF-α in culture supernatants released by TIDCs from the ascites which were cultured for 24 hrs in the presence of 10μg/mL of anti-PD-1 antibody (α-PD1), 10μg/mL of anti-PD-L1 (α-PDL1) antibody, or media alone (Control).
PD-1 regulated antigen presentation and MHC class I expression by mouse TIDCs is dependent on canonical NFkB pathway
It is well known that expression of co-stimulatory molecules (CD40, CD80 and CD86), MHC molecules and production of immuno-stimulatory cytokines (IL-12 and TNF-α) by DCs is critical in inducing T cell activation. Yoshimura and colleagues showed that expression of co-stimulatory molecules, MHC molecules and production of immune stimulatory cytokines by DCs is regulated by NFkB activation (39, 40). As we have shown previously that PD-1 blockade on ovarian TIDCs leads to enhanced stimulation of T cells as evidenced by enhanced proliferation of T cells in mixed lymphocyte reaction (MLR) assays (10) and leads to enhanced expression of co-stimulatory molecules expression on murine (10) and human (Figs. 2C–D) TIDCs, we asked whether PD-1 expressed on TIDCs regulates antigen presentation. As shown in Fig 5A–B, ovarian TIDCs, pulsed with either SIINFEKL or ovalbumin (OVA) in the presence of anti-PD-1 demonstrate enhanced activation of OT-1 T cells. Although increased cytokine and/or co-stimulatory molecule expression could account for the enhanced activation, we also examined the effects of blocking PD-1 in enhancing the expression of peptide:MHC complexes on the surface of TIDCs. As shown in Fig. 5C, TIDCs treated with PD-1 blocking antibody (in vitro) for 24 hrs followed by pulsing with ovalbumin protein showed increase in Class I: SIINFEKL complexes expression on the surface compared to isotype antibody treated or untreated TIDCs. In vivo, similar results were observed on the TIDCs obtained from the ascites of ID8 ovarian tumor-bearing mice that are treated with PD-1 blocking Ab and injected with OVA as described in materials and methods (Fig 5D). There was no difference in the antigen uptake by DCs from different treatment groups (Fig 5E–F); suggesting that difference in uptake was not the mechanism behind enhanced antigen presentation by these DCs. Thus, increased MHC class I expression was also examined following in vitro treatment of tumor-derived DCs with anti-PD-1. As shown in Fig 5G, ID8 tumor-derived DCs when treated with anti-PD-1 for 24 hrs in vitro showed increased Class I expression, which was also recapitulated with in vivo PD-1 blockade (Fig. 5H). These results suggest that PD-1 on TIDCs suppresses antigen presentation through blocking of surface expression of MHC class I leading to reduced T cell activation.
Figure 5. PD-1 regulates antigen presentation by mouse TIDCs which is mediated by NFkB pathway.
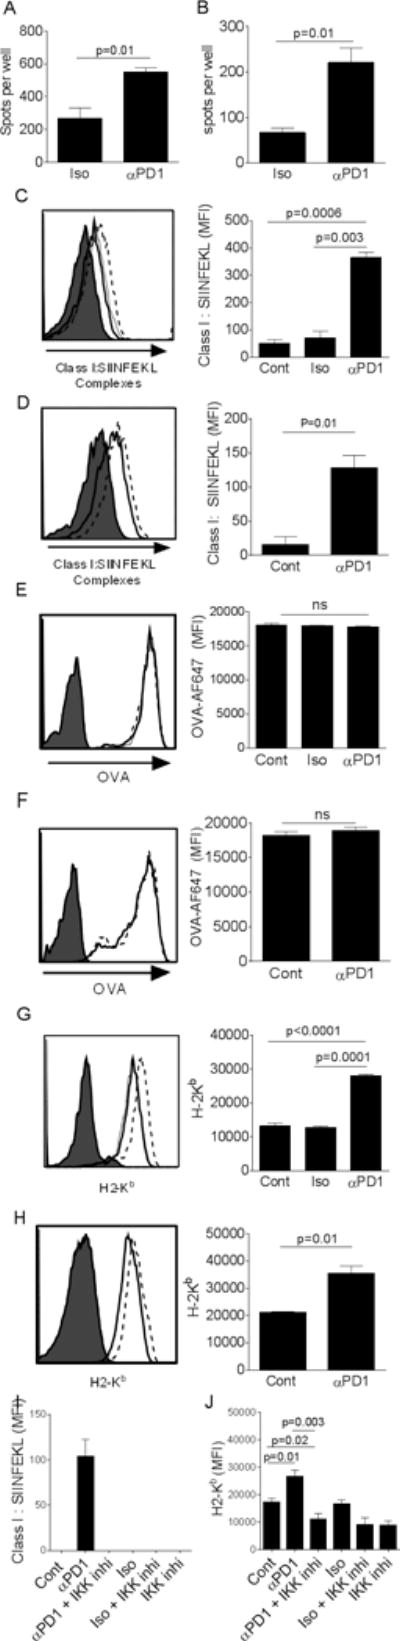
Panels A–B show mean (±s.e.m., N=3 replicates) numbers of IFN-γ ELIspots (spots) observed following exposure of in vivo-primed OT-1 T cells to either isotype-treated or anti-PD-1-treated ovarian TIDCs pulsed with cognate ovalbumin-derived H-2Kb peptide SIINFEKL (Panel A) or whole ovalbumin protein (Panel B). Panels C–D shows representative flow cytometry histograms and bar graphs of mean (±s.e.m., N=3–4 replicates) Class I (H2-Kb):SIINFEKL complexes on ovalbumin protein pulsed TIDC either untreated (solid line), treated with isotype antibody (dotted line) or anti-PD-1 blocking antibody (dashed line). Panels E–F shows representative flow cytometry histograms and bar graphs of mean (±s.e.m., N=3–4 replicates) levels of OVA-AF647 in tumor-derived DC either untreated (solid line), treated with isotype antibody (dotted line) or anti-PD-1 blocking antibody (dashed line). Panels G–H shows representative flow cytometry histograms and bar graphs of mean (±s.e.m., N=3–4 replicates) Class I (H2-Kb) expression on TIDCs either untreated (solid line), treated with isotype antibody (dotted line) or anti-PD-1 blocking antibody (dashed line). Cells in Panels C, E and G were treated in vitro and cells in Panels D, F and H were treated in vivo with antibodies. Filled histograms represent the isotype stain (C,D,G,H) or background signal from unpulsed cells (E,F). Panels I–J show mean (±s.e.m., N=3–4 replicates) Class I (H2-Kb):SIINFEKL complex (Panel I) or Class I (H2-Kb) expression (Panel J) on TIDCs treated in vitro with anti-PD-1 blocking or isotype antibody in the presence or absence of IKK inhibitor. The filled histograms for all panels represents isotype control staining.
Lastly, an analysis, similar to that for cytokine release and co-stimulatory molecules expression, addressing the role of NFkB in antigen presentation was also done. As shown in Figs. 5I–J, the increased MHC class I and MHC class I:SIINFEKL complex expression observed with anti-PD-1 was completely reversed by the inclusion of IKK inhibitor BOT-64. Collectively, these results show that PD-1 regulates MHC class I expression and antigen presentation by ovarian TIDCs and this is dependent on the activation of canonical NFkB pathway.
PD-1 on mouse ovarian TIDCs is associated with SHP-2
The interaction of PD-1 on T cells with its ligand PD-L1 phosphorylates tyrosine residues in the immunoreceptor tyrosine based switch motif (ITSM) of the PD-1 cytoplasmic tail which leads to recruitment of SHP-2 (41). Upon recruitment, SHP-2 inhibits the downstream signaling molecule phosphatidylinositol 3 kinase (PI3K) which further results in inhibition of T cell activation (36). As shown in Figs 6A–B, using immunofluorescence and immunoprecipitation analyses, respectively of TIDCs, we found that PD-1 expressed on TIDCs is associated with SHP-2 by both immunocytochemical staining and co-immunoprecipitation assays. To determine if SHP-2 in PD-1+ TIDCs had any role in regulating NFkB and cytokine production, we used the relatively specific SHP-2 inhibitor PTP Inhibitor IV. As shown in Fig. 6C, we found that phosphorylation of NFkB subunit p65 induced by PD-1 blockade was significantly, albeit incompletely, reversed by the inclusion of the SHP-2 inhibitor. As a result, TNF-α release induced by PD-1 blockade was also suppressed (Fig. 6D). In contrast, however, to p65 phosphorylation and cytokine release, increased co-stimulatory molecules expression, antigen-presentation, and MHC class I expression was not dependent on SHP-2 as treatment with inhibitor had no impact (Figs 6 E–I). Thus, these results suggest that SHP-2 has important role in mediating PD-1 regulated cytokine production and NFkB activation by ovarian tumor DCs but does not have any role in mediating PD-1 regulated co-stimulatory molecules expression and antigen-presentation by ovarian TIDCs.
Figure 6. PD1 on mouse TIDCs is associated with SHP-2 and PD1-regulated mouse ovarian TIDCs function is dependent on (NFkB activation, cytokine production) and independent (co-stimulatory molecules expression, antigen presentation) of SHP-2.

Panel A shows photos of ascites TIDCs demonstrating co-expression of PD-1 and SHP-2. Left panel shows PD-1 expression (red signal), middle panel shows SHP-2 expression and right panel shows SHP-2 interaction with PD-1 (combined signal seen in purple). Panel B shows immunoblots of PD-1+ TIDCs derived from ascites showing the association between PD-1 and SHP-2. Cell lysate obtained from ascites-derived TIDCs was immunoprecipitated with anti-SHP2 antibody (lane 1), rabbit antibody (lane 2) and the immunoblot was probed with anti-PD1 antibody. Lanes 3 and 4 represent no protein and whole cell lysate controls, respectively. Shown is the immunoblot which is representative of one of three experiments with similar results. Panel C shows the mean (± s.e.m. N=6) phosphorylated p65 levels (measured in absorbance units, Abs) in TIDCs treated with anti-PD-1 antibody, isotype antibody and LPS with or without SHP-2 inhibitor. Panel D shows the mean (± s.e.m. N=3) levels of TNF-α in the culture media of TIDCs treated identically to that in Panel C. Panels E–G show mean (±s.e.m., N=2 replicates) CD40 (Panel E), CD80 (Panel F) and CD86 (Panel G) expression on TIDCs treated identically to that in panel C. Panels H–I show mean (±s.e.m., N=3–4 replicates) Class I (H2-Kb):SIINFEKL complex (Panel H) or Class I (H2-Kb) expression (Panel I) on TIDCs treated identically to that in Panel C. P values were calculated using Student’s T test. NS=not significant.
DISCUSSION
The present work revealed several novel mechanistic aspects associated with PD-1 signaling in TIDCs. First and most importantly, it appears that PD-1 is upregulated exclusively in the tumor microenvironment on TIDCs in human and mouse ovarian cancer and PD-1 expressed on mouse TIDCs results in general suppression of NFkB activation by preventing activation of IKK and degradation of IkBα. Second, it was found that PD-1 expressed on TIDCs interacts with SHP-2 as observed in lymphocytes. Third, we observed that the PD-1-mediated suppression of cytokine production, antigen presentation and co-stimulatory molecule expression is mediated secondary to suppression of NFkB activation. Lastly, SHP-2 was only important in cytokine release whereas its blockade had no impact on antigen-presentation or cell surface co-stimulatory molecules thus pointing to multiple NFkB-dependent signaling circuits used by PD-1.
While resting T cells do not express PD-1, it is upregulated following TCR ligation (41, 42) and subsequent NFAT2 translocation to the nucleus (43). Lacking a TCR, TIDCs must therefore upregulate PD-1 through a different mechanism such as reverse signaling through co-stimulatory molecules or cytokines, which remains to be explored. PD-1 is likely to be upregulated directly in the tumor microenvironment since we are not able to detect upregulation in systemically circulating DCs in both humans and mice with tumors (10). Although NFAT2 expression has not been reported in DCs, the Pdcd1 gene locus is known to harbor several transcriptional factor binding sites that may be involved in upregulation of PD-1 (44). One key example is STAT3 which is expressed in DCs and activated in response to multiple regulatory cytokine signals such as IL-10, a cytokine present in the ovarian cancer microenvironment (45). Prior work has shown that IL-10 driven STAT3 activation in DCs impairs maturation and function. Future studies could be aimed at determining whether DC impairment mediated by immune suppressive cytokines such as IL-10 are in fact mediated secondary to upregulation of PD-1 (46). Importantly, our results suggest, in contrast to current thinking, that the anti-tumor effects of PD-1 blockade are not necessarily solely mediated through blocking PD-1 on T and B cells (47).
The proximal and distal PD-1 signaling pathways associated with T cell exhaustion has been extensively studied, but the downstream pathway has yet to be well characterized (23, 36, 41, 48). In the present manuscript, we report for the first time that the NFkB activation is involved in the immune regulatory actions of PD-1. Ligation of PD-1 on T cells during TCR ligation phosphorylates tyrosine residues present in ITSM motif in the PD-1 cytoplasmic tail followed by the recruitment of phosphatases to ITSM motif (41) resulting in the preventing activation of Akt, Ras and MEK signaling (48, 49). The downstream effectors involved in PD-1 mediated suppression of T cell function include transcription factors including the retinoblastoma gene product, E2F and SMAD3 (49). This chain of events following PD-1 ligation on T cells culminates in an increase in apoptosis, loss of proliferative capabilities, decreased glucose metabolism, and blunted IL-2 production by T cells (48). In the present study, it is shown for the first time that PD-1 also modulates the canonical NFkB pathway regulating activation of IKK and degradation of IkBα. We previously reported that both cytokine production and cell surface co-stimulatory molecules are suppressed by PD-1 expression at the cell surface in DCs. In the present report, we find that the up-regulation of both cell surface molecule expression and cytokine production following PD-1 blockade involved NFkB. Although cytokine production was completely ablated with the inclusion of an IKK inhibitor, co-stimulatory expression was only partially blocked indicating involvement of other non-IKK pathways or incomplete penetrance of the IKK inhibitor. Given that there is an increase in the production of immunoregulatory cytokines such as IL-6 and TNF-α upon PD-1 blockade which is regulated by classical NFkB pathway in TIDCs as shown by our data, future studies aimed at understanding their respective roles (i.e., beneficial or detrimental) need to be done (10).
In addition to these critical DC functions, we also report for the first time that antigen processing and presentation is also suppressed by PD-1 expression. Not all aspects of antigen processing and presentation were affected. Specifically, we found that antigen uptake was not impacted by PD-1 rather only MHC class I peptide complex expression. Total levels of MHC class I at the cell surface also increased as well, although total class I expression remained high even when PD-1 was expressed. Furthermore, the impact of PD-1 blockade appeared to be completely dependent on the canonical NFkB pathway. There are several potential points of intersection of the PD-1 and NFkB in regulating MHC class I antigen presentation, as recently reviewed by Watts, and include MHC synthesis, turnover, trafficking and the cross-presentation machinery (50).
Although not a surprising finding, in this study we observed that PD-1 expressed on TIDCs is associated with SHP-2. Our data also showed that treatment of tumor DCs with SHP-2 inhibitor followed by in vitro PD-1 blockade blunted p65 phosphorylation and inhibited cytokine production. Although this data does not indicate that the PD-1 associated SHP-2 is directly regulating NFkB activation in TIDCs, it suggests that SHP-2 in TIDCs plays critical role in inducing NFkB activation up on PD-1 blockade. The role of SHP-2 in inducing NFkB activation has been demonstrated in prior studies. For example, You and colleagues showed an association of SHP-2 with IKK and SHP-2/IKK complex in fibroblasts enhanced the IL-6 production by these cells in response to IL-1α and TNF-α (51). We speculate that engagement of PD-1 on TIDCs with its ligand limits or inhibits SHP-2 interaction with activators of NFkB pathway in these cells there by blunting NFkB activation. Thus, it is possible that the role played by SHP-2 in PD-1-induced immunosuppression in TIDCs is different than the role played by it in PD-1 signaling in T cells. We also observed that PD-1 regulated antigen presentation and co-stimulatory molecules expression were independent of SHP-2. This suggests the involvement of complex signaling network which is partially dependent on SHP-2 in regulating the immune suppressive PD-1+ TIDCs. PD-1 is also known to activate other regulatory molecules including SHP-1which could mediate the suppressive effects of PD-1 in dendritic cells (22, 41).
Several PD-1 pathway blockers have shown robust activity in trials and two blockers, pembrolizumab and nivolumab, have been recently approved by the FDA for use in refractory melanoma and non-small cell lung cancer (52–54). As a result, PD-1-induced exhaustion of T cells and the associated signaling pathways are being extensively studied to design the strategies that can enhance cancer vaccines efficacy by reversing the PD-1-mediated immunosuppression of T cells. Our findings that PD-1 paralyzes TIDCs warrants further understanding of signaling pathways in these central mediators of adaptive and innate immunity. Data obtained in this study gives a new insight and will leverage future studies aimed at understanding and targeting immune suppressive TIDCs and the PD-1/PD-L1 regulatory axis.
Supplementary Material
Acknowledgments
The authors would like to acknowledge the help of Dr. Michael P Gustafson of Human Cellular Therapy Laboratory at Mayo Clinic for facilitating access to tumor samples, blood samples from ovarian cancer patients. The authors also thank Barath Shreeder for assisting with the PCR experiments and acknowledge the support of Mayo Clinic Cancer Center Flow Cytometry Shared Resource.
Grant support: This work was supported by the Minnesota Ovarian Cancer Alliance (KLK and LK), the Fred C. and Katherine B. Andersen Foundation (KLK and KRK), the Marsha Rivkin Center for Ovarian Cancer Research (LK and KLK), the Mayo Clinic Ovarian Cancer SPORE (P50-CA136393 to LH, KLK and ELG) and the Mayo Clinic Cancer Center Support Grant P30-CA015083-25.
References
- 1.Zhang L, Conejo-Garcia JR, Katsaros D, Gimotty PA, Massobrio M, Regnani G, et al. Intratumoral T cells, recurrence, and survival in epithelial ovarian cancer. N Engl J Med. 2003;348:203–13. doi: 10.1056/NEJMoa020177. [DOI] [PubMed] [Google Scholar]
- 2.Shiao SL, Ganesan AP, Rugo HS, Coussens LM. Immune microenvironments in solid tumors: new targets for therapy. Genes Dev. 2011;25:2559–72. doi: 10.1101/gad.169029.111. [DOI] [PMC free article] [PubMed] [Google Scholar]
- 3.Curiel TJ, Coukos G, Zou L, Alvarez X, Cheng P, Mottram P, et al. Specific recruitment of regulatory T cells in ovarian carcinoma fosters immune privilege and predicts reduced survival. Nat Med. 2004;10:942–9. doi: 10.1038/nm1093. [DOI] [PubMed] [Google Scholar]
- 4.Preston CC, Maurer MJ, Oberg AL, Visscher DW, Kalli KR, Hartmann LC, et al. The ratios of CD8+ T cells to CD4+CD25+ FOXP3+ and FOXP3- T cells correlate with poor clinical outcome in human serous ovarian cancer. PLoS One. 2013;8:e80063. doi: 10.1371/journal.pone.0080063. [DOI] [PMC free article] [PubMed] [Google Scholar]
- 5.Knutson KL, Maurer MJ, Preston CC, Moysich KB, Goergen K, Hawthorne KM, et al. Regulatory T cells, inherited variation, and clinical outcome in epithelial ovarian cancer. Cancer Immunol Immunother. 2015 doi: 10.1007/s00262-015-1753-x. [DOI] [PMC free article] [PubMed] [Google Scholar]
- 6.Canioni D, Salles G, Mounier N, Brousse N, Keuppens M, Morchhauser F, et al. High numbers of tumor-associated macrophages have an adverse prognostic value that can be circumvented by rituximab in patients with follicular lymphoma enrolled onto the GELA-GOELAMS FL-2000 trial. J Clin Oncol. 2008;26:440–6. doi: 10.1200/JCO.2007.12.8298. [DOI] [PubMed] [Google Scholar]
- 7.Engelhardt JJ, Boldajipour B, Beemiller P, Pandurangi P, Sorensen C, Werb Z, et al. Marginating dendritic cells of the tumor microenvironment cross-present tumor antigens and stably engage tumor-specific T cells. Cancer Cell. 2012;21:402–17. doi: 10.1016/j.ccr.2012.01.008. [DOI] [PMC free article] [PubMed] [Google Scholar]
- 8.Gorgun GT, Whitehill G, Anderson JL, Hideshima T, Maguire C, Laubach J, et al. Tumor-promoting immune-suppressive myeloid-derived suppressor cells in the multiple myeloma microenvironment in humans. Blood. 2013;121:2975–87. doi: 10.1182/blood-2012-08-448548. [DOI] [PMC free article] [PubMed] [Google Scholar]
- 9.Scarlett UK, Rutkowski MR, Rauwerdink AM, Fields J, Escovar-Fadul X, Baird J, et al. Ovarian cancer progression is controlled by phenotypic changes in dendritic cells. J Exp Med. 2012;209:495–506. doi: 10.1084/jem.20111413. [DOI] [PMC free article] [PubMed] [Google Scholar]
- 10.Krempski J, Karyampudi L, Behrens MD, Erskine CL, Hartmann L, Dong H, et al. Tumor-infiltrating programmed death receptor-1+ dendritic cells mediate immune suppression in ovarian cancer. J Immunol. 2011;186:6905–13. doi: 10.4049/jimmunol.1100274. [DOI] [PMC free article] [PubMed] [Google Scholar]
- 11.Harimoto H, Shimizu M, Nakagawa Y, Nakatsuka K, Wakabayashi A, Sakamoto C, et al. Inactivation of tumor-specific CD8(+) CTLs by tumor-infiltrating tolerogenic dendritic cells. Immunol Cell Biol. 2013;91:545–55. doi: 10.1038/icb.2013.38. [DOI] [PMC free article] [PubMed] [Google Scholar]
- 12.Perrot I, Blanchard D, Freymond N, Isaac S, Guibert B, Pacheco Y, et al. Dendritic cells infiltrating human non-small cell lung cancer are blocked at immature stage. J Immunol. 2007;178:2763–9. doi: 10.4049/jimmunol.178.5.2763. [DOI] [PubMed] [Google Scholar]
- 13.Iwamoto M, Shinohara H, Miyamoto A, Okuzawa M, Mabuchi H, Nohara T, et al. Prognostic value of tumor-infiltrating dendritic cells expressing CD83 in human breast carcinomas. Int J Cancer. 2003;104:92–7. doi: 10.1002/ijc.10915. [DOI] [PubMed] [Google Scholar]
- 14.Sandel MH, Dadabayev AR, Menon AG, Morreau H, Melief CJ, Offringa R, et al. Prognostic value of tumor-infiltrating dendritic cells in colorectal cancer: role of maturation status and intratumoral localization. Clin Cancer Res. 2005;11:2576–82. doi: 10.1158/1078-0432.CCR-04-1448. [DOI] [PubMed] [Google Scholar]
- 15.Whiteside TL. Immune suppression in cancer: effects on immune cells, mechanisms and future therapeutic intervention. Semin Cancer Biol. 2006;16:3–15. doi: 10.1016/j.semcancer.2005.07.008. [DOI] [PubMed] [Google Scholar]
- 16.Michielsen AJ, Hogan AE, Marry J, Tosetto M, Cox F, Hyland JM, et al. Tumour tissue microenvironment can inhibit dendritic cell maturation in colorectal cancer. PLoS One. 2011;6:e27944. doi: 10.1371/journal.pone.0027944. [DOI] [PMC free article] [PubMed] [Google Scholar]
- 17.Chiba S, Baghdadi M, Akiba H, Yoshiyama H, Kinoshita I, Dosaka-Akita H, et al. Tumor-infiltrating DCs suppress nucleic acid-mediated innate immune responses through interactions between the receptor TIM-3 and the alarmin HMGB1. Nat Immunol. 2012;13:832–42. doi: 10.1038/ni.2376. [DOI] [PMC free article] [PubMed] [Google Scholar]
- 18.Min S, Liang X, Zhang M, Zhang Y, Mei S, Liu J, et al. Multiple tumor-associated microRNAs modulate the survival and longevity of dendritic cells by targeting YWHAZ and Bcl2 signaling pathways. J Immunol. 2013;190:2437–46. doi: 10.4049/jimmunol.1202282. [DOI] [PubMed] [Google Scholar]
- 19.Hargadon KM. Tumor-altered dendritic cell function: implications for anti-tumor immunity. Front Immunol. 2013;4:192. doi: 10.3389/fimmu.2013.00192. [DOI] [PMC free article] [PubMed] [Google Scholar]
- 20.Liu Q, Zhang C, Sun A, Zheng Y, Wang L, Cao X. Tumor-educated CD11bhighIalow regulatory dendritic cells suppress T cell response through arginase I. J Immunol. 2009;182:6207–16. doi: 10.4049/jimmunol.0803926. [DOI] [PubMed] [Google Scholar]
- 21.Wherry EJ. T cell exhaustion. Nat Immunol. 2011;12:492–9. doi: 10.1038/ni.2035. [DOI] [PubMed] [Google Scholar]
- 22.Keir ME, Butte MJ, Freeman GJ, Sharpe AH. PD-1 and its ligands in tolerance and immunity. Annu Rev Immunol. 2008;26:677–704. doi: 10.1146/annurev.immunol.26.021607.090331. [DOI] [PMC free article] [PubMed] [Google Scholar]
- 23.Sheppard KA, Fitz LJ, Lee JM, Benander C, George JA, Wooters J, et al. PD-1 inhibits T-cell receptor induced phosphorylation of the ZAP70/CD3zeta signalosome and downstream signaling to PKCtheta. FEBS Lett. 2004;574:37–41. doi: 10.1016/j.febslet.2004.07.083. [DOI] [PubMed] [Google Scholar]
- 24.Okazaki T, Maeda A, Nishimura H, Kurosaki T, Honjo T. PD-1 immunoreceptor inhibits B cell receptor-mediated signaling by recruiting src homology 2-domain-containing tyrosine phosphatase 2 to phosphotyrosine. Proc Natl Acad Sci U S A. 2001;98:13866–71. doi: 10.1073/pnas.231486598. [DOI] [PMC free article] [PubMed] [Google Scholar]
- 25.Knutson KL, Dang Y, Lu H, Lukas J, Almand B, Gad E, et al. IL-2 immunotoxin therapy modulates tumor-associated regulatory T cells and leads to lasting immune-mediated rejection of breast cancers in neu-transgenic mice. J Immunol. 2006;177:84–91. doi: 10.4049/jimmunol.177.1.84. [DOI] [PubMed] [Google Scholar]
- 26.Roby KF, Taylor CC, Sweetwood JP, Cheng Y, Pace JL, Tawfik O, et al. Development of a syngeneic mouse model for events related to ovarian cancer. Carcinogenesis. 2000;21:585–91. doi: 10.1093/carcin/21.4.585. [DOI] [PubMed] [Google Scholar]
- 27.Behrens MD, Wagner WM, Krco CJ, Erskine CL, Kalli KR, Krempski J, et al. The endogenous danger signal, crystalline uric acid, signals for enhanced antibody immunity. Blood. 2008;111:1472–9. doi: 10.1182/blood-2007-10-117184. [DOI] [PMC free article] [PubMed] [Google Scholar]
- 28.Knutson KL, Almand B, Dang Y, Disis ML. Neu antigen-negative variants can be generated after neu-specific antibody therapy in neu transgenic mice. Cancer Res. 2004;64:1146–51. doi: 10.1158/0008-5472.can-03-0173. [DOI] [PubMed] [Google Scholar]
- 29.Hirano F, Kaneko K, Tamura H, Dong H, Wang S, Ichikawa M, et al. Blockade of B7-H1 and PD-1 by monoclonal antibodies potentiates cancer therapeutic immunity. Cancer Res. 2005;65:1089–96. [PubMed] [Google Scholar]
- 30.Tzeng HT, Tsai HF, Liao HJ, Lin YJ, Chen L, Chen PJ, et al. PD-1 blockage reverses immune dysfunction and hepatitis B viral persistence in a mouse animal model. PLoS One. 2012;7:e39179. doi: 10.1371/journal.pone.0039179. [DOI] [PMC free article] [PubMed] [Google Scholar]
- 31.Goldberg MV, Maris CH, Hipkiss EL, Flies AS, Zhen L, Tuder RM, et al. Role of PD-1 and its ligand, B7-H1, in early fate decisions of CD8 T cells. Blood. 2007;110:186–92. doi: 10.1182/blood-2006-12-062422. [DOI] [PMC free article] [PubMed] [Google Scholar]
- 32.Tsushima F, Yao S, Shin T, Flies A, Flies S, Xu H, et al. Interaction between B7-H1 and PD-1 determines initiation and reversal of T-cell anergy. Blood. 2007;110:180–5. doi: 10.1182/blood-2006-11-060087. [DOI] [PMC free article] [PubMed] [Google Scholar]
- 33.Ma Y, Shurin GV, Gutkin DW, Shurin MR. Tumor associated regulatory dendritic cells. Semin Cancer Biol. 2012;22:298–306. doi: 10.1016/j.semcancer.2012.02.010. [DOI] [PMC free article] [PubMed] [Google Scholar]
- 34.Ma Y, Shurin GV, Peiyuan Z, Shurin MR. Dendritic cells in the cancer microenvironment. J Cancer. 2013;4:36–44. doi: 10.7150/jca.5046. [DOI] [PMC free article] [PubMed] [Google Scholar]
- 35.Karyampudi L, Lamichhane P, Scheid AD, Kalli KR, Shreeder B, Krempski JW, et al. Accumulation of memory precursor CD8 T cells in regressing tumors following combination therapy with vaccine and anti-PD-1 antibody. Cancer Res. 2014;74:2974–85. doi: 10.1158/0008-5472.CAN-13-2564. [DOI] [PMC free article] [PubMed] [Google Scholar]
- 36.Riley JL. PD-1 signaling in primary T cells. Immunol Rev. 2009;229:114–25. doi: 10.1111/j.1600-065X.2009.00767.x. [DOI] [PMC free article] [PubMed] [Google Scholar]
- 37.Zhang QJ, Li XL, Wang D, Huang XC, Mathis JM, Duan WM, et al. Trogocytosis of MHC-I/peptide complexes derived from tumors and infected cells enhances dendritic cell cross-priming and promotes adaptive T cell responses. PLoS One. 2008;3:e3097. doi: 10.1371/journal.pone.0003097. [DOI] [PMC free article] [PubMed] [Google Scholar]
- 38.Sun SC. Non-canonical NF-kappaB signaling pathway. Cell Res. 2011;21:71–85. doi: 10.1038/cr.2010.177. [DOI] [PMC free article] [PubMed] [Google Scholar]
- 39.Yoshimura S, Bondeson J, Brennan FM, Foxwell BM, Feldmann M. Role of NFkappaB in antigen presentation and development of regulatory T cells elucidated by treatment of dendritic cells with the proteasome inhibitor PSI. Eur J Immunol. 2001;31:1883–93. doi: 10.1002/1521-4141(200106)31:6<1883::aid-immu1883>3.0.co;2-v. [DOI] [PubMed] [Google Scholar]
- 40.Yoshimura S, Bondeson J, Foxwell BM, Brennan FM, Feldmann M. Effective antigen presentation by dendritic cells is NF-kappaB dependent: coordinate regulation of MHC, co-stimulatory molecules and cytokines. Int Immunol. 2001;13:675–83. doi: 10.1093/intimm/13.5.675. [DOI] [PubMed] [Google Scholar]
- 41.Chemnitz JM, Parry RV, Nichols KE, June CH, Riley JL. SHP-1 and SHP-2 associate with immunoreceptor tyrosine-based switch motif of programmed death 1 upon primary human T cell stimulation, but only receptor ligation prevents T cell activation. J Immunol. 2004;173:945–54. doi: 10.4049/jimmunol.173.2.945. [DOI] [PubMed] [Google Scholar]
- 42.Agata Y, Kawasaki A, Nishimura H, Ishida Y, Tsubata T, Yagita H, et al. Expression of the PD-1 antigen on the surface of stimulated mouse T and B lymphocytes. Int Immunol. 1996;8:765–72. doi: 10.1093/intimm/8.5.765. [DOI] [PubMed] [Google Scholar]
- 43.Oestreich KJ, Yoon H, Ahmed R, Boss JM. NFATc1 regulates PD-1 expression upon T cell activation. J Immunol. 2008;181:4832–9. doi: 10.4049/jimmunol.181.7.4832. [DOI] [PMC free article] [PubMed] [Google Scholar]
- 44.Austin JW, Lu P, Majumder P, Ahmed R, Boss JM. STAT3, STAT4, NFATc1, and CTCF regulate PD-1 through multiple novel regulatory regions in murine T cells. J Immunol. 2014;192:4876–86. doi: 10.4049/jimmunol.1302750. [DOI] [PMC free article] [PubMed] [Google Scholar]
- 45.Pisa P, Halapi E, Pisa EK, Gerdin E, Hising C, Bucht A, et al. Selective expression of interleukin 10, interferon gamma, and granulocyte-macrophage colony-stimulating factor in ovarian cancer biopsies. Proc Natl Acad Sci U S A. 1992;89:7708–12. doi: 10.1073/pnas.89.16.7708. [DOI] [PMC free article] [PubMed] [Google Scholar]
- 46.Kaebisch R, Mejias-Luque R, Prinz C, Gerhard M. Helicobacter pylori cytotoxin-associated gene A impairs human dendritic cell maturation and function through IL-10-mediated activation of STAT3. J Immunol. 2014;192:316–23. doi: 10.4049/jimmunol.1302476. [DOI] [PubMed] [Google Scholar]
- 47.Kamphorst AO, Ahmed R. Manipulating the PD-1 pathway to improve immunity. Curr Opin Immunol. 2013;25:381–8. doi: 10.1016/j.coi.2013.03.003. [DOI] [PMC free article] [PubMed] [Google Scholar]
- 48.Parry RV, Chemnitz JM, Frauwirth KA, Lanfranco AR, Braunstein I, Kobayashi SV, et al. CTLA-4 and PD-1 receptors inhibit T-cell activation by distinct mechanisms. Mol Cell Biol. 2005;25:9543–53. doi: 10.1128/MCB.25.21.9543-9553.2005. [DOI] [PMC free article] [PubMed] [Google Scholar]
- 49.Patsoukis N, Brown J, Petkova V, Liu F, Li L, Boussiotis VA. Selective effects of PD-1 on Akt and Ras pathways regulate molecular components of the cell cycle and inhibit T cell proliferation. Sci Signal. 2012;5:ra46. doi: 10.1126/scisignal.2002796. [DOI] [PMC free article] [PubMed] [Google Scholar]
- 50.Watts C, West MA, Zaru R. TLR signalling regulated antigen presentation in dendritic cells. Curr Opin Immunol. 2010;22:124–30. doi: 10.1016/j.coi.2009.12.005. [DOI] [PubMed] [Google Scholar]
- 51.You M, Flick LM, Yu D, Feng GS. Modulation of the nuclear factor kappa B pathway by Shp-2 tyrosine phosphatase in mediating the induction of interleukin (IL)-6 by IL-1 or tumor necrosis factor. J Exp Med. 2001;193:101–10. doi: 10.1084/jem.193.1.101. [DOI] [PMC free article] [PubMed] [Google Scholar]
- 52.Topalian SL, Hodi FS, Brahmer JR, Gettinger SN, Smith DC, McDermott DF, et al. Safety, activity, and immune correlates of anti-PD-1 antibody in cancer. N Engl J Med. 2012;366:2443–54. doi: 10.1056/NEJMoa1200690. [DOI] [PMC free article] [PubMed] [Google Scholar]
- 53.Weber JS, Kudchadkar RR, Yu B, Gallenstein D, Horak CE, Inzunza HD, et al. Safety, efficacy, and biomarkers of nivolumab with vaccine in ipilimumab-refractory or -naive melanoma. J Clin Oncol. 2013;31:4311–8. doi: 10.1200/JCO.2013.51.4802. [DOI] [PMC free article] [PubMed] [Google Scholar]
- 54.Topalian SL, Sznol M, McDermott DF, Kluger HM, Carvajal RD, Sharfman WH, et al. Survival, durable tumor remission, and long-term safety in patients with advanced melanoma receiving nivolumab. J Clin Oncol. 2014;32:1020–30. doi: 10.1200/JCO.2013.53.0105. [DOI] [PMC free article] [PubMed] [Google Scholar]
Associated Data
This section collects any data citations, data availability statements, or supplementary materials included in this article.