Abstract
Objective
Body weight blunts the growth hormone (GH) response to provocative stimuli. The appropriate GH cut-off to confirm GH deficiency in obese and overweight patients undergoing the glucagon stimulation test (GST) has recently been questioned. We hypothesized that the peak GH would be inversely related to the nadir blood glucose (BG) after glucagon and that this may be a mechanism influencing peak GH in overweight patients. This retrospective study examined effects of gender, body weight, and BG dynamics on GH response to GST in patients evaluated in our Pituitary Center.
Design
Adult patients who underwent GST from September 2009–2014 were included. Continuous variable comparisons were analyzed using the Mann-Whitney U-test and categorical data by Fisher’s Exact Test. Spearman correlation was used to determine associations between continuous variables.
Results
42 patients (N=28, 66.7% female) had sufficient data for analysis. Obese patients (N=26) had a reduced GH response, summarized as GH area under the curve (AUC) (p=0.03 vs. non-obese patients) and higher BG during GST, summarized as AUC (p<0.01 vs. non-obese patients). Obese women (N=19), in particular, stimulated lower (p=0.03 vs. non-obese women) and had a higher nadir BG (p=0.03 vs. non-obese women). While weight correlated with extent (rs=0.35; p=0.02) and timing (rs=0.31; p=0.05) of nadir BG reached, there was no significant correlation between BG dynamics and the GH response in the total population (N=42). Ten patients (7 with pan anterior hypopituitarism, defined as 3 anterior pituitary deficiencies) had a peak GH ≤ 0.1 ng/mL during GST. When these subjects with a negligible peak GH response were excluded from the analysis, weight was associated with GH AUC (rs= −0.45; p=0.01), peak GH response (rs= −0.42; p=0.02) and nadir BG (rs= 0.48; p<0.01). Furthermore, the nadir BG achieved during GST was inversely related to GH AUC (rs= −0.38; p=0.03) and peak GH (rs= −0.37; p=0.04) such that patients (N=32) with higher nadir BG had lower peak GH in response to glucagon.
Conclusions
Obese patients, particularly women, do not respond as robustly to glucagon stimulation. These data suggest that there exists an altered BG profile during GST in obese individuals, and that a less robust hypoglycemic stimulus may contribute to an impaired GH response. We suggest measuring BG levels during glucagon stimulation testing to assist with clinical interpretation of GH dynamics. The diagnostic accuracy of the GST in patients with known disorders in glucose metabolism and those taking anti-diabetic medications deserves further study.
Keywords: Glucagon stimulation, growth hormone deficiency
INTRODUCTION
Growth hormone (GH) deficiency in adults is associated with unfavorable changes in lipid and carbohydrate metabolism as well as body composition, decreased bone mineral density, endothelial dysfunction, and impaired psychological well-being [7, 15, 20, 29, 32, 33]. GH replacement aimed at normalizing IGF-1 levels to age and gender appropriate levels improves many of these indices. Although patients with GH deficiency frequently have low insulin-like growth factor 1 (IGF-1) levels, a normal age appropriate IGF-1 level does not exclude the diagnosis [19, 26]. The pulsatile release of GH necessitates provocative testing to diagnose GH deficiency in the majority of patients, particularly in the absence of other pituitary hormone deficiencies [11, 19, 26, 37].
The current Endocrine Society guidelines recommend testing for GH deficiency in patients with a history of pituitary disease, surgery or radiation involving the sella, head trauma, or other pituitary hormone deficiencies [26]. Although the insulin tolerance test (ITT) has been considered the gold standard to diagnose GH deficiency, it is cumbersome and contraindicated in patients with known history or risk of seizure disorders, cardiovascular disease, or intolerance to hypoglycemia [11, 26, 37]. The combined GH releasing hormone and arginine test therefore became the preferred alternative to the ITT for the diagnosis of GH deficiency until the GH releasing hormone analogue, Geref ®, was withdrawn from the United States market in 2008. The glucagon stimulation test (GST) has since become the recommended test for the diagnosis of adult GH deficiency when Geref ® is unavailable and the ITT is undesirable [26]. The GST is affordable, well-tolerated, and is contraindicated only in malnourished patients, those who have not eaten for greater than 48 hours and patients with a known insulinoma or pheochromocytoma [26, 37].
Body weight, gender, age and oral estrogen use have been shown to influence the extent of GH stimulation following other provocative agents [6, 10, 24, 28, 35]. Dichtel et al. recently proposed a cut-off peak GH of 1 ng/mL in men with BMI ≥25 mg/k2 in order to maximize the specificity and sensitivity of the GST. The investigators found that body mass index (BMI) negatively correlated with peak GH response to GST in overweight but otherwise healthy men [12]. Moreover, peak GH response negatively correlated with the results from oral glucose tolerance testing, summarized as area under the curve (AUC). This study, however, did not include females or individuals with a BMI <25 kg/m2.
The validity of the GST in patients with impaired glucose tolerance and diabetes mellitus is presently unknown. Hypoglycemia triggers the release of GH releasing hormone and thus is a potent stimulus for GH secretion [3, 30]. Thus, we hypothesized that the fall of blood glucose (BG) or the BG nadir during testing predicts the peak GH response to glucagon. The goals of this retrospective study were to investigate the effects of body weight and gender on GH response to glucagon stimulation among male and female patients with a known history of pituitary disease from a single institution. We secondarily examined the relationship between BG and GH dynamics during GST in the same retrospective cohort.
METHODS
Patients
We studied all adult patients over 18 years of age who underwent GST at the Vanderbilt Pituitary Center from September 2009 to September 2014. Patients with a high pre-test probability of GH deficiency based upon history and clinical findings consistent with possible pituitary disease were selected for GST by their treating endocrinologist (Table 1). All patients were receiving appropriate replacement therapies for hypothyroidism, adrenal insufficiency, or hypogonadism at the time of testing. This retrospective study met the criteria for exemption from Vanderbilt Institutional Review Board review and therefore informed consent was not obtained. The hospital’s electronic medical records system was utilized to collect patient demographic and GST data. The electronic RedCap database was used to organize and export de-identified patient data for statistical analyses [18].
Table 1.
Subject Characteristics
| Parameter | n=42 |
|---|---|
| Age (years) | 39.4 (18–74) |
| Gender | |
| Female | 28 (66.7%) |
| Male | 14 (33.3%) |
| Weight (kg) | 96.4 ±26.8 |
| Body Mass Index (kg/m2) | 34.3 ±8.4 |
| Prescribed Oral Estrogen | 7 (25% of women) |
| * Anterior Pituitary Hormone Deficiencies | |
| None | 16 (38.1%) |
| One | 16 (38.1%) |
| Two | 2 (4.8%) |
| Three | 8 (19%) |
| Diagnosis of Diabetes Insipidus | 4 (9.5%) |
| Type 2 Diabetes Mellitus (T2DM) | 3 (7.1%) |
| Baseline IGF-1 (ng/mL) | 96.0 ±59.8 |
| Below Normal IGF-1 | 30 (71.4%) |
| Etiology of Pituitary Disease | |
| Pituitary Adenoma | 15 (35.7%) |
| Craniopharyngioma | 1 (2.4%) |
| Rathke’s Cleft Cyst | 1 (2.4%) |
| Traumatic Brain Injury | 1 (2.4%) |
| Sheehan’s Syndrome/Apoplexy | 2 (4.8%) |
| Hypophysitis | 5 (11.9%) |
| Empty Sella | 3 (7.1%) |
| Congenital | 9 (21.4%) |
| Prior history of GH therapy | 3 (7.1%) |
| Langerhans Cell Histiocytosis | 1 (2.4%) |
| Low IGF-1 and history of fractures | 1 (2.4%) |
Results are presented as mean ± standard deviation, unless otherwise noted.
Other than GH deficiency
GST Protocol
GST took place in the Vanderbilt Pituitary Center’s endocrine outpatient clinic and began between 7:30 and 9:30am following an overnight fast. Patients were administered intramuscular (IM) fixed doses of glucagon based on weight; 1.0mg was administered to patients 90kg or less and 1.5mg was administered to patients weighing greater than 90kg. GH and BG levels were collected intravenously at times 0, 30, 60, 90, 120, 150, 180, 210, and 240 minutes following glucagon administration. Patients were monitored for side effects. Ondansetron was administered for nausea if needed. All patients received a snack prior to leaving the clinic. Patients with diabetes continued home anti-diabetic medications prior to testing.
Assay
GH samples were analyzed using a chemiluminescent immunometric assay performed on the Immulite 2000 platform (Siemens Healthcare Diagnostics, Tarrytown NY) and reported in units of ng/mL. Samples in 2009–2011 were calibrated to IS 80/505 (N=25). GH samples collected in mid 2011 or later were calibrated to IS 98/574 (N=17). The IGF-1 assay used from 2009–2012 was a chemiluminescent immunometric assay performed on the Immulite 2000 platform, calibrated to the International Reference Reagent 87/518, with analytical measurement range of 25–1600mg/mL (N=36). Starting in 2013, IGF-1 samples were analyzed using an immunoassay performed on the IDS-iSYS platform, calibrated to IS 02/254 with analytical measurement range of 10–1200ng/mL (N=6). Glucose measurements were performed using the Beckman Coulter DxC analyzer (Beckman Coulter Inc, Brea CA).
Statistical Methods
Continuous data were compared between groups using the Mann-Whitney U-test. Categorical data was compared using Fisher’s Exact test. Spearman correlation was used to determine an association between continuous variables. Results are presented as mean ± standard deviation (SD) unless otherwise noted. A p value ≤0.05 was used as a threshold to indicate significance. All data analyses were performed using IBM SPSS Statistics (v. 23) and figures were prepared using Graphpad Prism (version 5.04) for Windows (GraphPad Software, San Diego CA).
RESULTS
Baseline Characteristics
Forty-three adult patients underwent glucagon stimulation testing at Vanderbilt Medical Center between September 2009 and 2014 (Table 1). One patient was excluded due to missing BG data; thus 42 patients total were included in the analyses (N=28; 67% female). (Table 1) Males and females did not differ by age (females 40.5 ± 11.1 years vs. 38.4 ± 17.4; p=0.63), weight (females 92.1 ± 21.3 kg vs. 103.8 ± 35.3; p=0.33), BMI (females 34.9 ± 7.9 kg/m2 vs. 33.0 ± 9.4; p=0.52), or number of anterior pituitary hormone deficiencies (females 1.0 ± 1.2 hormone deficiencies vs. 1.1 ± 1.0; p=0.70). Our study included relatively fewer patients with pan anterior hypopituitarism, defined as 3 anterior pituitary deficiencies, N=8) compared to prior studies [12], as patients with 3 anterior pituitary hormone deficiencies with a below normal IGF-1 level have a high likelihood of GH deficiency and do not necessitate GH stimulation testing [26]. Thirty patients (72%) had an IGF-1 below the lower limits of their age-adjusted normal range.
Twenty-six patients (62%) were obese, defined as BMI >30 kg/m2, and twelve patients (29%) were overweight, defined as BMI >25 kg/m2; thus approximately 90% of patients had a BMI greater than 25 kg/m2. Obese patients did not have a greater number of anterior pituitary hormone deficiencies than non-obese patients (obese 1.2 ± 1.2 hormone deficiencies vs. 0.81 ±0.91; p=0.38). All three patients (2 females) with type 2 diabetes mellitus were obese. Six additional patients had a baseline fasting blood glucose ≥100 mg/dL; all of these patients were overweight. Among the patients with diabetes, two were taking metformin alone, and one patient was taking this in addition to pioglitazone, glimepiride, and liraglutide.
GH Response to GST
The mean peak GH response following glucagon stimulation was 2.8 ± 4.3 ng/mL. Thirty-one patients (74%) met criteria for GHD using the cut-off of peak GH <3 ng/mL as per the most recent Endocrine Society Guidelines [8, 26]. Twenty-nine patients (76%) with a BMI >25 kg/m2 had a peak GH response <3 ng/mL whereas only 17 (45%) had a peak GH response <1 ng/mL. The number of anterior pituitary hormone deficiencies inversely correlated with peak GH (rs=−0.38; p=0.01). Age did not correlate with peak GH (rs=0.11; p=0.51).
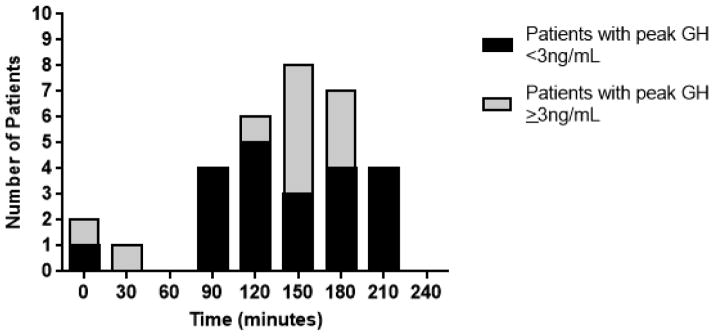
The mean time to peak GH following glucagon administration was 109 ± 72 minutes and median time was 120 minutes. Fifty percent (N=21) of patients peaked between 120 and 180 minutes. Four patients reached their peak GH at 210 minutes, with a peak GH response of 0.3, 1.3, 2.0, and 2.1 ng/mL, respectively. No subjects had peak GH at the 240 minute time point. The peak GH directly correlated with the time of peak GH (rs=0.53; p<0.001), thus patients who had a higher peak GH response peaked later in the test. The number of patients with a peak GH response at each time point is shown in Fig. 1.
Fig. 1.
Number of patients who demonstrated peak growth hormone response at each time point after glucagon stimulation (N=32). 10 subjects were not included in this graph, as they did not stimulate and had a peak GH response ≤ 0.1 ng/mL.
The GST was well-tolerated. Eleven patients (26.2%) experienced nausea, and this was treated with ondansetron. This was more common among female subjects (10 females and 1 male). There were no serious complications, no instances of symptomatic hypoglycemia, and no other adverse effects from the GST.
Effect of Gender and Weight on GH Response to GST
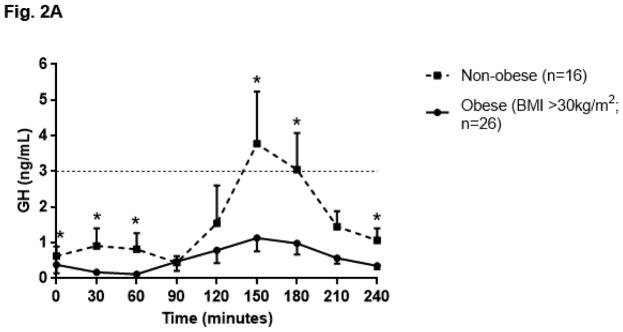
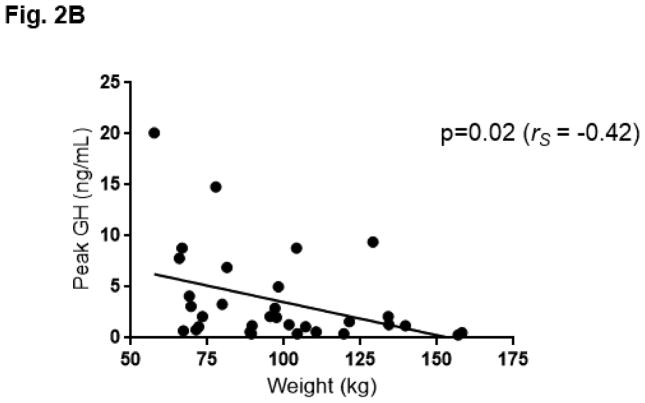
The GH profile during GST appeared flatter in obese individuals as compared to non-obese individuals, such that GH AUC was lower in obese individuals (obese GH AUC 137.48 ± 193.68 ng/mL x minute vs. non-obese 384.50 ± 462.42; p=0.03). (Fig. 2A) Ten patients did not respond to GST, as demonstrated by a peak GH response ≤ 0.1 ng/mL. Among the eight patients with pan anterior hypopituitarism, seven were included in this group who did not respond to GST. One female patient with pan anterior hypopituitarism was prescribed an oral estrogen and did respond to GST (peak GH 5.00ng/mL). When the ten patients who did not respond to GST (GH ≤ 0.1 ng/mL) were excluded from the analysis, an inverse relationship between weight and GH AUC (rs= −0.45; p=0.01) as well as weight and peak GH response (rs= −0.42; p=0.02) was observed. (Fig. 2B)
Fig. 2.
Fig. 2A. Growth hormone (GH) profile in obese and non-obese patients after glucagon stimulation; data represented as mean ± SEM. Dashed line at GH 3ng/dL indicates standard cut off for diagnosis of growth hormone deficiency [26]; * indicates p≤0.05 vs. obese subjects at same time point using the Mann-Whitney U test.
Fig. 2B. Peak growth hormone (GH) vs weight, among patients with GH response to glucagon (N=32). 10 subjects were not included in this graph, as they did not stimulate and had a peak GH response ≤ 0.1 ng/mL. Best fit line is shown.
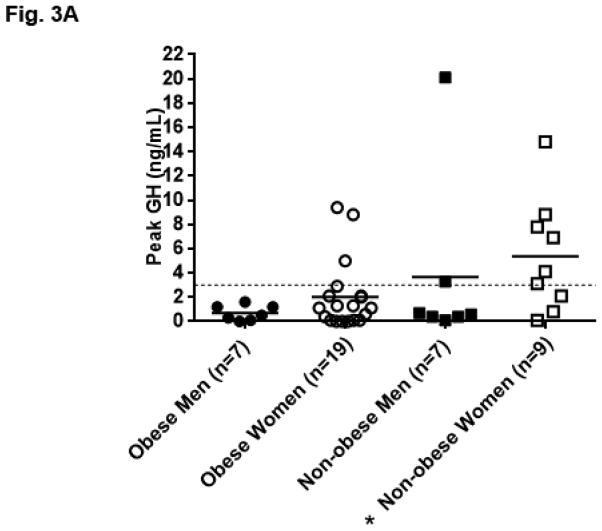
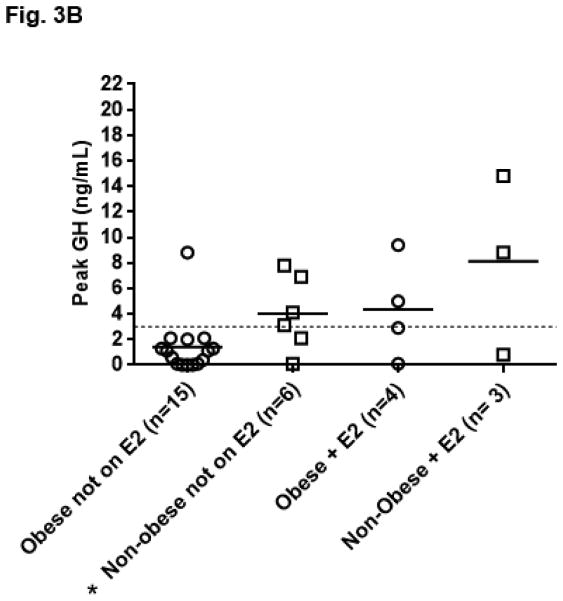
The peak GH response in women was not significantly higher than in men (women 3.10 ± 3.78 ng/mL vs. 2.17± 5.23; p=0.18). The peak GH response compared to obesity status and gender is shown in Fig. 3A. Obese men (N=7) did not stimulate significantly lower than men with BMI <30 kg/m2 (peak GH obese men 0.70 ± 0.63 ng/mL vs. 3.65 ± 7.33; p=0.54). Obese women (N=19), however, stimulated lower than women with BMI <30 kg/m2 (peak GH obese women 2.02 ±2.80 ng/mL vs. 5.39 ±4.68; p=0.03). This finding remained significant when excluding the seven women taking oral estrogens (peak GH obese women 1.40 ± 2.19 vs. 4.02 ± 2.92; p=0.03). (Fig. 3B) Obese women did not have a higher number of anterior hormone deficiencies compared to non-obese women (average number of additional anterior pituitary hormone deficiencies other than GH in obese women 1.2 ± 1.2 vs 0.8 ± 1.1; p=0.44). Overall, women prescribed oral estrogen (N=7) trended towards having a higher peak GH response than women not prescribed an oral estrogen (5.97 ± 5.31 ng/mL vs. 2.15 ± 2.64; p=0.06).
Fig. 3.
Fig. 3A. Growth hormone (GH) peak by gender and obesity status; data represented as mean and individual data points. Dashed line at GH 3ng/dL indicates standard cut off for diagnosis of growth hormone deficiency [26], *p=0.03 vs. obese women using the Mann-Whitney U test. Corresponding mean ± SD nadir BG: obese men 77.6mg/dL ± 21.1, obese women 63.9mg/dL ± 13.1, non-obese men 64.7mg/dL ± 9.1, non-obese women 52.7mg/dL ± 9.9.
Fig. 3B. Growth hormone (GH) peak by obesity status and oral estrogen use (E2) in women (N=28). *p=0.03 vs obese women not on oral estrogen using the Mann-Whitney U test.
Blood Glucose Dynamics during GST
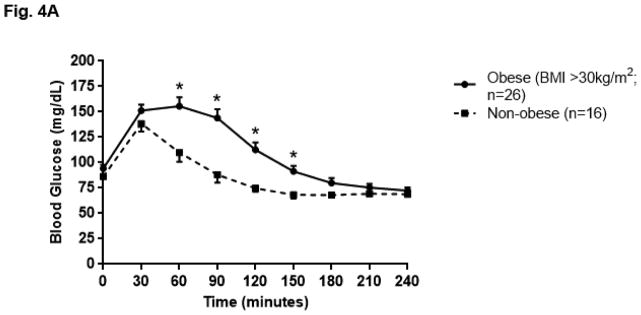
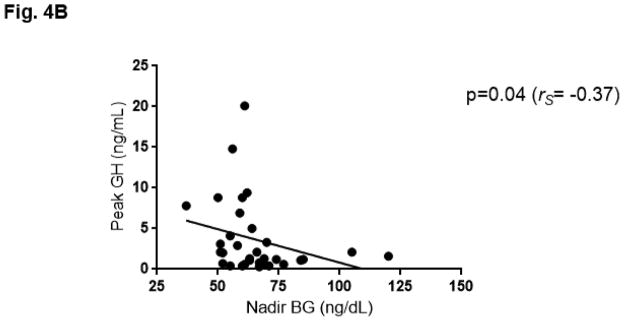
The BG profile during GST as summarized by AUC was greater in obese patients as compared to non-obese patients (obese 26,563.27 ± 6,213.66 mg/dL x minute vs. non-obese 20,749.69 ± 2,986.36; p<0.01). (Fig. 4A) Weight (rs=0.39; p=0.01), BMI (rs=0.35; p=0.02) and age (rs=0.37; p=0.02) correlated with BG AUC. Weight also correlated with the extent (rs=0.35; p=0.02) and timing (rs=0.31; p=0.05) of the nadir BG reached, such that individuals who weighed more had a higher nadir BG which occurred later in the test. (Table 2) When analyzed by gender, women exhibited significant correlations between weight and BG AUC (rs=0.41; p=0.03), BMI and BG AUC (rs=0.44; p=0.02), and baseline fasting BG and GH AUC (rs= −0.37; p=0.05). Obese women (N=19) also had a higher nadir BG than non-obese women (N=9) (obese 63.9mg/dL ± 13.1 vs. 52.7 ± 9.9; p=0.03). This was not observed when comparing obese men (N=7) to non-obese men (N=7) (obese 77.6mg/dL ± 21.1 vs. 64.7 ± 9.1; p=0.20). Nadir BG was lower in women than in men, both when limiting the analysis to obese patients (p=0.04) and non-obese patients (women 52.7 ± 9.9 vs. men 64.7mg/dL ± 9.1; p=0.03). When the ten patients who did not respond to GST were excluded from the analysis, nadir BG was associated with weight (rs= 0.48; p<0.01) and inversely correlated with GH AUC (rs= −0.38; p=0.03) and peak GH (rs= −0.37; p=0.04). (Fig. 4B, Table 2)
Fig. 4.
Fig. 4A. Blood glucose (BG) profile in obese and non-obese patients after glucagon stimulation; data represented as mean ± SEM, *p<0.01 vs. non-obese subjects at same time point using the Mann-Whitney U test.
Fig. 4B. Peak growth hormone (GH) vs nadir blood glucose (BG), among patients with GH response to glucagon (N=32). 10 subjects were not included in this graph, as they did not stimulate and had a peak GH response ≤ 0.1 ng/mL. Best fit line is shown.
Table 2.
Association Between Patient Characteristics and Growth Hormone (GH) Levels (Top, Right) and Blood Glucose (BG) Profile (Bottom) (N=42 patients)
| Parameter | Weight (kg) | BMI (kg/m2) | * Peak GH (ng/mL) | * GH AUC (ng/mL) |
|---|---|---|---|---|
| *Peak GH response (ng/mL) | p=0.02 (rS = −0.42) | p=0.15 (rS = −0.26) | ||
| *GH AUC (ng/mL x min) | p=0.01 (rS = −0.45) | p=0.06 (rS = −0.33) | p=0.32 (rS = −0.18) | p=0.27 (rS = −0.20) |
| Baseline BG (mg/dL) | p=0.12 (rS =0.25) | p=0.06 (rS =0.30) | ||
| Peak BG (mg/dL) | p= 0.14 (rS =0.23) | p= 0.15 (rS =0.23) | p=0.56 (rS = −0.10) | p=0.25 (rS = −0.21) |
| Nadir BG (mg/dL) | p=0.02 (rS=0.35) | p=0.11 (rS =0.26) | p=0.04 (rS = −0.37) | p=0.03 (rS = −0.38) |
| Time of peak BG (min) | p=0.01 (rS =0.38) | p= 0.03 (rS =0.34) | p=0.52 (rS = −0.11) | p=0.63 (rS = −0.09) |
| Time of nadir BG (min) | p=0.05 (rS =0.31) | p=0.15 (rS =0.23) | p=0.18 (rS = −0.24) | p=0.13 (rS = −0.27) |
| Peak-Nadir BG (mg/dL) | p=0.40 (rS =0.13) | p=0.26 (rS =0.18) | p=0.88 (rS = 0.02) | p=0.59 (rS = −0.10) |
| BG AUC (mg/dL x min) | p=0.01 (rS=0.39) | p=0.02 (rS =0.35) | p=0.42 (rS = −0.14) | p=0.16 (rS = −0.25) |
AUC=Area Under the Curve; p values obtained using Spearman’s Correlation Coefficients with p<0.05 indicating significance.
10 subjects excluded from these analyses as they had a peak GH response ≤ 0.1ng/mL
DISCUSSION
This study examines the effects of weight, gender, and blood glucose (BG) dynamics on the growth hormone (GH) response to glucagon stimulation among both male and female patients having a high clinical suspicion for GH deficiency. In our cohort, obese women with a history of pituitary disease have a lower peak GH response to glucagon stimulation than non-obese women with similar anterior pituitary hormone dysfunction. Increased weight is associated with a less potent hypoglycemic response to glucagon with a nadir BG that occurs later in the test; this delayed and attenuated nadir may provide a less robust stimulus for GH secretion. Measuring BG levels during glucagon stimulation testing may be valuable in the clinical interpretation of GH dynamics during GST, particularly in obese patients. The use of oral estrogens should be considered in the interpretation of test results particularly in females who have multiple other anterior pituitary hormone deficiencies and demonstrate a peak GH response beyond the threshold for diagnosis of GH deficiency. Finally, test duration of 210 minutes may be adequate to diagnose GH deficiency, as none of the subjects in our study had a peak GH level beyond this time point.
Our study’s strengths include that: 1) data was collected from a single center 2) we studied both men and women with a high probability of GH deficiency based upon a below normal IGF-1 (71% patients studied), peak GH response less than 3 (74% patients studied) and risk factors for pituitary disease, and 3) BG measurements were analyzed in addition to pertinent demographic data. The primary weakness of this study was it’s small sample size. Additional weaknesses include the lack of a control population inherent to the retrospective nature of the study, and the absence of a gold standard test to confirm or refute the diagnosis of GH deficiency. Some recommend use of the insulin tolerance test as a gold standard, however, others argue that no “gold standard test” for the diagnosis of GHD exists and that results from each must be interpreted within the clinical context [1]. Finally, the standardization for the GH assay on the Immulite 2000 platform changed during the course of this study. Results obtained using the previous vs. the re-standardized kits demonstrate a similar relationship for GH concentrations up to 20 ng/mL even after administration of GH secretagogues [4].
Our findings are consistent with those from prior studies showing that weight and GH response are inversely correlated in both patients suspect for pituitary disease and healthy controls. In a retrospective multi-center series, Yuen et al. found a significant negative correlation between peak GH and body mass index (BMI) in patients undergoing both the weight-based regimen (0.03 mg/kg glucagon) and fixed-dose regimen (1 or 1.5 mg glucagon) of glucagon stimulation for the evaluation of GH deficiency [38]. Toogood et al. also report a negative correlation between BMI and peak GH during the insulin tolerance test, arginine stimulation test, and the glucagon stimulation test among patients registered in the KIMS database (Pfizer International Metabolic Database). This inverse relationship during the glucagon stimulation test appeared to be strongest between a BMI of 30 and 40 kg/m2 and then plateaued for BMI >40 kg/m2 [34]. Alternatively, a negative correlation between BMI and peak GH following glucagon stimulation has been noted by Gomez et al. in healthy subjects but not patients with known pituitary disease [17]. Potential mechanisms for reduced GH secretion in the setting of obesity include increased clearance of GH, a decreased response to GH releasing hormone, alterations of IGF-1 feedback potentially secondary to changes in IGF-1 binding proteins and receptor interactions, increased GH sensitivity in the liver, or excessive somatostatin tone, among other possibilities [9, 11, 14, 21, 36].
In our patient population, there was no significant difference in peak GH between men and women. Female patients included in the KIMS database demonstrated a greater GH peak response to glucagon as compared to men [34, 38]. We did find that women prescribed oral estrogens tended to have a higher peak GH response, but this trend was not significant. One woman with a BMI of 39 kg/m2 and 3 other anterior pituitary hormone deficiencies had a peak GH of 5 ng/mL; she was taking an oral estrogen at the time of testing. Oral estrogen increases hepatic GH binding protein (GHBP) and reduces hepatic IGF-1 secretion [24]. The lower IGF-1 results in loss of negative feedback inhibition on GH secretion. We did not find a lower IGF-1, however, in females prescribed oral estrogen.
There has been conflicting data in the literature as to whether there is a correlation between the peak GH response and the fasting baseline, peak, nadir, or rate of change in the BG following glucagon stimulation. Inclusive of our entire study population (including patients with pan anterior hypopituitarism), we did not find a correlation between BG nadir and peak GH, change in BG or GH, or AUC values for BG and GH. Dichtel et al. found a negative correlation between the BG profile following oral glucose tolerance testing summarized as AUC and peak GH response to glucagon stimulation in a control population of healthy overweight men, even after adjusting for BMI [12]. These findings suggest that glucose intolerance, not simply obesity, may alter the response to glucagon stimulation. In support of this, we did observe a reduced GH response, summarized as GH AUC, and a greater BG AUC in obese patients. When analyzed by gender, obese women in particular had a lower peak GH and higher nadir BG than non-obese women. Diri et. al. excluded patients with 3 or more pituitary hormone deficiencies from their analysis which examined the effect of BMI on peak GH response to GST, with the reasoning that the effect of BMI on peak GH response is minimal in these patients given that the GH during GST was stable and extremely low [13]. With similar rationale, we re-examined our patient population excluding those patients with a peak GH response ≤ 0.1 ng/mL and found that increased weight correlated with higher BG nadir and a lower peak GH. The insulin tolerance test (ITT) method for diagnosis of growth hormone deficiency requires that the patient experience hypoglycemia to < 40 mg/dL to consider the test adequate [22, 31]. Although it has been previously reported that with GST there is not a significant association with blood glucose response [16], this has not been studied in detail in patients with higher than average blood glucose nadir, and it is possible that these patients may not respond appropriately to GST. Our data suggest that an inadequate hypoglycemic stimulus contributes to an impaired GH response to GST, particularly in obese patients. Future work may investigate the validity of the GST among subjects with diabetes and glucose intolerance and also determine if a certain nadir BG must be reached during GST to obtain peak GH response to glucagon.
We chose to study time points through 240 minutes, as the four-hour protocol is standard within the medical literature and common in clinical practice. Similar studies have found the peak GH response to glucagon to occur between 120 and 180 minutes in patients with pituitary disease [2, 5, 27, 38]. Based upon on a detailed review of each of our patient’s glucagon stimulation test results, we propose that the test may be minimized to include GH levels at time points 0, 90, 120, 150, 180, and 210 with fewer or no BG measurements, as BG is not necessary to interpret test results [23, 27]. This is in contrast to a recent study by Diri et al. however, which recommends a GST duration of 240 minutes (with peak at this time in 8.3% of their population), however, they do not indicate if the inclusion of this time point clinically changed the diagnosis of GHD [13]. Given that one of our patients did experience hypoglycemia down to 37 mg/dL, we recommend having snacks available for the end of the test and glucometers nearby for monitoring if necessary. Hypoglycemia to less than 40 mg/dL during the glucagon stimulation test is rare, and occurred in only two of our patients at 60 minutes and 150 minutes [37]. Both patients were women, ages 19 and 35 years, with BMI under 30 kg/m2, and without diabetes or history of elevated blood glucose.
There are several clinical points, when considering our findings in conjunction with the presently available literature. First, Dichtel et al. demonstrated that a lower peak GH cut-off of 1 ng/mL for the diagnosis of GH deficiency should be considered in obese men [12]. Diri et al. also recommended consideration of using a lower peak GH cut off of 1.07 ng/mL (rather than 3 ng/mL) in all patients for higher diagnostic accuracy of GHD [13]. The methodology of our study did not lend itself to a receiver operating characteristic curve (ROC) analysis and thus we were unable to validate the proposed cut-off of 1 ng/mL in our cohort. We found that obese patients, and in particular obese women, do not respond as robustly to GST as non-obese patients. Our data demonstrates that peak GH response following GST inversely associates with both body weight and BG nadir, such that with increased BG nadir and body weight, peak GH is lower. Second, the use of oral estrogens should be taken into consideration when interpreting results in females with other anterior pituitary hormone deficiencies, as our one patient with pan anterior hypopituitarism to stimulate >3 ng/mL was also taking an oral estrogen. This is pertinent given that oral estrogens remain the most common form of sex steroid replacement in hypogonadal women [25]. Third, the GST may be shortened to 210 minutes without affecting the diagnostic accuracy or safety of the test.
CONCLUSION
Obese patients do not respond as robustly to glucagon stimulation as non-obese patients. As weight and BMI have been found to alter the GH response to several provocative stimuli for GH release, it is prudent to use this information when clinically interpreting GH results from GH testing in overweight and obese patients. Our data suggests that a less robust hypoglycemic stimulus, seen in the context of increased weight, may contribute to an impaired GH response to glucagon stimulation. GST duration may be shortened to 210 minutes, as this did not misclassify any individual as GH deficient in our cohort. It would also not increase the risk of “missed” hypoglycemia, as leaner patients who experience a lower nadir BG do so earlier in the test.
Highlights.
Obese patients demonstrate a decreased GH response to glucagon stimulation.
Obese patients demonstrate increased BG values during GST.
Increased weight and higher BG nadir correlate with lower peak GH response.
Acknowledgments
The REDCap database is supported by the Vanderbilt Clinical and Translational Science Awards (CTSA) grant UL1 TR000445 from the NIH National Center for Advancing Translational Sciences. JKD was supported by NIH grant K23HL119602 from NHLBI. JRW was supported by NIH grant T32DK007061 from NIDDK.
Footnotes
Disclosures
Jessica R. Wilson, MD has no disclosures.
Jessica K. Devin, MD, MSCI has no disclosures.
Andrea L. Utz, MD, PhD receives research support from Novartis and Ipsen not related to this manuscript.
Publisher's Disclaimer: This is a PDF file of an unedited manuscript that has been accepted for publication. As a service to our customers we are providing this early version of the manuscript. The manuscript will undergo copyediting, typesetting, and review of the resulting proof before it is published in its final citable form. Please note that during the production process errors may be discovered which could affect the content, and all legal disclaimers that apply to the journal pertain.
Contributor Information
Jessica R. Wilson, Email: jessica.r.wilson@vanderbilt.edu.
Andrea L. Utz, Email: andrea.utz@vanderbilt.edu.
Jessica K. Devin, Email: jessica.devin@vanderbilt.edu.
References
- 1.Andersen M. The robustness of diagnostic tests for GH deficiency in adults. Growth hormone & IGF research: official journal of the Growth Hormone Research Society and the International IGF Research Society. 2015;25:108–114. doi: 10.1016/j.ghir.2015.03.001. [DOI] [PubMed] [Google Scholar]
- 2.Arvat E, Maccagno B, Ramunni J, Maccario M, Giordano R, Broglio F, Camanni F, Ghigo E. Interaction between glucagon and human corticotropin-releasing hormone or vasopressin on ACTH and cortisol secretion in humans. European journal of endocrinology/European Federation of Endocrine Societies. 2000;143:99–104. doi: 10.1530/eje.0.1430099. [DOI] [PubMed] [Google Scholar]
- 3.Barbetti F, Crescenti C, Negri M, Leonetti F, Grossi A, Tamburrano G. Growth hormone does not inhibit its own secretion during prolonged hypoglycemia in man. The Journal of clinical endocrinology and metabolism. 1990;70:1371–1374. doi: 10.1210/jcem-70-5-1371. [DOI] [PubMed] [Google Scholar]
- 4.Barth JH, Sibley PE. Standardization of the IMMULITE systems growth hormone assay with the recombinant IS 98/574. Annals of clinical biochemistry. 2008;45:598–600. doi: 10.1258/acb.2008.008074. [DOI] [PubMed] [Google Scholar]
- 5.Berg C, Meinel T, Lahner H, Yuece A, Mann K, Petersenn S. Diagnostic utility of the glucagon stimulation test in comparison to the insulin tolerance test in patients following pituitary surgery. European journal of endocrinology/European Federation of Endocrine Societies. 2010;162:477–482. doi: 10.1530/EJE-09-0824. [DOI] [PubMed] [Google Scholar]
- 6.Brabant G, Krogh Rasmussen A, Biller BM, Buchfelder M, Feldt-Rasmussen U, Forssmann K, Jonsson B, Koltowska-Haggstrom M, Maiter D, Saller B, Toogood A. Clinical implications of residual growth hormone (GH) response to provocative testing in adults with severe GH deficiency. The Journal of clinical endocrinology and metabolism. 2007;92:2604–2609. doi: 10.1210/jc.2007-0153. [DOI] [PubMed] [Google Scholar]
- 7.Cenci MC, Conceicao FL, Soares DV, Spina LD, Brasil RR, Lobo PM, Michmacher E, Vaisman M. Impact of 5 years of growth hormone replacement therapy on cardiovascular risk factors in growth hormone-deficient adults. Metabolism: clinical and experimental. 2008;57:121–129. doi: 10.1016/j.metabol.2007.08.015. [DOI] [PubMed] [Google Scholar]
- 8.Conceicao FL, da Costa e Silva A, Leal Costa AJ, Vaisman M. Glucagon stimulation test for the diagnosis of GH deficiency in adults. Journal of endocrinological investigation. 2003;26:1065–1070. doi: 10.1007/BF03345251. [DOI] [PubMed] [Google Scholar]
- 9.Cordido F, Fernandez T, Martinez T, Penalva A, Peino R, Casanueva FF, Dieguez C. Effect of acute pharmacological reduction of plasma free fatty acids on growth hormone (GH) releasing hormone-induced GH secretion in obese adults with and without hypopituitarism. The Journal of clinical endocrinology and metabolism. 1998;83:4350–4354. doi: 10.1210/jcem.83.12.5310. [DOI] [PubMed] [Google Scholar]
- 10.Corneli G, Di Somma C, Baldelli R, Rovere S, Gasco V, Croce CG, Grottoli S, Maccario M, Colao A, Lombardi G, Ghigo E, Camanni F, Aimaretti G. The cut-off limits of the GH response to GH-releasing hormone-arginine test related to body mass index. European journal of endocrinology/European Federation of Endocrine Societies. 2005;153:257–264. doi: 10.1530/eje.1.01967. [DOI] [PubMed] [Google Scholar]
- 11.Corneli G, Gasco V, Prodam F, Grottoli S, Aimaretti G, Ghigo E. Growth hormone levels in the diagnosis of growth hormone deficiency in adulthood. Pituitary. 2007;10:141–149. doi: 10.1007/s11102-007-0031-0. [DOI] [PubMed] [Google Scholar]
- 12.Dichtel LE, Yuen KC, Bredella MA, Gerweck AV, Russell BM, Riccio AD, Gurel MH, Sluss PM, Biller BM, Miller KK. Overweight/Obese adults with pituitary disorders require lower peak growth hormone cutoff values on glucagon stimulation testing to avoid overdiagnosis of growth hormone deficiency. The Journal of clinical endocrinology and metabolism. 2014;99:4712–4719. doi: 10.1210/jc.2014-2830. [DOI] [PMC free article] [PubMed] [Google Scholar]
- 13.Diri H, Karaca Z, Simsek Y, Tanriverdi F, Unluhizarci K, Selcuklu A, Kelestimur F. Can a glucagon stimulation test characterized by lower GH cut-off value be used for the diagnosis of growth hormone deficiency in adults? Pituitary. 2015:884–892. doi: 10.1007/s11102-015-0666-1. [DOI] [PubMed] [Google Scholar]
- 14.Frystyk J, Brick DJ, Gerweck AV, Utz AL, Miller KK. Bioactive insulin-like growth factor-I in obesity. The Journal of clinical endocrinology and metabolism. 2009;94:3093–3097. doi: 10.1210/jc.2009-0614. [DOI] [PMC free article] [PubMed] [Google Scholar]
- 15.Gibney J, Wallace JD, Spinks T, Schnorr L, Ranicar A, Cuneo RC, Lockhart S, Burnand KG, Salomon F, Sonksen PH, Russell-Jones D. The effects of 10 years of recombinant human growth hormone (GH) in adult GH-deficient patients. The Journal of clinical endocrinology and metabolism. 1999;84:2596–2602. doi: 10.1210/jcem.84.8.5916. [DOI] [PubMed] [Google Scholar]
- 16.Giuffrida FM, Berger K, Monte L, Oliveira CH, Hoff AO, Maciel RM, Vieira JG. Relationship between GH response and glycemic fluctuations in the glucagon stimulation test. Growth hormone & IGF research: official journal of the Growth Hormone Research Society and the International IGF Research Society. 2009;19:77–81. doi: 10.1016/j.ghir.2008.06.002. [DOI] [PubMed] [Google Scholar]
- 17.Gomez JM, Espadero RM, Escobar-Jimenez F, Hawkins F, Pico A, Herrera-Pombo JL, Vilardell E, Duran A, Mesa J, Faure E, Sanmarti A. Growth hormone release after glucagon as a reliable test of growth hormone assessment in adults. Clinical endocrinology. 2002;56:329–334. doi: 10.1046/j.1365-2265.2002.01472.x. [DOI] [PubMed] [Google Scholar]
- 18.Harris PA, Taylor R, Thielke R, Payne J, Gonzalez N, Conde JG. Research electronic data capture (REDCap)--a metadata-driven methodology and workflow process for providing translational research informatics support. Journal of biomedical informatics. 2009;42:377–381. doi: 10.1016/j.jbi.2008.08.010. [DOI] [PMC free article] [PubMed] [Google Scholar]
- 19.Hilding A, Hall K, Wivall-Helleryd IL, Saaf M, Melin AL, Thoren M. Serum levels of insulin-like growth factor I in 152 patients with growth hormone deficiency, aged 19–82 years, in relation to those in healthy subjects. The Journal of clinical endocrinology and metabolism. 1999;84:2013–2019. doi: 10.1210/jcem.84.6.5793. [DOI] [PubMed] [Google Scholar]
- 20.Holmes SJ, Economou G, Whitehouse RW, Adams JE, Shalet SM. Reduced bone mineral density in patients with adult onset growth hormone deficiency. The Journal of clinical endocrinology and metabolism. 1994;78:669–674. doi: 10.1210/jcem.78.3.8126140. [DOI] [PubMed] [Google Scholar]
- 21.Iranmanesh A, Lizarralde G, Veldhuis JD. Age and relative adiposity are specific negative determinants of the frequency and amplitude of growth hormone (GH) secretory bursts and the half-life of endogenous GH in healthy men. The Journal of clinical endocrinology and metabolism. 1991;73:1081–1088. doi: 10.1210/jcem-73-5-1081. [DOI] [PubMed] [Google Scholar]
- 22.Landon J, Greenwood FC, Stamp TC, Wynn V. The plasma sugar, free fatty acid, cortisol, and growth hormone response to insulin, and the comparison of this procedure with other tests of pituitary and adrenal function. II. In patients with hypothalamic or pituitary dysfunction or anorexia nervosa. The Journal of clinical investigation. 1966;45:437–449. doi: 10.1172/JCI105358. [DOI] [PMC free article] [PubMed] [Google Scholar]
- 23.Leong KS, Walker AB, Martin I, Wile D, Wilding J, MacFarlane IA. An audit of 500 subcutaneous glucagon stimulation tests to assess growth hormone and ACTH secretion in patients with hypothalamic-pituitary disease. Clinical endocrinology. 2001;54:463–468. doi: 10.1046/j.1365-2265.2001.01169.x. [DOI] [PubMed] [Google Scholar]
- 24.Leung KC, Johannsson G, Leong GM, Ho KK. Estrogen regulation of growth hormone action. Endocrine reviews. 2004;25:693–721. doi: 10.1210/er.2003-0035. [DOI] [PubMed] [Google Scholar]
- 25.Mah PM, Webster J, Jonsson P, Feldt-Rasmussen U, Koltowska-Haggstrom M, Ross RJ. Estrogen replacement in women of fertile years with hypopituitarism. The Journal of clinical endocrinology and metabolism. 2005;90:5964–5969. doi: 10.1210/jc.2005-1207. [DOI] [PubMed] [Google Scholar]
- 26.Molitch ME, Clemmons DR, Malozowski S, Merriam GR, Vance ML, Endocrine S. Evaluation and treatment of adult growth hormone deficiency: an Endocrine Society clinical practice guideline. The Journal of clinical endocrinology and metabolism. 2011;96:1587–1609. doi: 10.1210/jc.2011-0179. [DOI] [PubMed] [Google Scholar]
- 27.Orme SM, Price A, Weetman AP, Ross RJ. Comparison of the diagnostic utility of the simplified and standard i.m. glucagon stimulation test (IMGST) Clinical endocrinology. 1998;49:773–778. doi: 10.1046/j.1365-2265.1998.00610.x. [DOI] [PubMed] [Google Scholar]
- 28.Popovic V. Approach to testing growth hormone (GH) secretion in obese subjects. The Journal of clinical endocrinology and metabolism. 2013;98:1789–1796. doi: 10.1210/jc.2013-1099. [DOI] [PubMed] [Google Scholar]
- 29.Rosilio M, Blum WF, Edwards DJ, Shavrikova EP, Valle D, Lamberts SW, Erfurth EM, Webb SM, Ross RJ, Chihara K, Henrich G, Herschbach P, Attanasio AF. Long-term improvement of quality of life during growth hormone (GH) replacement therapy in adults with GH deficiency, as measured by questions on life satisfaction-hypopituitarism (QLS-H) The Journal of clinical endocrinology and metabolism. 2004;89:1684–1693. doi: 10.1210/jc.2003-030134. [DOI] [PubMed] [Google Scholar]
- 30.Stanley S, Domingos AI, Kelly L, Garfield A, Damanpour S, Heisler L, Friedman J. Profiling of Glucose-Sensing Neurons Reveals that GHRH Neurons Are Activated by Hypoglycemia. Cell metabolism. 2013;18:596–607. doi: 10.1016/j.cmet.2013.09.002. [DOI] [PubMed] [Google Scholar]
- 31.Stimmler L. Glucagon and growth hormone. British medical journal. 1973;1:489. doi: 10.1136/bmj.1.5851.489. [DOI] [PMC free article] [PubMed] [Google Scholar]
- 32.Stochholm K, Gravholt CH, Laursen T, Laurberg P, Andersen M, Kristensen LO, Feldt-Rasmussen U, Christiansen JS, Frydenberg M, Green A. Mortality and GH deficiency: a nationwide study. European journal of endocrinology/European Federation of Endocrine Societies. 2007;157:9–18. doi: 10.1530/EJE-07-0013. [DOI] [PubMed] [Google Scholar]
- 33.Tomlinson JW, Holden N, Hills RK, Wheatley K, Clayton RN, Bates AS, Sheppard MC, Stewart PM. Association between premature mortality and hypopituitarism. West Midlands Prospective Hypopituitary Study Group. Lancet. 2001;357:425–431. doi: 10.1016/s0140-6736(00)04006-x. [DOI] [PubMed] [Google Scholar]
- 34.Toogood A, Brabant G, Maiter D, Jonsson B, Feldt-Rasmussen U, Koltowska-Haggstrom M, Rasmussen AK, Buchfelder M, Saller B, Biller BM. Similar clinical features among patients with severe adult growth hormone deficiency diagnosed with insulin tolerance test or arginine or glucagon stimulation tests. Endocrine practice: official journal of the American College of Endocrinology and the American Association of Clinical Endocrinologists. 2012;18:325–334. doi: 10.4158/EP11146.OR. [DOI] [PubMed] [Google Scholar]
- 35.Toogood AA, O’Neill PA, Shalet SM. Beyond the somatopause: growth hormone deficiency in adults over the age of 60 years. The Journal of clinical endocrinology and metabolism. 1996;81:460–465. doi: 10.1210/jcem.81.2.8636250. [DOI] [PubMed] [Google Scholar]
- 36.Veldhuis JD, Iranmanesh A, Ho KK, Waters MJ, Johnson ML, Lizarralde G. Dual defects in pulsatile growth hormone secretion and clearance subserve the hyposomatotropism of obesity in man. The Journal of clinical endocrinology and metabolism. 1991;72:51–59. doi: 10.1210/jcem-72-1-51. [DOI] [PubMed] [Google Scholar]
- 37.Yuen KC. Glucagon stimulation testing in assessing for adult growth hormone deficiency: current status and future perspectives. ISRN endocrinology. 2011;2011:608056, 1–6. doi: 10.5402/2011/608056. [DOI] [PMC free article] [PubMed] [Google Scholar]
- 38.Yuen KC, Biller BM, Katznelson L, Rhoads SA, Gurel MH, Chu O, Corazzini V, Spiller K, Gordon MB, Salvatori R, Cook DM. Clinical characteristics, timing of peak responses and safety aspects of two dosing regimens of the glucagon stimulation test in evaluating growth hormone and cortisol secretion in adults. Pituitary. 2012:220–30. doi: 10.1007/s11102-012-0407-7. [DOI] [PubMed] [Google Scholar]


