

Abstract
Mathematical models can support the drug development process by predicting the pharmacokinetic (PK) properties of the drug and optimal dosing regimens. We have developed a pharmacokinetic model that includes a biochemical molecular interaction network linked to a whole‐body compartment model. We applied the model to study the PK of the anti‐vascular endothelial growth factor (VEGF) cancer therapeutic agent, aflibercept. Clinical data is used to infer model parameters using a Bayesian approach, enabling a quantitative estimation of the contributions of specific transport processes and molecular interactions of the drug that cannot be examined in other PK modeling, and insight into the mechanisms of aflibercept's antiangiogenic action. Additionally, we predict the plasma and tissue concentrations of unbound and VEGF‐bound aflibercept. Thus, we present a computational framework that can serve as a valuable tool for drug development efforts.
Study Highlights.
WHAT IS THE CURRENT KNOWLEDGE ON THE TOPIC? ☑ Aflibercept is a soluble decoy receptor inhibitor of VEGF approved for the treatment of metastatic colorectal cancer. Current PK models of aflibercept estimate PK parameters for free and bound aflibercept in patients with solid tumors, but do not identify specific molecular processes that influence drug distribution. • WHAT QUESTION DID THIS STUDY ADDRESS? ☑ This study applies a data‐driven, molecular‐detailed PK model of aflibercept to investigate the specific molecular interactions and transport processes that contribute to the distribution of aflibercept in the body and its mechanism of action. • WHAT THIS STUDY ADDS TO OUR KNOWLEDGE ☑ The model predicts the concentrations of free and bound aflibercept in tissue and plasma for various doses of the drug. Aflibercept binding to VEGF bound to NRP co‐receptors must be included in order for the model predictions to match clinical measurements. • HOW THIS MIGHT CHANGE CLINICAL PHARMACOLOGY AND THERAPEUTICS ☑ The model predicts potential mechanisms through which aflibercept targets VEGF. This insight can be combined with preclinical and clinical drug development studies.
Angiogenesis, the formation of new blood capillaries from a preexisting vascular network, plays an important role in many physiological processes, as well as in pathological conditions. In cancer, a tumor recruits the blood vessels it needs to survive. Thus, targeting angiogenesis is an attractive approach to impede tumor growth. Particular emphasis has been placed on inhibiting the action of vascular endothelial growth factor (VEGF), a potent promoter of angiogenesis. Therapeutic agents that inhibit VEGF act to bind VEGF directly, bind to its cell‐surface receptors, or inhibit intracellular signaling. Aflibercept (VEGF Trap; Regeneron, Tarrytown, NY) is a soluble decoy receptor consisting of a fusion of the second immunoglobulin domain of human vascular endothelial growth factor receptor‐1 (VEGFR‐1) to the third immunoglobulin domain of human VEGFR‐2 with the constant region (Fc) of human immunoglobulin G1.1 Aflibercept is approved for the treatment of metastatic colorectal cancer and is being investigated for its efficacy in treating other cancer types, including glioma, ovarian, and prostate cancers.
Mathematical models are broadly used during drug development to understand the pharmacokinetics (PKs) of the drug. Such models can be useful in establishing pharmacokinetic‐pharmacodynamic relationships, exploring optimal dosing regimens, and predicting clinical results based on preclinical studies.2, 3, 4 Computational models simulating drug effects may also aid in reducing the risk and economic burden associated with drug development.5, 6 Various modeling approaches incorporate different levels of detail and have certain advantages and limitations. The selection of which approach to use depends on the objectives and the availability of data needed for systematic model development and validation.
Several modeling approaches have been applied to study cancer therapeutics,2 including antiangiogenic agents.7, 8 One example is mechanism‐based PK modeling, including work by Thai et al.,9 who characterize the population PK of the anti‐VEGF agent aflibercept, using data from nine clinical trials.9 Thai et al.10 used population PK data to estimate model parameters, and their uncertainty, and predict appropriate dosing regimens. A similar modeling approach has been applied to estimate the PK parameters and plasma concentrations of bevacizumab in patients with colorectal cancer.11
Another approach is molecular‐detailed PK modeling, a particular type of physiologically based pharmacokinetic models. Our laboratory has developed models to study the systemic effects of targeting VEGF in cancer12, 13, 14, 15 using a bottom‐up approach. We start with molecular pathways that characterize interactions between an anti‐VEGF agent and its targets, as well as microenvironmental factors. We link the detailed biochemical kinetics and molecular transport with systemic distribution of the VEGF‐targeting drug. The model predicts the distribution of the drug in different compartments.
In this study, we present a systems biology approach to study pharmacokinetic‐pharmacodynamic of aflibercept. We construct whole‐body molecular‐detailed PK models to explore the effects of drug‐target binding and drug elimination routes. We apply a Bayesian calibration method16, 17, 18 to infer the model parameters and identify the most probable model, given the available data. We evaluate the effects of specific molecular interactions between the drug, its target, and other molecular species in the body.
METHODS
Computational model
We have developed a whole‐body PK model to predict the effect of intravenous administration of an anti‐VEGF agent in cancer. The model, illustrated in Figure 1, predicts interstitial and plasma concentrations of VEGF and aflibercept in three compartments: normal tissue (“normal compartment,” represented by skeletal muscle), the vasculature (“blood compartment”), and diseased tissue (“tumor compartment”). The tumor compartment is parameterized as a breast tumor; however, the model is broadly applicable to any solid tumor. The geometric parameters used to characterize the compartments are taken from the literature, and compiled in the Supplementary Materials.
Figure 1.
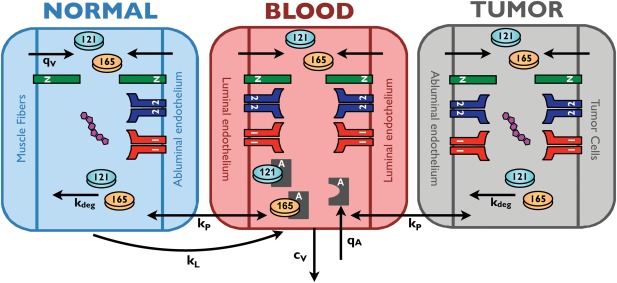
Schematic of whole‐body PK model. The model represents the entire body with three compartments: normal tissue (represented mostly by skeletal muscle), blood, and tumor. The compartments are connected via macromolecular transport mechanisms: transendothelial permeability (kp) and lymphatic flow (kL). Soluble species are removed from the blood via clearance (cv) and are subject to degradation via proteolysis (kdeg). VEGF isoforms are secreted (qv) by muscle fibers, endothelial cells, and tumor cells. The model includes molecular interactions between VEGF and its receptors, co‐receptors, and the anti‐VEGF agent, aflibercept. Aflibercept is administered into the blood via a 60‐minute infusion (qA) after the predicted concentrations reach steady state.
The model includes molecular interactions between two major VEGF isoforms (VEGF121 and VEGF165), VEGF receptors (VEGFR1 and VEGFR2), and co‐receptors neuropilins (NRP1 and NRP2). The VEGF ligands have specific interactions with the receptors because of differential exon splicing, and the kinetic rates of these interactions are based on experimental data. VEGF is secreted by parenchymal cells (muscle fibers and tumor cells, in the normal and diseased compartments, respectively), as well as by endothelial cells (both luminal secretion into the blood compartment and abluminal secretion into the tissue compartments). The isoform secretion ratios for the different cell types are taken from the literature.
VEGFRs are present on endothelial cells (both the luminal and abluminal surfaces) and tumor cells. Additionally, the co‐receptor NRP1 is present on muscle fibers, endothelial cells, and tumor cells, whereas NRP2 is only expressed in tumor cells in the model. The density of VEGF receptors and co‐receptors is based on quantitative flow cytometric measurements, which determine the number of receptors on a cell‐by‐cell basis.19, 20
The model also includes soluble factors: soluble VEGFR1 and α‐2‐macroglobulin. Soluble α‐2‐macroglobulin is present in two forms: native (α2M) and active (α2Mfast). These species, which are present at nanomolar to micromolar concentrations in plasma, are ∼720 kDa in size. Because of their large size, these species are assumed to be confined to the blood compartment. Both soluble VEGFR1 and α‐2‐macroglobulin are secreted by endothelial cells, where the secretion rate is set to match the plasma and tissue concentrations reported in the literature.
Many of the model parameters are based on in vitro measurements (for example, kinetic binding constants, clearance, and degradation rates). Geometric parameters are required to characterize the body compartments and enable conversion of the concentrations in units used in the model (moles/cm3 tissue) to more standard units (pM). The number of VEGFRs and co‐receptors are based on quantitative flow cytometry measurements from in vitro and in vivo studies in our laboratory.19, 20 In our previous publications,12, 13, 15, 21, 22 we have performed extensive sensitivity analyses to quantify how the model outputs (namely, the concentrations of VEGF in the three compartments) are affected when model parameters are varied. We found that most parameters do not significantly change the predicted VEGF concentrations over a wide range of values (i.e., up to an order of magnitude above or below the baseline value). In the current article, we build on the baseline model to understand the effects of specific molecular interactions involving aflibercept.
Numerical implementation of the model
Altogether, the model is comprised of 161 nonlinear ordinary differential equations: 36 for the normal compartment, 72 for the blood, and 53 for the tumor compartment. These equations predict the concentrations of the 161 species in the interstitial space of the normal and tumor tissues and blood plasma over time, where species found in different compartments are treated as unique species.
We simulate an intravenous injection of aflibercept to mimic administration of the drug to patients with cancer, for various doses of the drug. The 60‐minute injection is administered after the model reaches steady state. The equations were implemented in MATLAB using the SimBiology toolbox and the Sundials solver. All model equations and parameter values, with citations, for the baseline model are given in Supplementary Tables S1–S4. Additionally, Model 2, with the inferred parameter values, is available in SBML format in the Supplementary Materials.
Uncertainty quantification
We use the parallel Transitional Markov Chain Monte Carlo algorithm16 to perform the Bayesian calibration and model selection. In order to handle the large computational cost associated with the Transitional Markov Chain Monte Carlo algorithm, we use the open source framework Pi4U.18 All parameter values for the computational setup of the inference algorithms are given in the Supplementary Tables S5–S7. We quantify uncertainty intervals, termed total uncertainty (TU), as the quantile points within which we have 90% probability (5–95th quantile) of the plausible parameter sets from the posterior probability distribution functions as inferred from the Transitional Markov Chain Monte Carlo sampling campaign. This can be written as such that , for each parameter of the PK model .
Bayesian inference methodology
The Bayesian inference methodology provides a quantitative measure as to the probability of the various models that we have developed given the available literature data. An overview of the method is provided below, and additional details are given in the Supplementary Materials. The Bayesian model selection provides a systematic framework to quantify the plausibility of each model among a competing set of models, guarding against over‐parameterization with the use of Occam's razor. The Bayesian model selection involving the use of the model evidence is always valid, contrary to the Bayesian/Akaike Information Criterion, which are approximations valid in the limit of using large amounts of data. A number of competing model classes are ranked based on their probability given the data D, according to the Bayes model selection equation:
where is the prior probability of the model class . The most probable model class is selected as the one that maximizes over i. The prior probability of each model class is set to . The evidence of each model class is evaluated as a byproduct during the Bayesian calibration.17
RESULTS
Data available for parameter estimation
Plasma concentrations of unbound aflibercept and aflibercept bound to VEGF, free and bound aflibercept, respectively, predicted by the model are compared to clinical measurements from the phase I clinical trial data published by Lockhart et al.23 In the clinical study, blood samples were obtained from 47 patients (15 men, 32 women), whose median age was 56 years, and who had undergone a median of five previous chemotherapy regimens. The patients' tumor site varied, including ovarian/fallopian/peritoneal, renal, and colorectal. The concentrations of circulating free and bound aflibercept were quantified by enzyme‐linked immunosorbent assay. We digitized the mean plasma concentration vs. time profiles for free and bound aflibercept in order to compare to our model predictions. The data range from 0.03–142 μg/mL (0.3–1.2 × 10³ nM) for unbound aflibercept and 0.01–3.8 μg/mL (0.07–24 nM) for bound aflibercept, given doses ranging from 0.3–7.0 mg/kg.
Using the data described above, we estimated certain model parameters (Table 1). These parameters were chosen because little or no data is available with which we can set their values, and because those parameters were shown to influence the concentrations of free and bound aflibercept (results not shown). Our preliminary studies indicated that a major determinant of the VEGF concentrations in each of the three compartments is the VEGF secretion rates from endothelial cells, normal cells (myocytes), and tumor cells. However, measurements of free and bound aflibercept in the blood are not sufficient to determine the VEGF secretion rates. Therefore, we used the steady state concentrations of unbound VEGF in the three compartments to further constrain the parameter estimation. These data are summarized in Supplementary Table S1.
Table 1.
Description of molecular‐detailed PK models investigated and Bayesian comparison
| Model | Degradation of free aflibercept | Aflibercept binds NRP‐bound VEGF | Internalization of bound aflibercept | Parameters estimated | Log (evidence) | Posterior model probability % |
|---|---|---|---|---|---|---|
| Baseline | VEGF secretion rates | −205.46 | 9.43 | |||
| Model 1 | X | VEGF secretion rates | −210.70 | 0.05 | ||
| Degradation rate of free aflibercept | ||||||
| Model 2 | X | X | VEGF secretion rates | −203.23 | 87.68 | |
| Degradation rate of free aflibercept | ||||||
| Model 3 | X | X | VEGF secretion rates | −211.41 | 0.02 | |
| Degradation rate of free aflibercept | ||||||
| Internalization rate of bound aflibercept | ||||||
| Model 4 | X | X | X | VEGF secretion rates | −206.67 | 2.82 |
| Degradation rate of free aflibercept | ||||||
| Internalization rate of bound aflibercept |
NRP, neuropilin; VEGF, vascular endothelial growth factor.
Results of parameter estimation
We started with a baseline model and expanded it systematically to include a specific transport process or molecular interaction, based on experimental observations and hypotheses. The various models investigated are presented in Table 1, and specific results are described below.
Baseline model
We utilized our previous mechanistic model of VEGF in the body15 to predict the plasma concentrations of free and bound aflibercept (“Baseline model”). A Bayesian inference methodology was used to estimate the VEGF secretion rates and aflibercept degradation rate (Table 2). We then sought to expand the baseline model to incorporate additional transport and interactions discussed in the literature or hypothesized to occur, in order to fully capture the molecular features of aflibercept: (1) degradation of aflibercept via proteolysis; (2) binding of aflibercept to VEGF that is bound to NRP; and (3) internalization of the VEGF‐aflibercept complex in the peripheral tissue compartment. We explored the effects of including these three features individually (Models 1 through 3) and in combination (Model 4) to determine how they contribute to the models' ability to reproduce the clinical data.
Table 2.
Parameter values estimated using Bayesian inference method
| Model | EC VEGF secretion rate, 10−2 molecules/cell/s (TU)[Link] | Muscle fiber VEGF secretion rate, 10−6 molecules/cell/s (TU) | Tumor cell VEGF secretion rate, 10−1 molecules/cell/s (TU) | Degradation rate of free aflibercept, 10−9 s−1 (TU) | Internalization rate of bound aflibercept, 10−9 s−1 (TU) |
|---|---|---|---|---|---|
| Baseline | 6.97 × 10⁻³ (2.58 × 10⁻¹⁰−0.05) | 0.706 (2.31 × 10⁻³−14.20) | 49.2 (45.75–50.75) | X | X |
| Model 1 | 1.46 × 10⁻⁴ (4.17 × 10⁻¹⁰−0.67) | 48.7 (0.48–397.60) | 48.8 (35.62–49.13) | 0.144 (0.004–8.04) | X |
| Model 2 | 3.24 (2.02–3.49) | 5.01 × 10⁻³ (6.97 × 10⁻⁶−1.36) | 3.87 (0.80–20.83) | 44.2 (0.96–149.26) | X |
| Model 3 | 1.74 × 10⁻³ (8.95 × 10⁻⁶−4.09 × 10⁻¹) | 8.41 × 10² (1.11 × 10⁻⁵−2133.0) | 46.3 (40.23–52.17) | 1.98 (0.025–140.82) | 0.338 (0.0078–280.41) |
| Model 4 | 3.19 (1.41–3.19) | 0.171 (3.01 × 10⁻⁵−2.08) | 4.96 (4.39–29.84) | 0.626 (0.0013–0.641) | 0.021 (0.0019–1.7944) |
EC, endothelial cell; TU, total uncertainty; VEGF, vascular endothelial growth factor.
aTU indicates the range containing 90% of the parameter sets from the posterior probability distribution function.
Model 1: Include degradation of free aflibercept
In the baseline model, all soluble species in the tissue compartments are subject to degradation via proteolysis. Although PK studies of aflibercept indicate that the primary mechanism by which the drug is removed from the body is via clearance,23 we refined the model to include degradation of free aflibercept in the tissue interstitium, presumably via proteolysis. Accounting for another elimination route of aflibercept was expected to reduce the predicted concentration of bound aflibercept. Additionally, by including degradation of free aflibercept, all soluble species in the model would be treated in the same fashion regarding proteolysis. The estimated degradation rate of free aflibercept and its interquartile range are provided in Table 2.
Model 2: Include aflibercept binding to NRP‐bound VEGF
Given the molecular detail of the model, we were able to predict the distribution of VEGF in the tissue compartments and plasma. To do so, the original model (“Baseline model” with no parameter inference) was run without aflibercept injections to determine the steady state distribution of VEGF among its binding partners (soluble factors, extracellular matrix, and cellular receptors). The model predicted that, in all compartments, a large percentage of VEGF is bound to VEGFRs or co‐receptors (Figure 2 a). Specifically, 90%, 96%, and 92% of VEGF in the normal tissue, plasma, and tumor tissue, respectively, is complexed with its receptors. Furthermore, the most abundant VEGF complexes involve NRP (Figure 2 b), comprising 98%, 97%, and 96% of receptor‐bound VEGF in normal tissue, plasma, and tumor tissue, respectively. The ligand is complexed to NRP co‐receptors either in the form of binary (VEGF/NRP, red shading) or tertiary complexes (VEGF/NRP/VEGFR1 or VEGF/NRP/VEGFR2, yellow and green shading, respectively). Based on these predictions, we hypothesized that allowing aflibercept to bind to NRP‐bound VEGF would lead to reduced concentrations of bound aflibercept in the plasma, influencing the fit to the clinical measurements.
Figure 2.
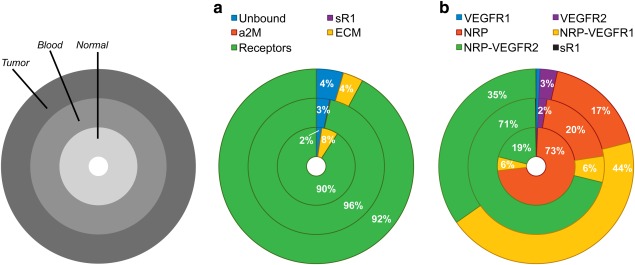
Distribution of VEGF in the body. (a) Distribution of VEGF in the body at steady state (before administration of the drug). (b) Detailed distribution of receptor‐bound VEGF. The model predicts that receptor‐bound VEGF constitutes a significant percentage of VEGF in the body, and most of VEGF is bound to the neuropilins in some form. sR1, soluble VEGF receptor‐1; a2M, α‐2‐macroglobulin; ECM, extracellular matrix; VEGFR1, VEGF receptor‐1; VEGFR2, VEGF receptor‐2; NRP, neuropilin‐1 or −2.
Because aflibercept is a decoy receptor that associates with the VEGFR1‐ and VEGFR2‐binding domains on VEGF, the binding sites for NRP and aflibercept are unique. Therefore, we included this interaction (Model 2). We assumed that the binding affinity between aflibercept and NRP‐bound VEGF is the same as that for aflibercept and free VEGF. The VEGF secretion rates and aflibercept degradation rate were free parameters, and their estimated values are shown in Table 2. Figure 3 shows the robust posterior predictions for free and bound aflibercept.
Figure 3.
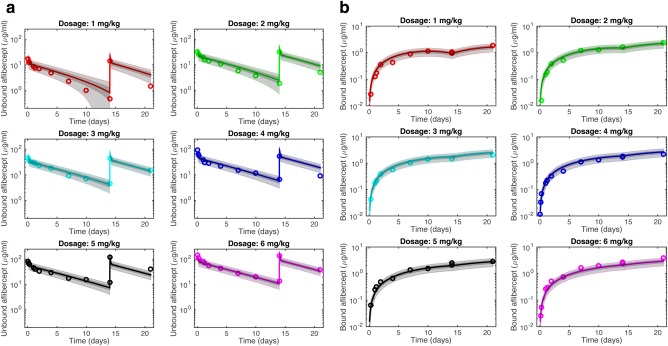
Robust posterior predictions from Model 2. The plasma concentrations of: (a) free aflibercept and (b) bound aflibercept predicted by the whole‐body PK model (lines, neglecting uncertainty), compared to clinical measurements (circles) for different doses of the drug, as predicted by Model 2. This model includes degradation of free aflibercept and trapping of NRP‐bound VEGF. Dark gray shading denotes the interquantile range (IQR), which contains ∼50% of posterior probability density function predictions. Light gray bands indicate the range of predictions given the total uncertainty and contain ∼90% of predictions.
Model 3: Include tissue internalization of bound aflibercept
The mechanism‐based model developed by Thai et al.9 includes elimination of the complex in the peripheral tissue compartment via internalization. PK studies of the drug indicate that it may be eliminated via pinocytosis or an Fc receptor‐mediated process.24 Therefore, we included this mechanism in the model. The estimated rates of internalization of the bound aflibercept complex, VEGF secretion, and aflibercept degradation are provided in Table 2.
Model 4: Refined model
Last, the baseline model was refined to include features found to improve the fit to clinical data. The refined model accounted for degradation of free aflibercept, trapping of NRP‐bound VEGF, and internalization of bound aflibercept. In this case, the three VEGF secretion rates, aflibercept degradation rate, and the internalization rate of bound aflibercept were all free parameters. The optimal parameter values determined using the Bayesian calibration method are given in Table 2.
Comparison of optimized models
The posterior model probabilities, summarized in Table 1, quantify the plausibility of each model. Models that are more likely have a higher percentage compared to others. The model estimated to be most probable is that which, given the available data, involves the maximum number of non‐redundant (i.e., uncorrelated) parameters. That is, the model with the largest number of free parameters is not necessarily the most probable one, because it may contain redundant mechanisms. It is clear from the Bayesian model selection procedure that Models 1 and 3 are less plausible than the other models. Model 4 can fit the data, but contains an additional parameter to achieve this compared to Model 2. It is thus penalized and has a posterior model probability value smaller than Model 2, indicating that the additional complexity introduced is not justifiable. In contrast, the added complexity of Model 2 enables a better representation of the clinical data compared to the baseline model. We note that the steady state VEGF concentrations in tumor predicted by Models 1 and 3 are significantly higher than any reported clinical measurements (Supplementary Table S1 and ref.15). In fact, Model 2 is the only model that predicted steady state concentrations of unbound VEGF in all compartments that are within the range of published measurements, even when accounting for uncertainty (Table 3). Thus, the steady state predictions provide additional support for the validity of Model 2.
Table 3.
Predicted concentrations of unbound VEGF
| Normal tissue | Plasma | Tumor tissue | |||||||
|---|---|---|---|---|---|---|---|---|---|
| Pretreatment[Link] (pM) | Post‐treatment[Link] (pM) | Fold‐change (mean)[Link] | Pretreatment (pM) | Post‐treatment (pM) | Fold‐change (mean) | Pretreatment (pM) | Post‐treatment (pM) | Fold‐change (mean) | |
| Baseline model | 0.06 | 0.06 | 0.89 | 1.4 | 0.06 | 0.04 | 8.2 × 10³ | 3.2 | 3.9 × 10⁻⁴ |
| (0–0.33)[Link] | (0–0.33) | (0.90) | (0–7.1) | (0–0.33) | (0.04) | (0–1.6 × 10⁴) | (1.9–4.3) | (3.9 × 10⁻⁴) | |
| Model 1 | 0.07 | 0.06 | 0.87 | 1.4 | 0.06 | 0.04 | 8.2 × 10³ | 3.2 | 3.9 × 10⁻⁴ |
| (0–0.23) | (0–0.31) | (0.42) | (0–4.9) | (0–0.31) | (0.05) | (0–2.9 × 10⁴) | (1.0–3.9) | (3.4 × 10⁻⁴) | |
| Model 2 | 0.99 | 0.06 | 0.06 | 1.5 | 0.06 | 0.04 | 1.52 × 10² | 0.16 | 1.1 × 10⁻³ |
| (0.56–1.4) | (0–0.28) | (0.06) | (0.85–2.2) | (0–0.29) | (0.04) | (86–2.2 × 10²) | (0–0.81) | (2.5 × 10⁻³) | |
| Model 3 | 0.13 | 0.06 | 0.45 | 1.3 | 0.06 | 0.05 | 7.7 × 10³ | 2.8 | 3.6 × 10⁻⁴ |
| (0–0.27) | (0–0.28) | (0.65) | (0–2.7) | (0–0.29) | (0.04) | (0–1.6 × 10⁴) | (1.5–4.6) | (3.8 × 10⁻⁴) | |
| Model 4 | 0.97 | 0.12 | 0.13 | 1.5 | 0.14 | 0.09 | 2.8 × 10² | 0.67 | 2.4 × 10⁻³ |
| (0.04–1.9) | (0–0.33) | (0.09) | (0.06–3.0) | (0–0.33) | (0.04) | (11–5.5 × 10²) | (0.02–1.5) | (2.7 × 10⁻³) | |
aPretreatment is the steady state concentration before any drug infusion.
bAflibercept was administered once per week for two weeks at a dose of 3 mg/kg. Post‐treatment is the concentration 7 days after the second dose. The fold‐change is calculated as the post‐treatment concentration of unbound vascular endothelial growth factor divided by the pretreatment concentration.13
cMean of the calculated fold‐change for all Transitional Markov Chain Monte Carlo samples.
dRanges shown for pretreatment and post‐treatment concentrations are the ranges containing 90% of the parameter sets from the posterior probability distribution function (total uncertainty, TU).
Clinically relevant predictions
We can use the most probable model to provide new predictions. Specifically, the model is applied to predict the concentrations of VEGF and unbound and bound aflibercept in the tissue compartments, which are difficult to quantify experimentally. Model 2 predicts the concentrations of unbound VEGF before administration of aflibercept to be 1.0, 1.5, and 152 pM in normal tissue, plasma, and tumor tissue, respectively (Table 3). We simulated two administrations of aflibercept at a dosage of 3 mg/kg, and the predicted concentration profiles for free and bound aflibercept in all three compartments are shown in Figure 4. Similar results are predicted for other doses; therefore, we only present predictions for a single, intermediate dose. The concentration of unbound VEGF in the tumor is predicted to be an order of magnitude higher than the plasma concentration, which agrees with clinical measurements. We have previously defined the “fold‐change” to quantify the concentration of unbound VEGF at a specific time after anti‐VEGF treatment relative to the steady state level before treatment.13 The model predicts that one week after the second dose (t = 21 weeks), the fold‐change in unbound VEGF in normal tissue, plasma, and tumor tissue is 0.06, 0.04, and 1.1 × 10⁻³, respectively (Table 3). The concentration of unbound aflibercept in the tissue compartments is predicted to track closely with the plasma concentration over the simulated time range, with the exception of 12 hours immediately after each dose. In contrast, the concentration of the aflibercept/VEGF complex in tumor tissue is several fold higher than the concentration of bound aflibercept in plasma and normal tissue (Figure 4).
Figure 4.
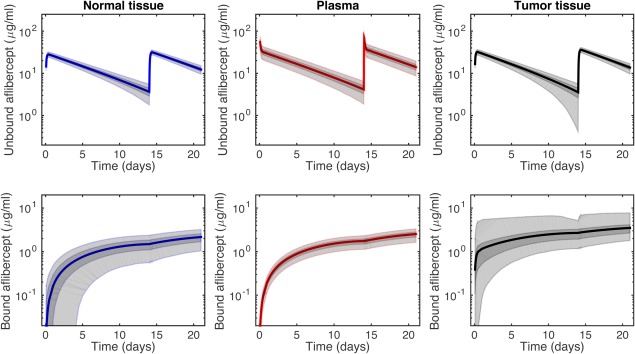
Predicted aflibercept concentrations from Model 2. Concentration profiles predicted by the most probable model with aflibercept treatment of 3 mg/kg. Free and bound aflibercept in the three compartments: (a) normal; (b) plasma; and (c) tumor. Dark gray shading denotes the interquantile range (IQR), which contains ∼50% of posterior probability density function predictions. Light gray bands indicate the range of predictions given the total uncertainty and contain ∼90% of predictions.
DISCUSSION AND CONCLUSION
We have presented a molecular‐detailed PK model that predicts the transport and distribution of VEGF and aflibercept, an antiangiogenic agent that targets VEGF in the human body. The concentrations of free and bound aflibercept in plasma predicted by the model match clinical measurements obtained from human patients with cancer. By inferring, through a Bayesian framework, the model structure and parameters using clinical data, we gain insight into the mechanisms involved in aflibercept's antiangiogenic activity and are able to estimate PK parameters of interest, including the rates of degradation and internalization of the drug. We also estimate the rates at which muscle cells, endothelial cells, and tumor cells secrete VEGF. Additionally, the molecular detail of the model enables identification of specific interactions and transport processes that influence the distribution of the anti‐VEGF agent.
Based on the data‐driven Bayesian inference method, we found that including degradation of aflibercept (bound and unbound) in the tissue compartments and permitting aflibercept to bind NRP‐bound VEGF are necessary to provide the most plausible network structure given the available clinical data. Specifically, our results suggest that accounting for aflibercept clearance as the primary means of aflibercept's removal from the body, as found in clinical PK studies23 (and represented in the baseline model), is not sufficient to describe the clinical measurements of unbound and bound aflibercept in plasma. Instead, proteolysis in tissues must also be accounted for. Thus, the clearance rate obtained by PK studies may be an overestimation, as it also includes aflibercept removal via proteolysis in the tissue. Additionally, the ability of aflibercept to bind NRP‐bound VEGF may be another mechanism by which aflibercept inhibits angiogenesis signaling. Thus, quantifying the effects of aflibercept molecular interactions provides novel and clinically relevant insight and proposes new, testable hypotheses.
The Bayesian inference methodology provides a quantitative measure as to the probability of the various models given the available clinical data. The Bayesian model inference estimates Model 2 to be most probable, indicating that aflibercept binding to NRP‐bound VEGF contributes to the distribution of aflibercept in the body. Our previous local13–15 and global21 sensitivity analyses support the importance of NRP‐bound VEGF, in which the binding affinity of VEGF for NRPs, the density of the co‐receptors, and the rate at which NRPs are internalized strongly influence the amount of unbound VEGF in the body. Thus, NRPs are shown to contribute to VEGF distribution, and it is important to consider the effect of trapping NRP‐bound VEGF. To our knowledge, clinical measurements of the number of VEGF‐bound NRPs and the formation of anti‐VEGF/VEGF/NRP complexes have not been obtained. In the absence of these data, our model provides a framework to test hypotheses regarding the molecular interactions of aflibercept and how those interactions contribute to its plasma concentration.
Another valuable output of the Bayesian inference approach is parameter estimation. Of particular interest is the rate of VEGF secretion by endothelial cells, muscle fibers, and tumor cells, as there is a lack of experimental measurements with which to specify these rates. The total uncertainty provides an indication of the identifiability of an estimated parameter. In all of the Models examined, the rate of VEGF secretion by endothelial cells and tumor cells could be estimated with low uncertainty. For the most probable model, the tumor VEGF secretion rate is estimated to be more than an order of magnitude higher than the estimated endothelial cell VEGF secretion rate (0.387 vs. 0.0324 molecules/cell/s). The uncertainty in the inferred values for the rates of degradation of unbound aflibercept and internalization of bound aflibercept can span up to five orders of magnitude, indicating that these parameters are difficult to estimate given the available data. The main reason for the large TU estimated for these parameters is that the available clinical data only measure concentrations of a subgroup of species and not of all the species interacting in the system ordinary differential equations. Thus, it is possible to find alternative mechanisms to generate the observed quantities. As an example, the concentration of free VEGF can decrease because of either degradation or binding with aflibercept. Thus, we can find manifolds in the parameter space that result in the same quantities of interest using different reaction mechanisms. The large TU highlights the need to perform experiments that can quantify more of the species included in the model and alleviate the parameter identifiability.
Our recent computational study of VEGF concentrations in humans before and after anti‐VEGF treatment21 provides interesting comparisons to the current study. The previous model predicted, under certain conditions, a “counter‐therapeutic” response of plasma VEGF after administration of the anti‐VEGF agent bevacizumab.15 Interestingly, a counter‐therapeutic response of tumor VEGF is only predicted to occur in cases in which the tumor cells secrete a low amount of VEGF, and unbound VEGF in normal tissue is not predicted to increase after anti‐VEGF treatment. In contrast, after a single dose of aflibercept, unbound VEGF is essentially depleted in all three compartments, even after a single dose. A detailed study of the differences in responses to bevacizumab and aflibercept is outside of the scope of the current investigation; however, the molecular‐detailed nature of our model provides a framework with which to examine the mechanisms that contribute to those differences.
Although the model complexity, in terms of the number of equations and parameters, can be viewed as a potential disadvantage of the model, the molecular detail allows us to interpret the results mechanistically. For example, it is not possible to lump the two VEGF isoforms (VEGF121 and VEGF165), because they have different binding partners and affinities. Because of the intrinsic properties of the two isoforms, they are present in the tissue compartments in very different forms: VEGF165 is primarily bound to the extracellular matrix, whereas VEGF121 is largely in soluble form in the plasma and interstitial spaces. Our model predicts these different distributions.15 Thus, we believe that the model must retain the current level of detail in order to capture the unique dynamics of the VEGF isoforms and aflibercept and provide novel mechanistic insight into the effects of the species' molecular interactions, which are not possible with less molecular‐detailed models.
In summary, our data‐driven, molecular‐detailed model enables evaluation of the effect of specific molecular interactions between the drug, its target, and other molecular species in the body. Thus, the model is useful in discriminating between alternative mechanisms of action of the anti‐VEGF agent aflibercept. Our model can aid drug development efforts, particularly with respect to personalized medicine. The model would serve as an “in silico clinic” to predict the effects of various drugs with molecular targets in specific patient populations. We have already identified model predictions that are relevant to personalized medicine,15 and the work described herein also contributes to these efforts.
Study Highlights
WHAT IS THE CURRENT KNOWLEDGE ON THE TOPIC?
Aflibercept is a soluble decoy receptor inhibitor of VEGF approved for the treatment of metastatic colorectal cancer. Current PK models of aflibercept estimate PK parameters for free and bound aflibercept in patients with solid tumors, but do not identify specific molecular processes that influence drug distribution.
WHAT QUESTION DID THIS STUDY ADDRESS?
This study applies a data‐driven molecular‐detailed PK model of aflibercept to investigate the specific molecular interactions and transport processes that contribute to the distribution of aflibercept in the body and its mechanism of action.
WHAT THIS STUDY ADDS TO OUR KNOWLEDGE
The model predicts the concentrations of free and bound aflibercept in tissue and plasma for various doses of the drug. Aflibercept binding to VEGF bound to NRP co‐receptors must be included in order for the model predictions to match clinical measurements.
HOW THIS MIGHT CHANGE CLINICAL PHARMACOLOGY AND THERAPEUTICS
The model predicts potential mechanisms through which aflibercept targets VEGF. This insight can be combined with preclinical and clinical drug development studies.
Supporting information
Supporting Information
Supporting Information
Supporting Information
Supporting Information
Supporting Information
Supporting Information
Supporting Information
Supporting Information
Supporting Information
Acknowledgments
This work was supported by the National Institutes of Health (R01 CA138264 to A.S.P. and F32 CA154213 to S.D.F.) and the UNCF‐Merck Science Initiative (to S.D.F.). P.K. and P.A. acknowledge support from the European Research Council (Advanced Investigator Award No. 341117).
Author Contributions. S.D.F., P.A., P.K., and A.P. wrote the manuscript. S.D.F. and A.P. designed the research. S.D.F. and P.A. performed the research. S.D.F., P.A., P.K., and A.P. analyzed the data.
Conflict of Interest. The authors declared no conflict of interest.
References
- 1. Rudge, J.S. et al VEGF Trap complex formation measures production rates of VEGF, providing a biomarker for predicting efficacious angiogenic blockade. Proc. Natl. Acad. Sci. USA 104, 18363–18370 (2007). [DOI] [PMC free article] [PubMed] [Google Scholar]
- 2. Zhou, Q. & Gallo, J.M. The pharmacokinetic/pharmacodynamic pipeline: translating anticancer drug pharmacology to the clinic. AAPS J. 13, 111–120 (2011). [DOI] [PMC free article] [PubMed] [Google Scholar]
- 3. Gallo, J.M. Pharmacokinetic/pharmacodynamic‐driven drug development. Mt. Sinai J. Med. 77, 381–388 (2010). [DOI] [PMC free article] [PubMed] [Google Scholar]
- 4. Mager, D.E. & Jusko, W.J. Development of translational pharmacokinetic‐pharmacodynamic models. Clin. Pharmacol. Ther. 83, 909–912 (2008). [DOI] [PMC free article] [PubMed] [Google Scholar]
- 5. Kuepfer, L. , Lippert, J. & Eissing, T. Multiscale mechanistic modeling in pharmaceutical research and development In: Advances in Systems Biology (eds. Goryanin I.I. & Goryachev A.B.) 543–561 (Springer New York, New York, 2012). [DOI] [PubMed] [Google Scholar]
- 6. Rowland, M. , Peck, C. & Tucker, G. Physiologically‐based pharmacokinetics in drug development and regulatory science. Annu. Rev. Pharmacol. Toxicol. 51, 45–73 (2011). [DOI] [PubMed] [Google Scholar]
- 7. Sharan, S. & Woo, S. Systems pharmacology approaches for optimization of antiangiogenic therapies: challenges and opportunities. Front. Pharmacol. 6, 33 (2015). [DOI] [PMC free article] [PubMed] [Google Scholar]
- 8. Finley, S.D. , Chu, L.H. & Popel, A.S. Computational systems biology approaches to anti‐angiogenic cancer therapeutics. Drug Discov. Today 20, 187–197 (2015). [DOI] [PMC free article] [PubMed] [Google Scholar]
- 9. Thai, H.T. , Veyrat‐Follet, C. , Mentré, F. & Comets, E. Population pharmacokinetic analysis of free and bound aflibercept in patients with advanced solid tumors. Cancer Chemother. Pharmacol. 72, 167–180 (2013). [DOI] [PubMed] [Google Scholar]
- 10. Thai, H.T. , Mentré, F. , Holford, N.H. , Veyrat‐Follet, C. & Comets, E. Evaluation of bootstrap methods for estimating uncertainty of parameters in nonlinear mixed‐effects models: a simulation study in population pharmacokinetics. J. Pharmacokinet. Pharmacodyn. 41, 15–33 (2014). [DOI] [PubMed] [Google Scholar]
- 11. Panoilia, E. et al A pharmacokinetic binding model for bevacizumab and VEGF165 in colorectal cancer patients. Cancer Chemother. Pharmacol. 75, 791–803 (2015). [DOI] [PMC free article] [PubMed] [Google Scholar]
- 12. Stefanini, M.O. , Wu, F.T. , Mac Gabhann, F. & Popel, A.S. A compartment model of VEGF distribution in blood, healthy and diseased tissues. BMC Syst. Biol. 2, 77 (2008). [DOI] [PMC free article] [PubMed] [Google Scholar]
- 13. Finley, S.D. , Engel‐Stefanini, M.O. , Imoukhuede, P.I. & Popel, A.S. Pharmacokinetics and pharmacodynamics of VEGF‐neutralizing antibodies. BMC Syst. Biol. 5, 193 (2011). [DOI] [PMC free article] [PubMed] [Google Scholar]
- 14. Finley, S.D. & Popel, A.S. Predicting the effects of anti‐angiogenic agents targeting specific VEGF isoforms. AAPS J. 14, 500–509 (2012). [DOI] [PMC free article] [PubMed] [Google Scholar]
- 15. Finley, S.D. & Popel, A.S. Effect of tumor microenvironment on tumor VEGF during anti‐VEGF treatment: systems biology predictions. J. Natl. Cancer Inst. 105, 802–811 (2013). [DOI] [PMC free article] [PubMed] [Google Scholar]
- 16. Angelikopoulos, P. , Papadimitriou, C. & Koumoutsakos, P. Bayesian uncertainty quantification and propagation in molecular dynamics simulations: a high performance computing framework. J. Chem. Phys. 137, 144103 (2012). [DOI] [PubMed] [Google Scholar]
- 17. Hadjidoukas, P.E. , Angelikopoulos, P. , Rossinelli, D. , Alexeev, D. , Papadimitriou, C. & Koumoutsakos, P. Bayesian uncertainty quantification and propagation for discrete element simulations of granular materials. Comput. Methods Appl. Mech. Eng. 282, 218–238 (2014). [Google Scholar]
- 18. Hadjidoukas, P.E. , Angelikopoulos, P. , Papadimitriou, C. & Koumoutsakos, P. Π4U: A high performance computing framework for Bayesian uncertainty quantification of complex models. J. Comput. Phys. 284, 1–21 (2015). [Google Scholar]
- 19. Imoukhuede, P.I. & Popel, A.S. Quantification and cell‐to‐cell variation of vascular endothelial growth factor receptors. Exp. Cell Res. 317, 955–965 (2011). [DOI] [PMC free article] [PubMed] [Google Scholar]
- 20. Imoukhuede, P.I. & Popel, A.S. Expression of VEGF receptors on endothelial cells in mouse skeletal muscle. PLoS One 7, e44791 (2012). [DOI] [PMC free article] [PubMed] [Google Scholar]
- 21. Finley, S.D. , Dhar, M. & Popel, A.S. Compartment model predicts VEGF secretion and investigates the effects of VEGF trap in tumor‐bearing mice. Front. Oncol. 3, 196 (2013). [DOI] [PMC free article] [PubMed] [Google Scholar]
- 22. Stefanini, M.O. , Wu, F.T. , Mac Gabhann, F. & Popel, A.S. The presence of VEGF receptors on the luminal surface of endothelial cells affects VEGF distribution and VEGF signaling. PLoS Comput. Biol. 5, e1000622 (2009). [DOI] [PMC free article] [PubMed] [Google Scholar]
- 23. Lockhart, A.C. et al Phase I study of intravenous vascular endothelial growth factor trap, aflibercept, in patients with advanced solid tumors. J. Clin. Oncol. 28, 207–214 (2010). [DOI] [PMC free article] [PubMed] [Google Scholar]
- 24. Dixon, J.A. , Oliver, S.C. , Olson, J.L. & Mandava, N. VEGF Trap‐Eye for the treatment of neovascular age‐related macular degeneration. Expert Opin. Investig. Drugs 18, 1573–1580 (2009). [DOI] [PubMed] [Google Scholar]
Associated Data
This section collects any data citations, data availability statements, or supplementary materials included in this article.
Supplementary Materials
Supporting Information
Supporting Information
Supporting Information
Supporting Information
Supporting Information
Supporting Information
Supporting Information
Supporting Information
Supporting Information