

Abstract
Achieving hypertension (HTN) control and mitigating the adverse health effects associated with HTN continues to be a global challenge. Some individuals respond poorly to current HTN therapies, and mechanisms for response variation remain poorly understood. We used a nontargeted metabolomics approach (gas chromatography time‐of‐flight/mass spectrometry gas chromatography time‐of‐flight/mass spectrometry) measuring 489 metabolites to characterize metabolite signatures associated with treatment response to anti‐HTN drugs, atenolol (ATEN), and hydrochlorothiazide (HCTZ), in white and black participants with uncomplicated HTN enrolled in the Pharmacogenomic Evaluation of Antihypertensive Responses study. Metabolite profiles were significantly different between races, and metabolite responses associated with home diastolic blood pressure (HDBP) response were identified. Metabolite pathway analyses identified gluconeogenesis, plasmalogen synthesis, and tryptophan metabolism increases in white participants treated with HCTZ (P < 0.05). Furthermore, we developed predictive models from metabolite signatures of HDBP treatment response (P < 1 × 10⁻⁵). As part of a quantitative systems pharmacology approach, the metabolites identified herein may serve as biomarkers for improving treatment decisions and elucidating mechanisms driving HTN treatment responses.
Study Highlights.
WHAT IS THE CURRENT KNOWLEDGE ON THE TOPIC? ☑ The adverse health effects of HTN have been well characterized, and the impact of ATEN on metabolite signatures has been previously investigated. • WHAT QUESTIONS DID THIS STUDY ADDRESS? ☑ How endogenous metabolites and biological pathways are impacted in subjects treated with either ATEN or HCTZ.• WHAT THIS STUDY ADDS TO OUR KNOWLEDGE ☑ Biological pathways indicating changes in gluconeogenesis and tryptophan metabolism were impacted upon treatment with HCTZ. Furthermore, multivariable models of metabolites are capable of predicting treatment response to patients administered ATEN or HCTZ. • HOW THIS MIGHT CHANGE CLINICAL PHARMACOLOGY AND THERAPEUTICS ☑ The work presented here is an early step toward identifying metabolite biomarkers for treatment response to hypertensive therapies.
Hypertension (HTN) remains a public health burden affecting about one‐third of US adults and more than one billion individuals worldwide.1, 2 Response to antihypertensive treatment also varies among individuals with some individuals remaining resistant to certain therapies, and only about 50% of patients treated with antihypertensive therapies achieve blood pressure (BP) control.1, 3, 4, 5 Ethnic differences regarding both side effects and drug efficacy have been noted between white and black populations prescribed antihypertensives.3, 5 For these reasons, the current approach for treatment of HTN is suboptimal. Thus, identifying predictors associated with BP response of antihypertensive therapies would be of value in optimizing treatment selection, and ultimately reduce morbidity and mortality by improving BP control. Significant contributions to the development of more effective therapies can be made by developing a deeper understanding of the mechanism of action of current therapies, and mapping of pathways implicated in both treatment response and side effects.
Atenolol (ATEN) is a cardioselective beta‐adrenergic receptor blocker that was previously a first‐line treatment for HTN, but has more recently been downgraded because of its reduced efficacy at preventing adverse cardiovascular events compared with some other antihypertensive agents.3, 6 Whether this reduced efficacy is due to ATEN's short duration of action and need for twice daily dosing, despite it typically being prescribed only once a day, is unclear. Clarifying the metabolic pathways impacted by ATEN treatment may help to identify which patients will respond favorably to ATEN treatment and can provide new insights for improved drug development. In a previous publication, we identified an initial metabolic signature of ATEN exposure.7 In this study, we expand upon these findings and construct a multivariable predictive model of home diastolic blood pressure (HDBP) response after ATEN treatment and interrogate pathways impacted upon ATEN treatment.
Hydrochlorothiazide (HCTZ) is a thiazide diuretic and is considered a first‐line therapy for all populations.3 Additionally, HCTZ is largely well tolerated and considered comparably effective to many other treatment options, including angiotensin converting enzyme inhibitors, calcium channel blockers, and angiotensin receptor blockers.3 For black individuals, thiazide‐based treatments are considered preferable, based on evidence that they offer superior prevention of cerebrovascular effects, heart failure, and other outcomes when compared to angiotensin converting enzyme inhibitor treatments.3, 4 HCTZ is also widely available and inexpensive. However, there remains a significant portion of both black and white individuals that are resistant to HCTZ therapy, and, presently, no biomarkers exist that are capable of identifying which of these patients will experience adverse outcomes or which patients will be resistant to treatment. Identifying putative biomarkers and metabolic pathways implicated in this disparity of response is a goal of the present study.
Metabolomics, the study of metabolism at an “omic” level, integrates naturally with quantitative systems pharmacology approaches, and aims to improve our understanding of drug mechanisms of action and the molecular basis for drug response variation.8 Recently, several studies successfully used pharmacometabolomics to identify novel biomarkers and explain variation in drug response (e.g., sertraline, escitalopram, aspirin).8, 9, 10, 11, 12, 13, 14 Furthermore, metabolic phenotypes have been used to explain variation in BP across ethnic groups.13 In the present study, we used a nontargeted metabolomics approach in which we measured 489 metabolites (of both known and unknown annotation) in 206 and 227 participants treated with HCTZ and ATEN, respectively, to define metabolites significantly altered after exposure to either drug and significantly associated with change in HDBP. Furthermore, we performed exploratory analysis and constructed multivariable models predictive of changes in HDBP. Overall, through the systems‐level metabolomics approach, our study provides new insights into the potential biological mechanisms of HTN and BP response in white and black individuals, and provides candidate metabolites as potential new biomarkers.
METHODS
Study population
Subjects were enrolled in the Pharmacogenomic Evaluation of Antihypertensive Responses study at the University of Florida (Gainesville, FL), Emory University (Atlanta, GA), and the Mayo Clinic (Rochester, MN). Pharmacogenomic Evaluation of Antihypertensive Responses is registered at clinicaltrials.gov, http://clinicaltrials.gov/ct2/show/NCT00246519. Enrolled participants were primary care patients of any self‐identified race or ethnicity, aged 17–65 years, with newly diagnosed, untreated, or treated, mild‐to‐moderate essential HTN. Plasma samples and associated clinical data were obtained from 128 white participants and 109 black participants randomly assigned to receive ATEN monotherapy, and 123 white participants and 83 black participants randomly assigned to receive HCTZ monotherapy. Individuals with cardiovascular disease, primary renal or hepatic disease, or diabetes mellitus (type I or II) were excluded from participating. Nineteen participants were taking statins before starting the trial or initiated statin treatment during the trial. However, statin was not incorporated into subsequent analyses because stratification of metabolic profiles by statin status was not statistically significantly different (P > 0.1). Additional details regarding the study population have been previously published in Johnson et al.15
Study protocol
The Pharmacogenomic Evaluation of Antihypertensive Responses protocol was approved by the institutional review boards at all study sites (University of Florida, Mayo Clinic, and Emory University) and after providing voluntary informed consent, all study participants were randomly assigned to either ATEN or HCTZ therapies. A minimum washout period of 18 days was initiated for any participant already receiving treatment for HTN. Upon completion of baseline measurements, 50 mg daily or 12.5 mg daily was initiated for ATEN or HCTZ groups, respectively. After three weeks of treatment, and based on BP >120/70 mmHg and tolerability, subjects were titrated to 100 mg daily or 25 mg daily for ATEN and HCTZ groups, respectively. BP was recorded in triplicate upon rising from bed in the morning and before retiring in the evening. The morning and evening recorded triplicate BP measurements were subsequently averaged. BP measurements were obtained using a Microlife model 3AC1‐PC home BP monitor (BP Microlife, Minneapolis, MN).15 In addition to baseline BP measurements, post‐treatment BP was assessed after nine weeks of treatment. Baseline (before drug administration) and posttreatment plasma samples were collected during study visits under fasting conditions. Dietary information (e.g., food intake, food preference, sodium intake) were not recorded, although subjects were asked to maintain a steady diet during participation in the study, which minimizes the impact of dietary intake on the metabolite measurements. Additional information regarding the study design details have been previously published in Johnson et al.15
Metabolomic profiling
Study design information was entered into the miniX database (a simplified version of the SetupX database).16 All plasma samples were aliquoted and stored at −80°C until use, at which point 30 µL of each sample was thawed, extracted, and derivatized.17 Briefly, 30 µL aliquots were extracted with 1 mL of degassed acetonitrile:isopropanol:water (3:3:2) at −20°C, centrifuged, aliquoted into two portions, and evaporated to complete dryness. Acetonitrile/water (1:1) was used to remove membrane lipids and triglycerides and the supernatant was again dried down. Internal standards C8–C30 FAMEs were added and the sample was derivatized using methoxyamine hydrochloride in pyridine and subsequently by MSTFA (Sigma‐Aldrich) for trimethylsilylation of acidic protons. All metabolites were measured as peak height. A total of 489 metabolites were measured (224 known and 265 unknown metabolites). Gas chromatography time‐of‐flight/mass spectrometry data acquisition and processing were conducted, as previously described.7
Data processing and statistical analysis
All data processing and analysis was performed in the open‐source statistical software, R.18 Initial processing of the data included testing to determine if the peak height of each metabolite was normally distributed based on whether the data were skewed more or less upon natural log transformation. If data for a metabolite were skewed less upon natural log transformation, then the metabolite data was transformed and used for all subsequent analysis. Skewness was determined by the ratio of the number of metabolites that were <1 σ to the number of metabolites that were >1 σ from the mean (Supplemental Figures S1 and S2). Samples were considered outliers if +/− 5 median absolute deviations from the median, and were subsequently removed from further analysis.
Signature of exposure
Metabolites significantly altered by treatment with either ATEN or HCTZ were determined using a pairwise Wilcoxon signed‐rank test and testing both with and without stratifying by race. False discovery rate was used to correct for multiple comparisons.19 Metabolites with a q < 0.2 were considered to be statistically significant.
Signature of response
Comparisons of the number of participants of each race that did not respond to treatment with a decrease in HDBP were tested using a Fisher's exact test. Univariate linear regression analysis was used to test associations between HDBP and each covariate (baseline HDBP, baseline levels of renin, insulin, glucose, homeostasis model of assessment, triglyceride, uric acid, high‐density lipoprotein, low‐density lipoprotein, and race, gender, waist size (cm), age, and body mass index). Covariates associated with HDBP with P < 0.05 were considered to be statistically significant and were included in the linear metabolomics model to control for confounding. Subsequently, associations were performed using the initial/baseline metabolite level, post‐treatment level, and the change observed between the initial and posttreatment level. If two covariates were highly correlated (R2 > 0.15), then only the most significantly associated covariate was retained in the model. Associations were tested both with and without treatment stratification, and with and without race stratification.
Multivariable model
Before performing the multivariable associations, the dataset was partitioned into a discovery (50%) and validation set (50%) to internally assess potential predictive performance. Multivariable associations were determined by generating multiple regression models. Variable selection was performed by models with all combinations of the 15 most significant baseline metabolites and all significant covariates from the univariate analysis using the discovery data. Although significant metabolites were allowed to drop from the individual models during variable selection, all significant covariates were maintained in each model iteration. The model with the lowest BIC was carried forward and tested in the validation dataset. Overall model performance was evaluated by a Bonferroni corrected P value and R2 (with bootstrapped 95% confidence interval) using the validation data.
Hierarchical clustering
Significant metabolites for either white, black, or both groups treated with ATEN or HCTZ with q < 0.2 were used for clustering, respectively. Missing values were imputed with the median across metabolites for all other participants. Hierarchical clustering was performed using Modulated Modularity Clustering and Pearson correlation.20
Pathway analysis
Metabolite lists were created for each treatment/race subgroup from the signature of exposure results. Groups were defined by drug (ATEN or HCTZ), direction of metabolite association (increased or decreased), and race. In order to combine metabolite level to a pathway level score, a correlated Lancaster approach21 was performed using data from the Human Metabolome Database version 3.5,22 and International Union of Pure and Applied Chemistry International Chemical Identifier codes for annotation. This approach uses correlation information from permutation testing of all known metabolites in the study rather than using a list based on a metabolite significance threshold. Pathway significance values were adjusted for multiple comparisons using a Bonferroni correction with a significance threshold of P < 0.05.
RESULTS
The vast majority of participants (83.1%) treated with either ATEN or HCTZ experienced a decrease in HDBP over the course of the nine‐week treatment period, with an overall mean reduction in HDBP of −6.45 ± 0.16 mmHg (Figure 1). The white cohort treated with ATEN had the largest decrease in HDBP with a mean of −10.13 ± 0.6 mmHg. The black cohort treated with ATEN displayed the poorest response with a mean change in HDBP of −4.0 ± 0.64 mmHg and 77 (70.6%) participants recorded an overall decrease in HDBP. The white participants treated with HCTZ displayed a mean decrease in HDBP of −4.5 ± 0.51 mmHg with 102 of participants (83%) with an overall decrease in HDBP. Last, the black participants treated with HCTZ had a mean change in HDBP of −6.8 ± 0.73 mmHg, and 66 participants (79.5%) displayed an overall decrease in HDBP. Distributions of responses were statistically significantly different (q < 0.05, with matching letters) between ATEN and HCTZ across all groups when both combined and separated by race (Figure 1).
Figure 1.
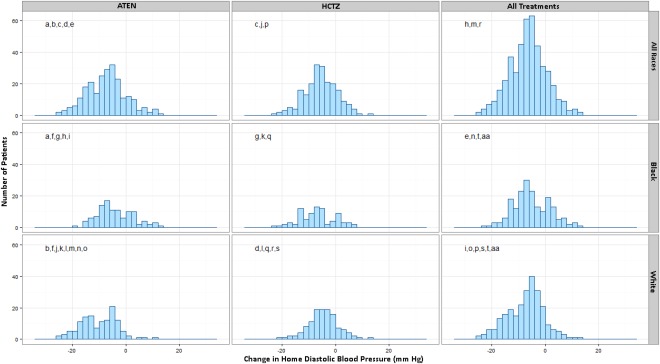
Histograms of change in HDBP in participants treated with HCTZ or ATEN. Each panel represents the distribution of change in HDBP with columns stratifying groups by treatment of ATEN, HCTZ, or combining all participants. Rows combine all participants or stratify by race. Panels with matching letters represent groups that displayed statistically significant differences in HDBP response (q < 0.1).
Signature of exposure to ATEN and HCTZ
The baseline metabolic profiles were significantly different between the black and white cohorts, based on a paired Wilcoxon rank test (P < .001), confirming the need to stratify the analyses by race. Additional information detailing our results from this analysis can be found in the supplementary material (Supplementary Table S1).
The eight most significantly changed metabolites in the white group treated with HCTZ were uric acid, ribonic acid, 1‐hexadecanol, kynurenine, glycerol‐gulo‐heptose NIST, dihydroabietic acid, behenic acid, and glucose‐1‐phosphate (Table 1). Four metabolites were significantly increased (q < 0.1) in the black group treated with HCTZ (uric acid, propane‐1‐2‐3‐tricarboxylate NIST, 223865, 455836). Although four metabolites were significantly decreased (q < 0.1) in the white group treated with HCTZ, glycine was the only identified metabolite (glycine, 217797, 294266, 228983). Overall, there were five metabolites significantly decreased (q < 0.1) in the black group treated with HCTZ composed of phytol, 428330, 200906, 617225, and phosphoethanolamine (Table 1).
Table 1.
Hydrochlorothiazide: metabolic signature of exposure (q < 0.2)
| White participants (n = 123) | Black participants (n = 83) | |||||||||||
|---|---|---|---|---|---|---|---|---|---|---|---|---|
| Direction of association | Metabolite | Pretreatment median | Posttreatment median | Difference | P value | q value | Metabolite | Pretreatment median | Posttreatment median | Difference | P value | q value |
| Increased b | Uric acid | 50,143 | 62,808 | 12,665 | 3.93E‐11 | 1.91E‐08 | Uric acid | 48,159 | 62,892 | 14,733 | 1.83E‐08 | 8.90E‐06 |
| Ribonic acid | 6.33a | 6.48a | 0.15a | 7.48E‐07 | 0.0002 | Propane‐1,2,3‐tricarboxylate NIST | 6.73a | 7.05a | 0.32a | 0.0006 | 0.0472 | |
| 228,583 | 6.17a | 6.39a | 0.22a | 3.52E‐06 | 0.0006 | 223,865 | 6.52a | 6.84a | 0.32a | 0.0006 | 0.0472 | |
| 338,896 | 566 | 670 | 104 | 8.80E‐06 | 0.0011 | 455,836 | 792 | 928.50 | 136.5 | 0.0010 | 0.0612 | |
| 1‐Hexadecanol | 6.16a | 6.31a | 0.15a | 1.77E‐05 | 0.0014 | 470,983 | 7.85a | 8.52a | 0.67a | 0.0038 | 0.1682 | |
| Erythritol | 2,900 | 3,224 | 324 | 1.73E‐05 | 0.0014 | 571,392 | 7.31a | 7.48a | 0.17a | 0.0044 | 0.1780 | |
| Kynurenine | 6.31a | 6.42a | 0.10a | 2.54E‐05 | 0.0018 | 340,252 | 1,087 | 1,393 | 306 | 0.0048 | 0.1815 | |
| Glycero‐ gulo‐heptose NIST | 6.37a | 6.52a | 0.15a | 2.93E‐05 | 0.0018 | 339,431 | 636 | 821 | 185 | 0.0053 | 0.1860 | |
| 223,597 | 380.5 | 450 | 69.5 | 4.89E‐05 | 0.0026 | |||||||
| 223865 | 6.38a | 6.79a | 0.42a | 6.56E‐05 | 0.0032 | |||||||
| Dihydroabietic acid | 6.76a | 6.85a | 0.09a | 7.33E‐05 | 0.0032 | |||||||
| 2‐ketoisocaproic acid major | 1,061 | 1,378 | 317 | 9.97E‐05 | 0.0040 | |||||||
| Aconitic acid | 385 | 480.50 | 95.50 | 0.0001 | 0.0040 | |||||||
| Behenic acid | 1,437 | 1,583 | 146 | 0.0001 | 0.0043 | |||||||
| Glucose 1‐phosphate | 6.37a | 6.45a | 0.085a | 0.0001 | 0.0043 | |||||||
| Glycine | 12.08a | 12a | −0.08a | 0.0066 | 0.0340 | |||||||
| 217,797 | 579 | 565 | −14 | 0.0072 | 0.0358 | |||||||
| 294,266 | 6.85a | 6.79a | −0.06a | 0.0149 | 0.0600 | |||||||
| 228,983 | 6.23a | 6.17a | −0.06a | 0.0277 | 0.0922 | |||||||
| Decreased | 428,330 | 7.75a | 7.70a | −0.05a | 0.0491 | 0.1344 | Phytol | 6.74a | 6.59a | −0.15a | 2.98E‐05 | 0.0073 |
| Threonine | 47,018 | 43,279 | −3,739 | 0.0521 | 0.1394 | 428,330 | 7.82a | 7.73a | −0.09a | 0.0003 | 0.0460 | |
| Aminomalonic acid | 8.31a | 8.25a | −0.06a | 0.0552 | 0.1443 | 200,906 | 869 | 758 | −111 | 0.0004 | 0.0472 | |
| 218,951 | 6.42a | 6.36a | −0.06a | 0.0556 | 0.1443 | 617,225 | 6.78a | 6.68a | −0.10a | 0.0007 | 0.0472 | |
| 446,067 | 30,594 | 27,414 | −3,180 | 0.0585 | 0.1484 | Phosphoethanolamine | 7.34a | 7.18a | −0.16a | 0.0018 | 0.0945 | |
| Glutamine | 201,749 | 188,413 | −13,336 | 0.0686 | 0.1662 | Methoxytyrosine NIST | 6.43a | 6.22a | −0.21a | 0.0028 | 0.1356 | |
| 226,846 | 6.96a | 6.85a | −0.11a | 0.0729 | 0.1724 | |||||||
| Serine | 39,561 | 38,059 | −1,502 | 0.0798 | 0.1834 | |||||||
Values for these metabolites are log‐transformed.
Top 15 most significant metabolites presented here of a total of 201 metabolites (q < 0.2).
Clustering of significant metabolites in signature of exposure
Twenty‐nine unique metabolites at baseline were significantly associated with ATEN exposure in either the black, white, or both groups (q < 0.2) and were clustered together using Modulated Modularity Clustering.20 A group of eight metabolites (300379, 240264, nicotinic acid, 239995, 210904, 566053, 210901, and 516629) were clustered together with an absolute average correlation of 0.43. The remaining cluster, composed of the additional 21 metabolites, had an average absolute correlation of 0.11 (Supplementary Figure S1).
A total of 170 unique metabolites were associated at baseline with HCTZ treatment in the white, black, or both groups (q < 0.1). Overall, 5 clusters were identified with 10, 6, 5, 8, and 141 metabolites, respectively, and absolute average correlation coefficients of 0.78, 0.77, 0.73, 0.65, and 0.11, respectively (Figure 2).
Figure 2.
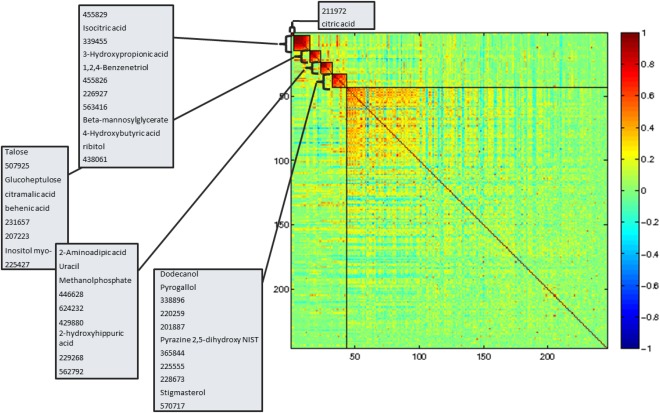
Hierarchical clustering of metabolites altered upon treatment of HCTZ (q < 0.2). The boxes on the heat map outline significant modules and are annotated with the metabolites within each module. The x‐axis and y‐axis are metabolites and the shade of color represents the Pearson correlation.
Signature of response to ATEN and HCTZ
Baseline metabolite associations with HDBP response
Patient distributions of HDBP response confirmed that, although most participants in each group experienced lower HDBP after treatments with ATEN or HCTZ, there was a statistically significant difference between the responses observed in black and white groups for either treatments (Figure 1). Initial tests were conducted to determine the associations of baseline metabolites with changes in HDBP. The 5‐methoxytryptamin was the only metabolite at baseline that was associated with a change in HDBP for the white group treated with ATEN (q < 0.2), and exhibited a negative association. However, seven metabolites were associated at baseline with a change in HDBP for the black group treated with ATEN, with all but three being unidentified (2,4‐diaminobutyric acid, arabitol, and O‐acetylserine; Table 2).
Table 2.
Baseline metabolites associated with change in HDBP (q < .20)
| Atenolol | Hydrochlorothiazide | |||||||
|---|---|---|---|---|---|---|---|---|
| Race | Metabolite | P value | q value | Association | Metabolite | P value | q value | Association |
| All | O‐acetylserinea | 0.001 | 0.030 | Negative | Palmitoleic acida | 0.003 | 0.086 | Positive |
| 483390a | 0.001 | 0.041 | Positive | Salicylic acida | 0.007 | 0.007 | Positive | |
| 213253a | 0.003 | 0.081 | Positive | |||||
| 6‐deoxyglucitol NISTa | 0.008 | 0.167 | Positive | |||||
| Beta‐mannosylglyceratea | 0.009 | 0.177 | Positive | |||||
| Fucose + rhamnosea | 0.009 | 0.180 | Positive | |||||
| 216043a | 0.011 | 0.198 | Positive | |||||
| White | 5‐Methoxytryptamineb | 0.009 | 0.176 | Negative | Arachidonic acidb | 0.002 | 0.067 | Positive |
| 223548b | 0.007 | 0.153 | Positive | |||||
| Black | 2,4‐diaminobutyric acidc | 0.002 | 0.068 | Negative | 223548c | 0.004 | 0.11 | Negative |
| 470983c | 0.002 | 0.074 | Negative | |||||
| 340257c | 0.003 | 0.078 | Negative | |||||
| 228377c | 0.003 | 0.094 | Positive | |||||
| Arabitolc | 0.004 | 0.101 | Positive | |||||
| O‐acetylserinec | 0.004 | 0.105 | Negative | |||||
| 483390c | 0.004 | 0.107 | Positive | |||||
HDBP, home diastolic blood pressure.
Adjusted for: gender, baseline glucose levels, baseline HDBP.
Adjusted for: baseline HDBP and baseline renin.
Adjusted for: baseline renin and baseline glucose levels.
Arachidonic acid and 223548 were the only metabolites associated at baseline with change in HDBP for the white group treated with HCTZ (q < 0.2), and both displayed positive associations. An unidentified metabolite, 223548, was also significantly associated with a change in HDBP at baseline in the black group treated with HCTZ. However, unlike in the white cohort, 223548 was negatively associated with change in HDBP in the black cohort (Table 2).
Metabolite changes associated with HDBP response
Metabolite change from baseline to posttreatment was tested for associations with HDBP response. In the white group treated with ATEN, changes in 4 metabolites (2 known: 2‐oxogluconic acid NIST and maltose) were significantly associated with a HDBP change (q < 0.05). In the black group treated with ATEN, the change in six metabolites was associated with HDBP response with four identified metabolites (isothreonic acid, gluconic acid, 4‐hydroxyproline, and indole‐3‐acetate; Table 3).
Table 3.
Metabolite changes associated with change in HDBP
| Atenolol | Hydrochlorothiazide | |||||||
|---|---|---|---|---|---|---|---|---|
| Race | Metabolite | P value | q value | Association | Metabolite | P value | q value | Association |
| All | Indole‐3‐acetatea | 4.47E‐06 | 0.0005 | Negative | Palmitoleic acidd | 0.003 | 0.086 | Positive |
| Gluconic acida | 7.23E‐05 | 0.005 | Negative | Salicylic acidd | 0.007 | 0.007 | Positive | |
| Inositol myo‐a | 8.75E‐05 | 0.006 | Negative | |||||
| 339186a | 0.0003 | 0.017 | Negative | |||||
| 226927a | 0.0008 | 0.033 | Negative | |||||
| 2‐oxogluconic acid NISTa | 0.0009 | 0.037 | Positive | |||||
| 199773a | 0.001 | 0.043 | Negative | |||||
| White | 2‐oxogluconic acid NISTb | 1.89E‐06 | 0.0002 | Positive | ||||
| Inositol myo‐b | 0.0001 | 0.008 | Negative | |||||
| 270066b | 0.0002 | 0.010 | Positive | |||||
| Maltoseb | 0.0004 | 0.020 | Negative | |||||
| Black | Erythritolc | 0.0001 | 0.007 | Negative | 437822e | 0.003 | 0.028 | Negative |
| Isothreonic acidc | 0.0001 | 0.009 | Negative | |||||
| Gluconic acidc | 0.0002 | 0.012 | Negative | |||||
| 228377c | 0.0002 | 0.012 | Positive | |||||
| 4‐hydroxyprolinec | 0.0003 | 0.017 | Positive | |||||
| Indole‐3‐acetatec | 0.001 | 0.046 | Negative | |||||
HDBP, home diastolic blood pressure; HOMA, homeostasis model of assessment.
Adjusted for: race, baseline renin, baseline HOMA, baseline triglycerides.
Adjusted for: baseline HDBP and baseline renin.
Adjusted for: baseline renin and baseline glucose levels.
Adjusted for: gender, baseline HDBP, baseline glucose levels.
Adjusted for: gender and baseline glucose levels.
Participants in the white group treated with HCTZ displayed no metabolite changes that were significantly associated with HDBP response at q < 0.05. In the black group treated with HCTZ, there was only a single, unidentified metabolic change (437822) that was associated with an HDBP response (q < 0.05; Table 3).
Multivariable model predictive of HDBP response
Using baseline metabolite profiles, models were developed to predict HDBP response for participants treated with either ATEN (Supplementary Figure S2) or HCTZ (Supplementary Figure S3) in order to identify metabolites that are associated with a good BP response regardless of the mode of therapy used. Models combining groups by either race or drug treatment performed better, presumably from increased statistical power with the increased number of participants. Models for All treatments‐All races, ATEN‐All races, HCTZ‐All races, and All treatments‐White were statistically significant for both discovery and validation sets with a multiple test corrected P < 0.006 with R2 values for the validation set of 0.19, 0.43, 0.49, and 0.33, respectively (Supplementary Figures S2, S3, and Figure 3). A summary of all results for the discovery and validation data can be seen in Figure 3.
Figure 3.
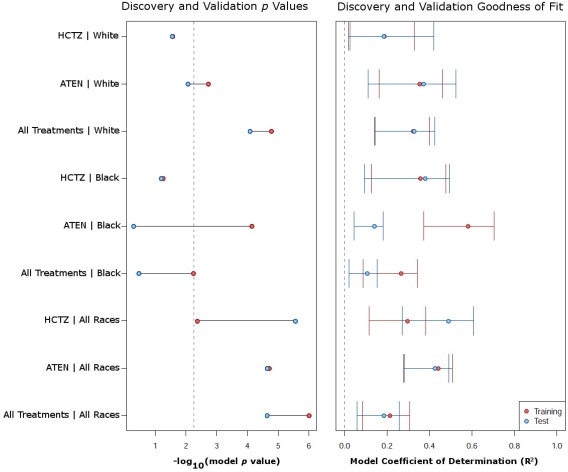
Multivariable modeling of change in HDBP using baseline metabolic signatures. (a) Shows for each model the p value obtained for the discovery (red) and validation (blue) sets. The vertical dashed line represents the Bonferroni corrected P value required for the model results to be considered statistically significant. The x‐axis is the –log10 (P value) so that points to the right represent increasing significance. (b) The R2 of each model separated by discovery (red) and validation (blue) sets. The error bars represent the bootstrapped 95% confidence interval.
Additional multivariable models were constructed using changing metabolites and are described in the supplementary material (Supplemental Figures S4–S6).
Pathway analysis
Pathways enriched by metabolite signature of drug exposure
Pathway analysis detected 11 significant pathways for both ATEN and HCTZ (adjusted P < 0.05). In subjects treated with ATEN, pathway analysis detected significant decreases of the α‐linolenic acid and linoleic acid metabolism pathway (adjusted P = 1.09 × 10⁻⁸ for all races and 7.57 × 10⁻⁵ for whites; Table 4). In addition, the fatty acid biosynthesis (adjusted P = 0.0055) and glycerolipid metabolism (adjusted P = 0.0005) pathways were significantly decreased when both races were combined, and when only the white group was tested (i.e., adjusted P = 0.0093 and P = 0.0023, respectively).
Table 4.
Results from correlated Lancaster pathway analysis signature of exposure
| Number of metabolites in: | ||||||||||
|---|---|---|---|---|---|---|---|---|---|---|
| Pathway name | SMPDB IDa | KEGG IDb | Drug | Race | Direction of change | Pathwayc | Groupd | Overlappinge | Names of overlapping metabolites | P valuef |
| Purine metabolism | SMP00050 | map00230 | HCTZ | All | Increase | 45 | 128 | 4 | Uric acid, hypoxanthine, adenosine‐5‐phosphate, adenosine | <1 × 10⁻⁹ |
| Alpha linolenic acid and linoleic acid metabolism | SMP00018 | map00592 | ATEN | All | Decrease | 17 | 98 | 2 | Linoleic acid, arachidonic acid | 1.09 × 10−08 |
| Purine metabolism | SMP00050 | map00230 | HCTZ | White | Increase | 45 | 139 | 4 | Uric acid, hypoxanthine, adenosine‐5‐phosphate, adenosine | 2.24 × 10−08 |
| Alpha linolenic acid and linoleic acid metabolism | SMP00018 | map00592 | ATEN | White | Decrease | 17 | 88 | 2 | Linoleic acid, arachidonic acid | 7.57 × 10−07 |
| Purine metabolism | SMP00050 | map00230 | HCTZ | Black | Increase | 45 | 72 | 3 | Uric acid, hypoxanthine, adenosine monophosphate | 5.12 × 10−05 |
| Galactose metabolism | SMP00043 | map00052 | HCTZ | All | Increase | 25 | 128 | 8 | Glucose, glycerol, myo‐inositol, fructose, sorbitol, glucose 1‐phosphate, sucrose, maltotriose | 0.0003 |
| Gluconeogenesis | SMP00128 | map00010 | HCTZ | All | Increase | 27 | 128 | 6 | Glucose, lactic acid, pyruvic acid, glucose 1‐phosphate, alpha ketoglutaric acid, 3‐phosphoglycerate | 0.0004 |
| Glycerolipid metabolism | SMP00039 | map00561 | ATEN | All | Decrease | 19 | 98 | 6 | Glycerol, palmitic acid, glyceric acid, glycerol‐3‐phosphate, 3‐phosphoglycerate, 2‐monopalmitin | 0.0005 |
| Glycolysis | SMP00040 | map00010 | HCTZ | All | Increase | 21 | 128 | 4 | Glucose, pyruvic acid, glucose 1‐phosphate, 3‐phosphoglycerate | 0.0009 |
| Glycolysis | SMP00040 | map00010 | HCTZ | White | Increase | 21 | 139 | 4 | Glucose, pyruvic acid, glucose 1‐phosphate, 3‐phosphoglycerate | 0.0013 |
| Gluconeogenesis | SMP00128 | map00010 | HCTZ | White | Increase | 27 | 139 | 6 | Glucose, lactic acid, pyruvic acid, glucose 1‐phosphate, alpha ketoglutaric acid, 3‐phosphoglycerate | 0.0023 |
| Glycerolipid metabolism | SMP00039 | map00561 | ATEN | White | Decrease | 19 | 88 | 3 | Palmitic acid, glyceric acid, glycerol‐3‐phosphate | 0.0025 |
| Fatty acid biosynthesis | SMP00456 | ATEN | All | Decrease | 32 | 98 | 5 | Palmitic acid, dodecanoic acid, capric acid, myristic acid, caprylic acid | 0.0055 | |
| Lactose synthesis | SMP00444 | HCTZ | All | Increase | 11 | 128 | 2 | Glucose, glucose 1‐phosphate | 0.0065 | |
| Fatty acid biosynthesis | SMP00456 | ATEN | White | Decrease | 32 | 88 | 2 | Palmitic acid, myristic acid | 0.0093 | |
| Plasmalogen synthesis | SMP00479 | HCTZ | White | Increase | 22 | 139 | 3 | Stearic acid, octadecanol, 1‐hexadecanol | 0.0101 | |
| Tryptophan metabolism | SMP00063 | map00380 | HCTZ | White | Increase | 34 | 139 | 3 | Tryptophan, indole‐3‐acetate, kynurenine | 0.0133 |
| Galactose metabolism | SMP00043 | map00052 | HCTZ | White | Increase | 25 | 139 | 8 | Glucose, glycerol, myo‐inositol, fructose, sorbitol, glucose 1‐phosphate, sucrose, maltotriose | 0.0146 |
| Lactose synthesis | SMP00444 | HCTZ | White | Increase | 11 | 139 | 2 | Glucose, glucose 1‐phosphate | 0.0258 | |
| Urea cycle | SMP00059 | map00330 | HCTZ | All | Increase | 20 | 128 | 8 | Alanine, urea, glutamic acid, citrulline, pyruvic acid, fumaric acid, alpha ketoglutaric acid, adenosine monophosphate | 0.0377 |
Small Molecule Pathway Database ID.
Kyoto Encyclopedia of Genes and Genomes ID.
Number of metabolites in pathway.
Number of metabolites studied.
Number of metabolites studied that also overlapped with metabolites in the pathway.
Bonferroni corrected P value.
Interestingly, all significant pathways in the HCTZ treatment group were due to increases in metabolite levels. The purine metabolism pathway was significantly increased for all races (adjusted P < 1 × 10⁻⁹), the white group (adjusted P = 2.24 × 10⁻⁸), and the black group (adjusted P = 5.12 × 10⁻⁵). This was the only pathway significantly affected when the data was stratified by only black subjects. For HCTZ exposure, other significantly increased pathways include galactose metabolism, lactose synthesis, gluconeogenesis, glycolysis, and the urea cycle when both races were combined (adjusted P < 0.05). When stratified by only white subjects, significant increases in lactose synthesis, plasmalogen synthesis, glycolysis, tryptophan metabolism, galactose metabolism, and gluconeogenesis were observed with adjusted P < 0.05 for each pathway.
DISCUSSION
The results of the metabolomics analysis in this study reveal important insights into interindividual and interpopulation differences in response to antihypertensives. HCTZ and ATEN have distinct mechanisms of action. HCTZ, a thiazide diuretic, lowers BP by inhibiting renal reabsorption. ATEN, on the other hand, is a beta‐blocker. The mechanism by which ATEN lowers BP has not been fully elucidated, although it is thought that the primary mechanism is through reduced cardiac output via a reduction in heart rate. The mechanistic differences in these drugs are reflected in the distinctive metabolite signatures detected here. Furthermore, the observed heterogeneity of response between white and black groups treated with either ATEN or HCTZ, based on HDBP (q < 0.05), stresses the need for an improved understanding of the mechanisms of action underlying these two medications (Figure 1).
Treatment with HCTZ resulted in a substantially different metabolic profile compared to treatment with ATEN (Table 1 and Supplementary Table S1). Uric acid was significantly increased upon treatment with HCTZ in both black and white groups consistent with the well‐documented side effect of hyperuricemia of thiazide‐based diuretics.23, 24 This metabolomic finding confirms the previous clinical findings of uric acid increase in this same cohort,25 but expand on the previous findings with a more comprehensive interrogation of the “metabolome.” The effect observed on uric acid may be indicative of the renal mechanism of action of HCTZ, which is not observed with ATEN treatment.
Several baseline or changing metabolites demonstrated significant positive or negative associations with HDBP response in participants treated with ATEN or HCTZ. Both baseline levels and the change of palmitoleic acid were positively associated with an HDBP response in participants treated with HCTZ, when all races were combined. Although the role of palmitoleic acid in BP is not well understood, several epidemiological studies have observed significant associations relating increases in palmitoleic acid with increased BP.26, 27 In white participants treated with ATEN, baseline 5‐methoxytryptamine displayed a negative association with HDBP response. In black participants treated with ATEN, change in indole‐3‐acetate was associated with HDBP response. The 5‐methoxytryptamine is a tryptamine derivative related to serotonin. Also, melatonin and indole‐3‐acetate are derived from tryptophan and are important components of the gut microbiome in humans.28, 29 These two metabolites suggest a possible impact of tryptophan or tryptamines (e.g., serotonin, melatonin) on antihypertensive response to multiple classes of antihypertensive drugs (e.g., beta‐blockers and thiazide diuretics), and a possible impact for the gut microbiome.30 Additional studies have identified metabolites associated with BP that point toward potential mechanisms in the gut microbiome.13 These results are further supported by the significant effect on the tryptophan metabolism pathway in white participants treated with HCTZ (adjusted P < 0.05; Table 4). Furthermore, several studies have demonstrated the ability for some tryptamines to impact BP and their role as either vasopressors or vasodepressors.31, 32, 33
Treatment with either ATEN or HCTZ resulted in several significantly altered pathways. Namely, effects on fatty acid biosynthesis and glycerolipid metabolism were observed in subjects treated with ATEN (Table 4). Effects on purine metabolism (driven mainly by effects on uric acid), galactose metabolism, lactose synthesis, plasmalogen synthesis, glycolysis, gluconeogenesis, and tryptophan metabolism were observed in subjects treated with HCTZ (adjusted P < 0.05; Table 4). Plasmalogens, a type of phospholipid, play an important role in cell signaling, membrane structure, and are protective against reactive oxygen species.34, 35 Increases in plasmalogens have been considered markers of increased oxidative stress and have been associated with increased cardiovascular mortality in participants with endstage renal disease.34 Several metabolites implicated in fatty acid biosynthesis, glycerolipid metabolism, and alpha linolenic acid and linoleic acid metabolism clustered after ATEN exposure (Supplementary Figure S1). Many unknown metabolites were highly clustered after HCTZ exposure (Figure 2). Annotating these unknown metabolites will be very important and may provide new insight into biological pathways impacted by HCTZ treatment.
For many years, studies have noted glucose impairment in some patients treated with thiazide‐based diuretics.36, 37 Although still under debate, recent studies have also demonstrated associations with thiazide‐based treatments and increased risk of type II diabetes and subsequently increased the risk of cardiovascular events.38, 39 Phosphoethanolamines are used in the construction of sphingolipids, and perturbations in sphingolipid metabolism have been implicated in adverse cardiovascular effects, have demonstrated the ability to alter insulin resistance, and in turn may be connected to increased risk of type II diabetes.40, 41, 42 We detected a statistically significant decrease in circulating O‐phosphoethanolamine in the black group exposed to HCTZ (q < .05), which may be due to an increase in sphingolipid biosynthesis. Lipidomic profiling, with increased coverage of the sphingolipid metabolism pathway, will be required to further elucidate the impact of HCTZ treatment on this pathway.
Additionally, increases in metabolic sugars resulted in increases in galactose metabolism, lactose synthesis, glycolysis, and gluconeogenesis pathways (Table 4). This increase in metabolic sugars may also exacerbate risks of glucose impairment in patients treated with HCTZ. However, because of the nontargeted approach of this metabolite panel, many of these metabolites in our panel had only minimal overlap with any specific pathway. Therefore, a more targeted approach, with improved coverage of particular pathways, is needed to follow‐up these new hypotheses and gain a better understanding of how these biological pathways are related to treatment response.
Multivariable modeling offers the advantage of exploring combinations of factors that may provide predictive capability for patient drug response. Multivariable modeling in the current study highlighted a subset of baseline metabolic measurements that were predictive for ATEN (validation set: P = 2.27 × 10⁻⁵, R2 = 0.43) and HCTZ (validation set: P = 2.74 × 10⁻⁶, R2 = 0.49) induced HDBP response when both black and white groups were combined (Supplementary Figures S2–S3, Figure 3). The validation set was tested using the model constructed on the discovery data, in order to assess model overfitting, and models that were statistically significant in both the discovery and the validation set would be expected to have strong predictive performance. Models were not statistically significant when treatments and race were separated, presumably from the reduction in sample size and subsequent loss of statistical power. Race was a significant covariate that was retained in the model for ATEN during feature selection; however, gender was a significant covariate included in the model for HCTZ treatment. Together, these models demonstrate that a significant contribution of the change in HDBP by ATEN and HCTZ can be explained by metabolomics profiling. However, many of the metabolites included as features in the models are currently unidentified, underscoring the need to identify and characterize these metabolites. With extensive additional validation, these models could provide a cost‐effective, noninvasive, diagnostic capable of determining which treatment is the most likely to elicit a positive outcome for a patient.
In addition to being significantly associated with HDBP in white participants treated with ATEN, baseline methoxytryptamine was also selected as a variable in the multivariable model for ATEN for white participants and when both black and white participants were combined. Baseline levels of palmitoleic acid and oleic acid were both included as features for predicting HCTZ‐induced changes in HDBP. The coefficient for palmitoleic acid was positively associated with change in HDBP; whereas, the coefficient for oleic acid, albeit small, was negatively associated with change in HDBP, consistent with previous studies on the effects of these fatty acids on BP.26, 43
Through the use of metabolomics, we have identified sets of metabolites significantly altered by either treatment with HCTZ or ATEN and are associated with change in HDBP. In addition, we have demonstrated that racial differences in response to either drug exist and can be, at least partially, explained through metabolic profiles. Although additional work will be needed to determine the full impact of these medications on participants, these data offer new insights into the impact of hypertensive treatments on fatty acid and other metabolic pathways related to BP response.
Author Contributions
D.M.R., A.L.B., M.M., M.S., S.B.G., M.E.S., O.F., and R.C.D. wrote the manuscript. D.M.R., A.L.B., R.K.D., J.A.J., R.C.D., R.F.F., Y.G., and A.M.R. designed the research. D.M.R., A.L.B., R.C.D., M.S., R.F.F., L.W., H.Z., and Y.G. performed the research. D.M.R., M.M., S.B.G., M.S., L.W., and H.Z., analyzed the data. M.E.S. and O.F. contributed new reagents/analytical tools.
Conflict of Interest/Disclosure
The authors declared no conflict of interest.
Supporting information
Supporting Information
Supporting Information
Supporting Information
Supporting Information
Supporting Information
Supporting Information
Supporting Information
Supporting Information
Supporting Information
Supporting Information
Supporting Information
Supporting Information
Acknowledgments
This research was supported in part by funding from NIH R24 GM078233, “The Metabolomics Research Network” and RC2 5RC2GM092729 “Pharmacometabolomics Research Network,” both directed by R.K.D.; NIH U01 GM074492 as part of the NIH Pharmacogenomics Research Network, to J.A.J. and R.M.C.D.; NIH U24 DK097154 (O.F.); as well as by the Duke O'Brien Center for Kidney Research 1P30DK096493‐01 (S.B.G.).
References
- 1. Mozaffarian, D. et al Executive summary: heart disease and stroke statistics—2015 update. A report from the American Heart Association. Circulation 131, 434–441 (2015). [DOI] [PubMed] [Google Scholar]
- 2. Kearney, P.M. , Whelton, M. , Reynolds, K. , Muntner, P. , Whelton, P.K. & He, J. Global burden of hypertension: analysis of worldwide data. Lancet 365, 217–223 (2005). [DOI] [PubMed] [Google Scholar]
- 3. James, P.A. et al 2014 evidence‐based guideline for the management of high blood pressure in adults: report from the panel members appointed to the Eighth Joint National Committee (JNC 8). JAMA 311, 507–520 (2014). [DOI] [PubMed] [Google Scholar]
- 4. ALLHAT officers and coordinators for the ALLHAT Collaborative Research Group . The antihypertensive and lipid‐lowering treatment to prevent heart attack trial. Major outcomes in high‐risk hypertensive patients randomized to angiotensin‐converting enzyme inhibitor or calcium channel blocker vs diuretic: the Antihypertensive and Lipid‐Lowering Treatment to Prevent Heart Attack Trial (ALLHAT). JAMA 288, 2981–2997 (2002). [DOI] [PubMed] [Google Scholar]
- 5. Leenen, F.H. et al Clinical events in high‐risk hypertensive patients randomly assigned to calcium channel blocker versus angiotensin‐converting enzyme inhibitor in the antihypertensive and lipid‐lowering treatment to prevent heart attack trial. Hypertension 48, 374–384 (2006). [DOI] [PubMed] [Google Scholar]
- 6. National Clinical Guideline Centre (UK) . Hypertension: the clinical management of primary hypertension in adults: update of clinical guidelines 18 and 34 [Internet]. Royal College of Physicians, London, UK: (2011). [PubMed] [Google Scholar]
- 7. Wikoff, W.R. et al Pharmacometabolomics reveals racial differences in response to atenolol treatment. PLoS One 8, e57639 (2013). [DOI] [PMC free article] [PubMed] [Google Scholar]
- 8. Kaddurah‐Daouk, R. , Weinshilboum, R.M. & Pharmacometabolomics Research Network . Pharmacometabolomics: implications for clinical pharmacology and systems pharmacology. Clin. Pharmacol. Ther. 95, 154–167 (2014). [DOI] [PubMed] [Google Scholar]
- 9. Ji, Y. et al Glycine and a glycine dehydrogenase (GLDC) SNP as citalopram/escitalopram response biomarkers in depression: pharmacometabolomics‐informed pharmacogenomics. Clin. Pharmacol. Ther. 89, 97–104 (2011). [DOI] [PMC free article] [PubMed] [Google Scholar]
- 10. Kaddurah‐Daouk, R. et al Pharmacometabolomic mapping of early biochemical changes induced by sertraline and placebo. Transl. Psychiatry 3, e223 (2013). [DOI] [PMC free article] [PubMed] [Google Scholar]
- 11. Yerges‐Armstrong, L.M. et al Purine pathway implicated in mechanism of resistance to aspirin therapy: pharmacometabolomics‐informed pharmacogenomics. Clin. Pharmacol. Ther. 94, 525–532 (2013). [DOI] [PMC free article] [PubMed] [Google Scholar]
- 12. Lewis, J.P. , Yerges‐Armstrong, L.M. , Ellero‐Simatos, S. , Georgiades, A. , Kaddurah‐Daouk, R. & Hankemeier, T. Integration of pharmacometabolomic and pharmacogenomic approaches reveals novel insights into antiplatelet therapy. Clin. Pharmacol. Ther. 94, 570–573 (2013). [DOI] [PMC free article] [PubMed] [Google Scholar]
- 13. Holmes, E. et al Human metabolic phenotype diversity and its association with diet and blood pressure. Nature 453, 396–400 (2008). [DOI] [PMC free article] [PubMed] [Google Scholar]
- 14. Cooper‐Dehoff, R.M. et al Is diabetes mellitus‐linked amino acid signature associated with β‐blocker‐induced impaired fasting glucose? Circ. Cardiovasc. Genet. 7, 199–205 (2014). [DOI] [PMC free article] [PubMed] [Google Scholar]
- 15. Johnson, J.A. et al Pharmacogenomics of antihypertensive drugs: rationale and design of the pharmacogenomic evaluation of antihypertensive responses (PEAR) study. Am. Heart J. 157, 442–449 (2009). [DOI] [PMC free article] [PubMed] [Google Scholar]
- 16. Scholz, M. & Fiehn, O. SetupX–a public study design database for metabolomic projects. Pac. Symp. Biocomput. 169–180 (2007). [PubMed] [Google Scholar]
- 17. Fiehn, O. et al Quality control for plant metabolomics: reporting MSI‐compliant studies. Plant J. 53, 691–704 (2008). [DOI] [PubMed] [Google Scholar]
- 18. R Development Core Team . R: a language and environment for statistical computing. R Foundation for Statistical Computing, Vienna, Austria: <http://www.R-project.org/> (2013). [Google Scholar]
- 19. Benjamini, Y. & Hochberg, Y. Controlling the false discovery rate: a practical and powerful approach to multiple testing. J. R. Stat. Soc. Series. B Stat. Methodol. 289–300 (1995). [Google Scholar]
- 20. Stone, E.A. & Ayroles, J.F. Modulated modularity clustering as an exploratory tool for functional genomic inference. PLoS Genet. 5, e1000479 (2009). [DOI] [PMC free article] [PubMed] [Google Scholar]
- 21. Dai, H. , Leeder, J.S. & Cui, Y. A modified generalized Fisher method for combining probabilities from dependent tests. Front. Genet. 5, 32 (2014). [DOI] [PMC free article] [PubMed] [Google Scholar]
- 22. Wishart, D.S. et al HMDB 3.0–the human metabolome database in 2013. Nucleic Acids Res. 41(Database issue), D801–D807 (2013). [DOI] [PMC free article] [PubMed] [Google Scholar]
- 23. Fujimori, S. , Oka, Y. , Ogata, N. & Eto, K. Effects of losartan/hydrochlorothiazide on serum uric acid levels and blood pressure in hypertensive patients. Nucleosides Nucleotides Nucleic Acids 30, 1030–1034 (2011). [DOI] [PubMed] [Google Scholar]
- 24. Healey, L.A. , Magid, G.J. & Decker, J.L. Uric acid retention due to hydrochlorothiazide. N. Engl. J. Med. 261, 1358–1362 (1959). [DOI] [PubMed] [Google Scholar]
- 25. Vandell, A.G. et al Hydrochlorothiazide‐induced hyperuricaemia in the pharmacogenomic evaluation of antihypertensive responses study. J. Intern. Med. 276, 486–497 (2014). [DOI] [PMC free article] [PubMed] [Google Scholar]
- 26. Simon, J.A. , Fong, J. & Bernert, J.T. Jr. Serum fatty acids and blood pressure. Hypertension 27, 303–307 (1996). [DOI] [PubMed] [Google Scholar]
- 27. Cambien, F. et al An epidemiologic appraisal of the associations between the fatty acids esterifying serum cholesterol and some cardiovascular risk factors in middle‐aged men. Am. J. Epidemiol. 127, 75–86 (1988). [DOI] [PubMed] [Google Scholar]
- 28. Galzin, A.M. , Eon, M.T. , Esnaud, H. , Lee, C.R. , Pévet, P. & Langer, S.Z. Day‐night rhythm of 5‐methoxytryptamine biosynthesis in the pineal gland of the golden hamster (Mesocricetus auratus). J. Endocrinol. 118, 389–397 (1988). [DOI] [PubMed] [Google Scholar]
- 29. Russell, W.R. et al Major phenylpropanoid‐derived metabolites in the human gut can arise from microbial fermentation of protein. Mol. Nutr. Food Res. 57, 523–535 (2013). [DOI] [PubMed] [Google Scholar]
- 30. Zhu, H. et al Pharmacometabolomics of response to sertraline and to placebo in major depressive disorder – possible role for methoxyindole pathway. PLoS One 8, e68283 (2013). [DOI] [PMC free article] [PubMed] [Google Scholar]
- 31. Anwar, M.A. , Ford, W.R. , Broadley, K.J. & Herbert, A.A. Vasoconstrictor and vasodilator responses to tryptamine of rat‐isolated perfused mesentery: comparison with tyramine and β‐phenylethylamine. Br. J. Pharmacol. 165, 2191–2202 (2012). [DOI] [PMC free article] [PubMed] [Google Scholar]
- 32. Scheer, F.A. , Van Montfrans, G.A. , van Someren, E.J. , Mairuhu, G. & Buijs, R.M. Daily nighttime melatonin reduces blood pressure in male patients with essential hypertension. Hypertension 43, 192–197 (2004). [DOI] [PubMed] [Google Scholar]
- 33. Martin, W.R. & Sloan, J.W. Effects of infused tryptamine in man. Psychopharmacologia 18, 231–237 (1970). [DOI] [PubMed] [Google Scholar]
- 34. Stenvinkel, P. , Diczfalusy, U. , Lindholm, B. & Heimbürger, O. Phospholipid plasmalogen, a surrogate marker of oxidative stress, is associated with increased cardiovascular mortality in patients on renal replacement therapy. Nephrol. Dial. Transplant. 19, 972–976 (2004). [DOI] [PubMed] [Google Scholar]
- 35. Farooqui, A.A. & Horrocks, L.A. Plasmalogens: workhorse lipids of membranes in normal and injured neurons and glia. Neuroscientist 7, 232–245 (2001). [DOI] [PubMed] [Google Scholar]
- 36. Goldner, M.G. , Zarowitz, H. , & Akgun, S. Hyperglycemia and glycosuria due to thiazide derivatives administered in diabetes mellitus. N. Engl. J. Med. 262, 403–405 (1960). [DOI] [PubMed] [Google Scholar]
- 37. Zillich, A.J. , Garg, J. , Basu, S. , Bakris, G.L. & Carter, B.L. Thiazide diuretics, potassium, and the development of diabetes a quantitative review. Hypertension 48, 219–224 (2006). [DOI] [PubMed] [Google Scholar]
- 38. Verdecchia, P. , Angeli, F. , Reboldi, G.P. & Gattobigio, R. New‐onset diabetes in treated hypertensive patients. Curr. Hypertens. Rep. 7, 174–179 (2005). [DOI] [PubMed] [Google Scholar]
- 39. Eriksson, J.W. et al Hydrochlorothiazide, but not candesartan, aggravates insulin resistance and causes visceral and hepatic fat accumulation: the mechanisms for the diabetes preventing effect of candesartan (MEDICA) study. Hypertension 52, 1030–1037 (2008). [DOI] [PubMed] [Google Scholar]
- 40. Holland, W.L. & Summers, S.A. Sphingolipids, insulin resistance, and metabolic disease: new insights from in vivo manipulation of sphingolipid metabolism. Endocr. Rev. 29, 381–402 (2008). [DOI] [PMC free article] [PubMed] [Google Scholar]
- 41. Levade, T. , Augé, N. , Veldman, R.J. , Cuvillier, O. , Nègre‐Salvayre, A. & Salvayre, R. Sphingolipid mediators in cardiovascular cell biology and pathology. Circ. Res. 89, 957–968 (2001). [DOI] [PubMed] [Google Scholar]
- 42. Samad, F. , Hester, K.D. , Yang, G. , Hannun, Y.A. & Bielawski, J. Altered adipose and plasma sphingolipid metabolism in obesity a potential mechanism for cardiovascular and metabolic risk. Diabetes 55, 2579–2587 (2006). [DOI] [PubMed] [Google Scholar]
- 43. Terés, S. et al Oleic acid content is responsible for the reduction in blood pressure induced by olive oil. Proc. Natl. Acad. Sci. USA 105, 13811–13816 (2008). [DOI] [PMC free article] [PubMed] [Google Scholar]
Associated Data
This section collects any data citations, data availability statements, or supplementary materials included in this article.
Supplementary Materials
Supporting Information
Supporting Information
Supporting Information
Supporting Information
Supporting Information
Supporting Information
Supporting Information
Supporting Information
Supporting Information
Supporting Information
Supporting Information
Supporting Information