Abstract
In the field of sodium magnetic resonance imaging (MRI), inversion recovery (IR) is a convenient and popular method to select sodium in different environments. For the knee joint, IR has been used to suppress the signal from synovial fluids, which improves the correlation between the sodium signal and the concentration of glycosaminoglycans (GAGs) in cartilage tissues. For the better inversion of the magnetization vector under the spatial variations of the B0 and B1 fields, the IR sequence usually employ adiabatic pulses as the inversion pulse. On the other hand, it has been shown that RF shapes robust against the variations of the B0 and B1 fields can be generated by numerical optimization based on optimal control theory. In this work, we compare the performance of fluid-suppressed sodium MRI on the knee joint in vivo, between one implemented with an adiabatic pulse in the IR sequence and the other with the adiabatic pulse replaced by an optimal-control shaped pulse. While the optimal-control pulse reduces the RF power deposited to the body by 58%, the quality of fluid suppression and the signal level of sodium within cartilage are similar between two implementations.
Keywords: Sodium, Knee, MRI, Optimal control, Fermat looped, orthogonally encoded trajectories
Graphical Abstract
1. Introduction
In the human body, sodium is an important inorganic nutrient participating in the functioning of nerves and the maintenance of the osmotic balance between cells and surrounding body fluids [1]. The stable isotope 23Na of sodium, with 100% natural abundance, is a quadrupolar nucleus with a nuclear spin 3/2 and may manifest distinct NMR spectra, depending on its environments in tissues and organs [2]. With the advancement of 23Na NMR techniques separating different environments and 23Na MRI methodologies overcoming the low sensitivity due to its lower gyromagnetic ratio and the fast relaxation ascribed to its quadrupolar interactions, 23Na MRI has been successfully applied for assessing a number of diseases and therapies in vivo [3,4].
It has been shown that 23Na MRI can be useful for the diagnosis of diseases like osteoarthritis and degenerative disc diseases [5,6], in which cartilage tissue is irreversibly degraded. A decrease in the concentration of glycosaminoglycans (GAGs) in cartilage tissue generally indicates the onset of disorder, and the negative charge of GAGs attracts sodium cations into the extracellular matrix of cartilage tissue [7]. Therefore, the concentration of sodium in cartilage tissue is highly correlated with that of GAGs [8–10] so can be considered as a biomarker for the above-mentioned diseases.
Among several methods to generate a contrast between sodium in different tissue environments, fluid suppression through inversion recovery (IR) [11–13] has been one popular sequence for in vivo 23Na MRI [4]. It has been shown that the performance of the fluid-suppressed 23Na MRI on the knee joint can be improved by employing adiabatic pulses, such as the wide-band uniform rate and smooth truncation (WURST) pulse [14], as the inversion pulse of the IR sequence [13]. Adiabatic pulses help achieve more uniform fluid suppression under the spatial variations of the B0 and B1 fields. In practice, however, their performance is limited due to the finite pulse duration and the restriction on the specific absorption rate (SAR). For example, the inversion of spins may be uneven along the variation of the B0 field if the adiabatic pulse is implemented through the linear sweeping of frequency offsets and its duration is comparable to the relaxation times.
The performance of inversion under fast relaxation may be improved by employing a certain shaped RF pulse in place of adiabatic pulses. Optimal control theory [15,16] provides a convenient and flexible algorithm to find a shaped RF pulse for targeted performance [17–23], and its application to 23Na NMR and MRI has been successful [24–26]. Here, we present an optimal-control (OC) pulse for fluid-suppressed 23Na MRI on the knee joint in vivo and compare its performance with the WURST pulse numerically and experimentally. We will also discuss how the choice of a cost function and the range of the B1 field included for numerical optimization affect the performance of resulting OC pulses.
2. Methods
2.1. Numerical optimization
An OC pulse was searched in order to maximize a cost function
| (1) |
where ê3 is the unit vector along the z direction, tp is the duration of an OC pulse, and μ1,2(tp) are respectively the final states of the magnetization vectors of systems 1 and 2. The detailed OC algorithm used in this work is presented in Appendix A. Assuming that the spin-spin relaxation time (T2) is same as the spin-lattice relaxation time (T1), the relaxation times of the systems 1 and 2 were set to be 20 ms and 38 ms, respectively, which are close to the T1 relaxation times of 23Na in cartilage and blood in vivo at 7 T [27]. The pulse duration tp was 10 ms, and the maximum RF amplitude (ω1,max/2π) was set to be 250 Hz, which was implemented by adding a large value to the cost function when |ω1| > ω1,max. The numerical optimization was performed over the frequency offsets from −160 Hz to 160 Hz with a step size of 4 Hz and the scale of the RF amplitude or the RF scale factors from 0.6 to 1.2 with a step size of 0.05.
2.2. In vivo 23Na knee MRI
After approval from the Institutional Review Board of the New York University Langone Medical Center and signed informed consent, the right knee joints of five healthy volunteers (3 males (mean age = 38.3 ± 7.6 years) and 2 females (mean age = 31.0 ± 4.2 years); mean age = 35.6 ± 7.1 years) was scanned on a 7 T Siemens scanner with an in-house built double-tuned coil with eight 23Na channels and four 1H channels [28]. For each volunteer, three knee images were acquired by 23Na MRI, one without fluid suppression and the other two with fluid suppression, performed with the WURST and OC pulses.
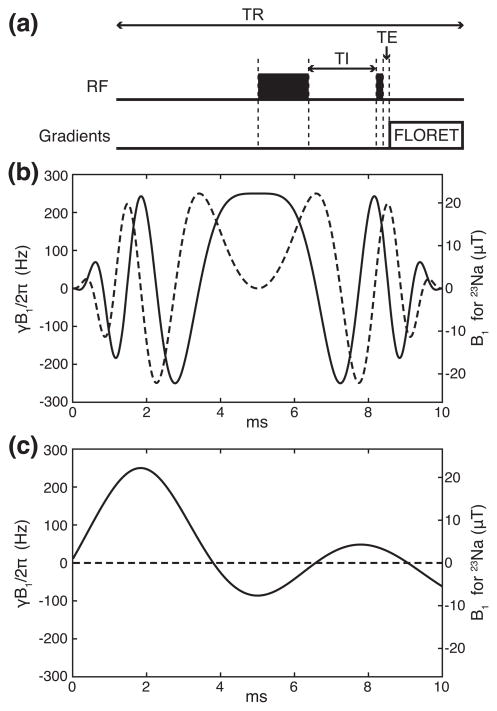
The knee images were acquired with Fermat looped, orthogonally encoded trajectories (FLORET [29]) consisting of 3 hubs at 45°, each of which comprises 332 interleaves. The parameters for the image acquisition were field of view (FOV) = (220 mm)3, echo time (TE) = 0.2 ms, repetition time (TR) = 140 ms, Nyquist resolution = 3.4 mm, the acquisition time = 6.6 ms, 6 averages, the duration of the excitation pulse = 0.6 ms, and the total acquisition time = ~14 mins. With fluid suppression, an inversion pulse and a recovery delay (TI) preceded the excitation pulse. In this work, TI was defined as the time interval from the end of the inversion pulse to the beginning of the excitation pulse. The TIs were 19 ms and 16 ms for the WURST and OC pulses, respectively. The schematic of the pulse sequence is shown in Fig. 1(a).
Figure 1.
RF waveforms used in this study. (a) The schematic of the fluid-suppressed 23Na MRI pulse sequence during a single TR, with the delays TI and TE indicated. The wide and thin black boxes represent the inversion and excitation pulses, respectively. The signal is acquired in sync with the FLORET sequence. Note that the length along the abscissa is not proportional to real time. (b) WURST, an adiabatic inversion pulse. (c) An OC pulse maximizing the difference in the z component of the magnetization vector between spins with T1 = 20 ms and 38 ms. The solid and dashed lines represent the x and y components of RF waveforms, respectively. The gyromagnetic ratio of 23Na is 11.262 MHz/T.
The spatial variation of the B1 field in the knee joint was estimated by the double angle method [30]. An additional image was acquired with the excitation pulse at the flip angle of π/4, and the signal intensities were compared with those acquired with the excitation pulse at the flip angle of π/2. So the flip angle was estimated by cos−1[Iπ/4/(2Iπ/2)] in radians, where Iθ indicates the signal intensity measured with the excitation pulse at the flip angle θ. Since θ = γB1tp, we defined cos−1[Iπ/4/(2Iπ/2)]/(π/4)as a B1 scale factor.
2.3. Data processing
Standard 3D regridding [31] was used to reconstruct the images with the nominal resolution of 2 mm. For each volunteer, six regions of interest (ROIs) were defined on artery, patella cartilage, lateral and medial femorotibial cartilage, and lateral and medial femoral condyle cartilage.
After normalized to the signal intensities measured without fluid suppression, paired samples t-tests were performed on the signal intensities from the fluid-suppressed 23Na knee images obtained with the WURST and OC pulses.
3. Results and discussion
3.1. Simulated performance of an OC pulse
The RF waveforms of the WURST and OC pulses used in this work are presented in Figs. 1(b) and 1(c). The RF amplitude and phase of the WURST pulse are respectively described as
| (2) |
and
| (3) |
with tp = 10 ms, 0 ≤ t ≤ tp, ω1/2π = 250 Hz, β(t) = (π/2) (2t−tp)/tp, and fmax = 1 kHz. The phase change for 0≤ t ≤ tp produces a linear frequency sweep ranging from −fmax to +fmax. The y component of the OC pulse was zero by design. The root-mean-square (r.m.s.) RF amplitudes of the WURST and OC pulses are respectively 19.5 μT and 9.9 μT, so the OC pulse requires only 25.8% of the RF power carried by the WURST pulse.
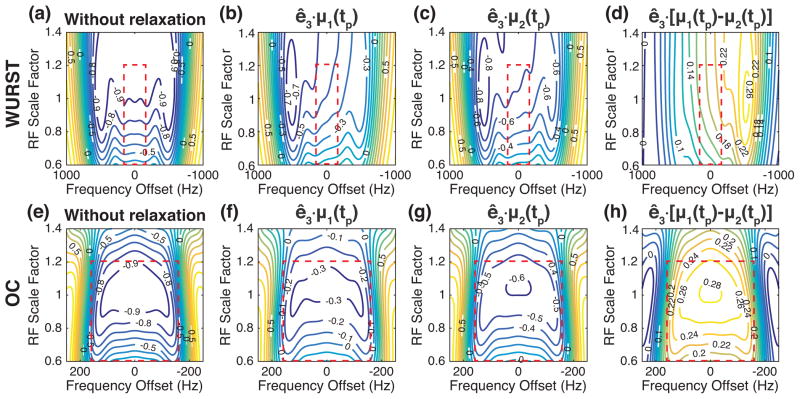
The z components of the magnetization vectors at the end of the WURST and OC pulses, i.e., ê3 − μk(tp) where k = 1 and 2, were obtained by numerically solving the Bloch equations with the initial thermal equilibrium state, i.e. μk(0) = ê3, and are presented in Fig. 2 as contour plots against the frequency offsets and the RF scale factors. As shown in Figs. 2(b) and 2(c), the relatively long duration of the WURST pulse may cause the uneven inversion of the spins along the frequency offsets because the spins inverted at the earlier moments have more time to relax toward the thermal equilibrium state than those inverted at the later moments. The performance of the WURST pulse degrades as the RF amplitude decreases, probably because the adiabatic condition is not satisfied at such low RF amplitudes [13].
Figure 2.
The z components of the magnetization vectors as a function of the frequency offset and the RF scale factor, at the end of the WURST and OC pulses applied to the thermal equilibrium state. (a–c) The contour plots of the z components after applying the WURST pulse for the system without relaxation (a) and with T1 = T2 = 20 ms (b) and 38 ms (c). (d) The difference between the contour plots shown in (b) and (c). (e–g) The contour plots of the z components after applying the OC pulse for the system without relaxation (e) and with T1 = T2 = 20 ms (f) and 38 ms (g). (h) The difference between the contour plots shown in (f) and (g). The red box indicates the range of the frequency offsets and RF scale factors included in the numerical optimization.
As for the OC pulse, its performance along the frequency offsets is symmetric with respect to the zero frequency offset, as shown in Figs. 2(f) and 2(g). The OC pulse manifests certain robustness against the B1 variation if the RF scale factor is between 0.8 and 1.2, although the performance degrades when the RF amplitude is reduced by more than 20%.
While the OC pulse inverts the spins of the individual systems less efficiently than the WURST pulse, it may separate the two systems from each other more effectively, as seen in Figs. 2(d) and 2(h) where the difference between ê3 · μ1(tp) and ê3 · μ2(tp) are presented. In addition, the level of the difference seems more uniform against the frequency offsets and the RF scale factors. Notice that the OC pulse resulted from maximizing the difference between ê3 · μ1(tp) and ê3 · μ2(tp) under the variation of the B0 and B1 fields.
3.2. In vivo 23Na knee MRI
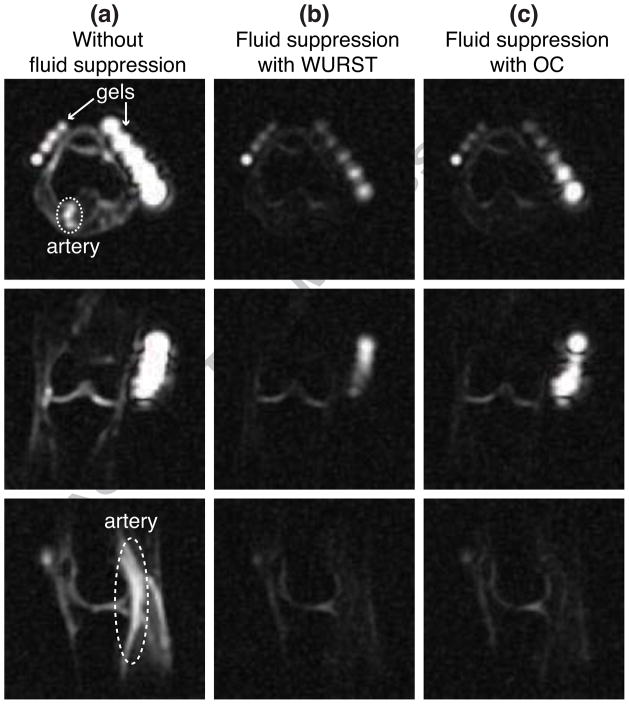
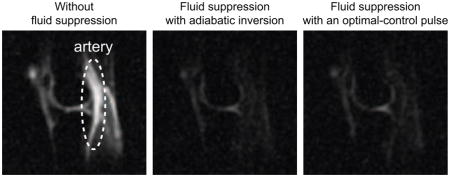
As an example, representative slices from 23Na 3D images of the right knee of a healthy volunteer are presented in Fig. 3. Without fluid suppression, the 23Na image clearly displays the artery, as indicated in Fig. 3(a). With fluid suppression, TI’s were chosen to suppress the artery, as seen in Figs. 3(b) and 3(c). While the value of TI for the WURST pulse was taken from the previous work [13, 32, 33], the TI for the OC pulse was chosen based on the inversion profile shown in Fig. 2(f) and the corresponding relaxation time (= 38 ms).
Figure 3.
Slices from 23Na images of the right knee of a healthy volunteer. (a) Slices from the 23Na image obtained without fluid suppression. The artery and gel phantoms are indicated. (b) Slices from fluid-suppressed 23Na MRI performed with the WURST pulse and TI = 19 ms. (c) Slices from fluid-suppressed 23Na MRI performed with the OC pulse and TI = 16 ms.
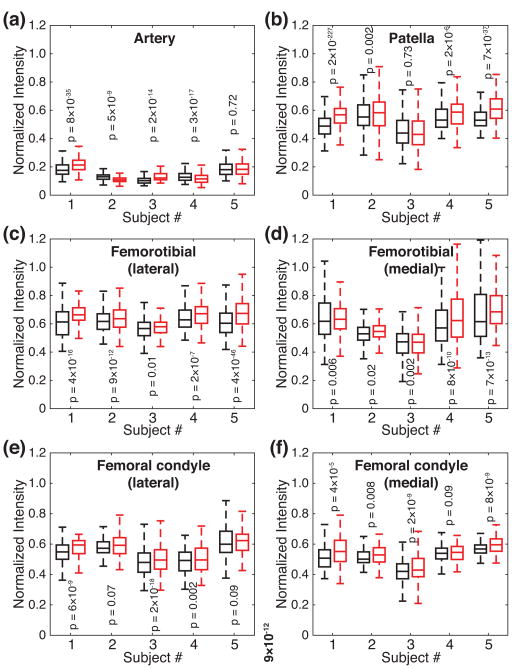
In order to compare the performances of the two fluid-suppressed 23Na MRI’s, the box plots of the signal intensities, after normalized to ones acquired without fluid suppression, are presented in Fig. 4 for individual ROIs and subjects. As for the suppression of arteries, the signal intensities from the arteries acquired with the OC pulse were lower for two subjects or higher for two subjects than those acquired with the WURST pulse. For one remaining case, the difference between the signal intensities from the two fluid-suppressed 23Na MRI’s was not statistically significant (Subject #5 in Fig. 4(a)). In terms of fluid suppression, therefore, the performances of the two sequences may be considered similar.
Figure 4.
Box plots of the signal intensities from the fluid-suppressed 23Na MRI’s performed with the WURST (black boxes) and OC (red boxes) pulses, after normalized to the signal intensities from 23Na MRI performed without fluid suppression. (a) Artery. (b) Patellar cartilage. (c) Femorotibial cartilage, lateral. (d) Femorotibial cartilage, medial. (e) Cartilage on femoral condyle, lateral. (f) Cartilage on femoral condyle, medial. For each pair of the distributions, the p value from paired samples t-test is displayed.
This fluctuation in fluid suppression seems related to the variation of the RF scale factor. The standard deviations of the B1 scale factors for the individual subjects, as shown in Table 1, were estimated smaller in the arteries when the fluid suppression was better with the OC pulse, and vice versa. As shown in Figs. 2(c) and 2(g), the performance of the OC pulse is more sensitive than the WURST pulse, to the variation of the RF scale factor when it is between 0.6 and 0.8. Since the mean values of the B1 scale factors in the arteries were above 0.8, as shown in Table 1, how low the B1 field was in the arteries, which is reflected in the standard deviations, probably resulted in the varying performances on the suppression of arteries between the OC and WURST pulses.
Table 1.
B1 scale factors estimated in the arteries.
| Subject # | Mean | Standard deviation | Better fluid suppression |
|---|---|---|---|
| 1 | 0.8325 | 0.1012 | WURST |
| 2 | 0.8181 | 0.0542 | OC |
| 3 | 0.8101 | 0.1552 | WURST |
| 4 | 0.8547 | 0.0891 | OC |
| 5 | 0.8877 | 0.1275 | same |
For cartilage tissues, the images acquired with the OC pulse produced higher signal intensities for the most cases. There were four instances in which the differences between the signal intensities from the two fluid-suppressed 23Na MRI’s were not statistically significant (lateral femoral condyle for Subjects #2 and #4, patella for Subject #3, and medial femoral condyle for Subject #4). As shown in Figs. 2(b) and 2(f), the z component of the magnetization vector for the system with T1 = 20 ms is less inverted with the OC pulse [ê3 · μ1(tp) = −0.42 ± 0.16 within the red box in Fig. 2(f)] than with the WURST pulse [ê3 · μ1(tp) = −0.56 ± 0.17 within the red box in Fig. 2(b)]. After TI’s, however, the z components of the magnetization vector may end up at the almost same value (0.465 ± 0.058 for the WURST pulse vs. 0.468 ± 0.061 for the OC pulse), because of the longer TI with the WURST pulse.
Note that 23Na in cartilage tissues may experience quadrupolar couplings and bi-exponential relaxation, which causes T2* to be much shorter than T1 [2–4]. While the inversion may not be as efficient as simulated for 23Na in cartilage tissues, it would not be important in terms of fluid suppression. In order to properly simulate the dynamics, on the other hand, the quantum master equations should be solved with the knowledge of quadrupolar coupling constants and quadrupolar relaxation times. It would not be so difficult to incorporate the quantum master equations into the OC algorithm [24–26], although the quarupolar couplings of 23Na in cartilage tissues in vivo are currently unavailable. Based on the relaxation times reported in Ref. [27], a numerical simulation including the bi-exponential relaxation of 23Na showed that the z component of the magnetization vector may reach a higher value with the WURST pulse (0.59 ± 0.03 for the WURST pulse vs. 0.58 ± 0.05 for the OC pulse). Note that these estimations took all the frequency offsets and rf scale factors equally, without considering their actual distributions in vivo.
While the performance of fluid-suppressed 23Na knee MRI would not change much when the OC pulse is used in place of the WURST pulse, with TI accordingly adjusted, the SAR may be reduced since the OC pulse requires less RF power than the WURST pulse (See Section 3.1). The SAR values displayed on the MRI scanner were 15% for the FLORET sequence without fluid suppression, and 78–80% and 33% for the fluid-suppressed MRI’s with the WURST and OC pulses, respectively. The reduction of the displayed SAR value by about 58% from the one with the WURST pulse to the other with the OC pulse is consistent with the difference between their numerical r.m.s. RF amplitudes presented in Section 3.1.
3.3. B1-field inhomogeneity
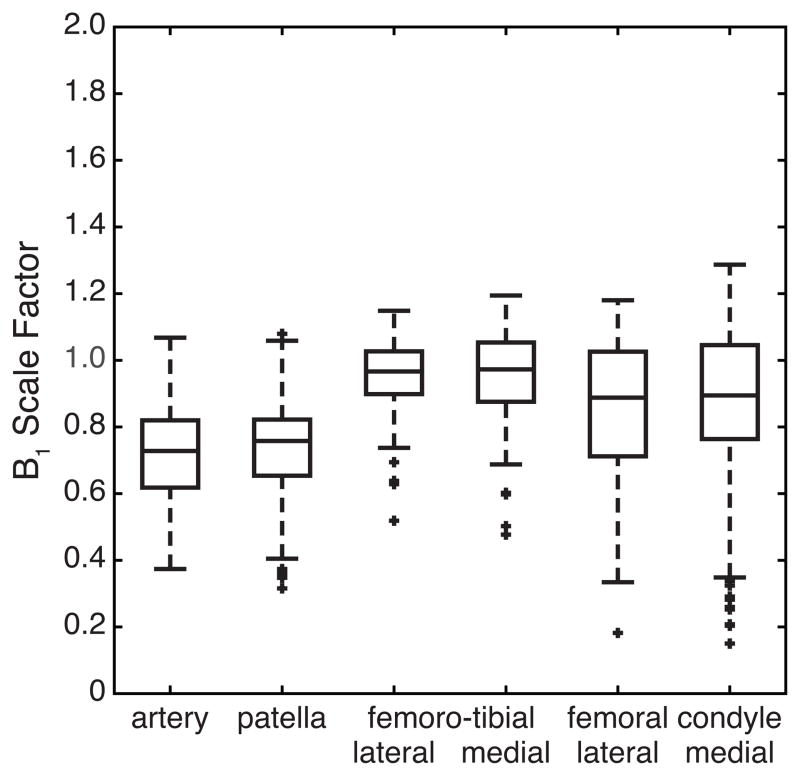
Since the gyromagnetic ratio of 23Na is only 26% of the proton’s, the spatial inhomogeneity of the B0 field may not be a major concern for the numerical optimization. The range of the frequency offsets used in the numerical optimization, which spans about 4 ppm for 23Na at 7 T, seemed enough to cover the spatial variation of the B0 field in the knee joint, although the resonance offsets inside some gel phantoms might be out of the range, as seen in Fig. 3(c). In order to determine the range of the RF scale factors, on the other hand, we measured a B1-field map and compared the performances of OC pulses optimized with the varying ranges of the RF scale factors.
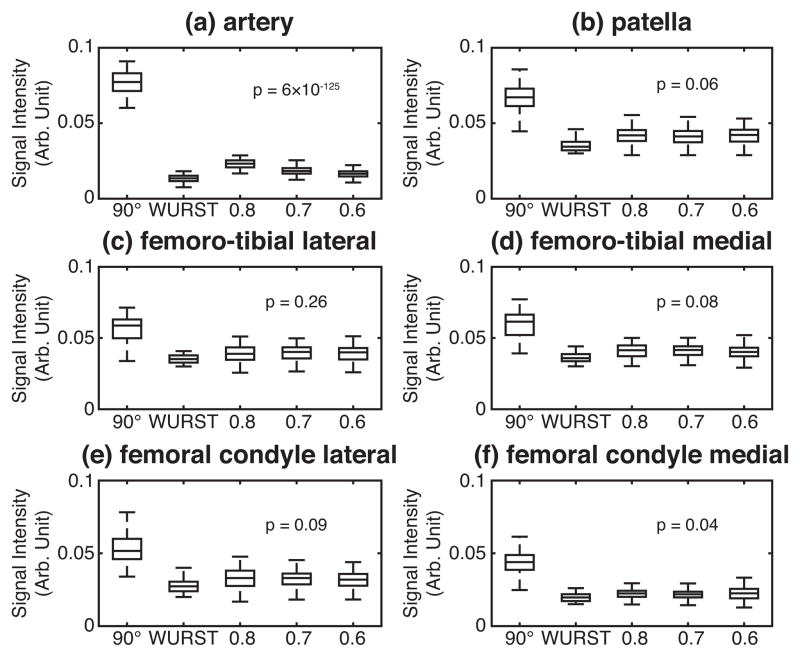
For one healthy volunteer, the box plots of the B1 scale factors in the individual ROIs defined on a 23Na knee image are presented in Fig. 5. On the same subject, we investigated the performances of three OC pulses, which were optimized under different ranges of the RF scale factors. While keeping the upper limit of the RF scale factor at 1.2, the lower limit was varied from 0.6 to 0.8. Box plots of the signal intensities acquired with these OC pulses are presented in Fig. 6 for the individual ROIs, along with those acquired with the WURST pulse and without fluid suppression.
Figure 5.
Box plots of the B1 scale factor for individual ROIs on a 23Na knee image from a healthy volunteer.
Figure 6.
Performances of three OC pulses optimized under different ranges of the RF scale factors. Box plots of the signal intensities are drawn for the individual ROIs: (a) artery, (b) patella cartilage, (c) lateral femoro-tibial cartilage, (d) medial femoro-tibial cartilage, (e) lateral femoral condyle cartilage, and (f) medial femoral condyle cartilage. The indices on the x axes indicate the MRI pulse sequences used: ‘90°’ for 23Na MRI without fluid suppression; ‘WURST’ for fluid-suppressed 23Na MRI performed with the WURST pulse; ‘0.8’, ‘0.7’, and ’0.6’ for fluid-suppressed 23Na MRI performed with the OC pulses optimized respectively for the RF scale factors from 0.8 to 1.2, from 0.7 to 1.2, and from 0.6 to 1.2. The p values from one-way ANOVA, performed on the distributions of the signal intensities acquired with the three OC pulses, are displayed.
Extending the range of the RF scale factors helped improve the suppression of the signal from artery, as seen in Fig. 6(a), while the signal intensities from cartilage tissues were kept similar between the three OC pulses, as shown in Figs. 6(b)–6(f). We have performed one-way analysis of variance (ANOVA) on the distributions of the signal intensities acquired with the three OC pulses and indicated the p values in Fig. 6, which support the above-mentioned observations.
3.4. Choice of a cost function
When IR is used to separate two systems with different relaxation times, TI is usually determined by the parameters of the system to be suppressed, which is given as
| (4) |
with T1, Mz(t = 0), and M0, respectively being the spin-lattice relaxation time, the z component of the magnetization vector after the inversion pulse, and the z component of the magnetization vector at the thermal equilibrium state, of the system to be suppressed. Indeed, our first cost function was
| (5) |
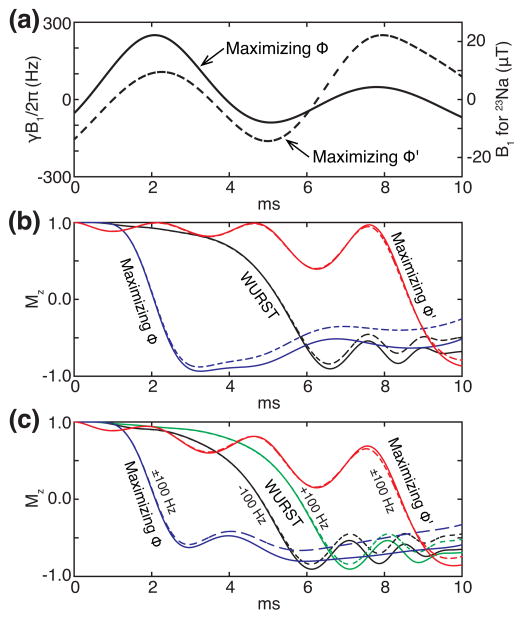
which takes into account only the system to be suppressed. Interestingly, the two cost functions ϕ and ϕ′ produced distinct RF waveforms. As an example, Fig. 7(a) displays the OC pulses maximizing ϕ and ϕ′, optimized over the frequency offsets from −160 Hz to 160 Hz with a step size of 4 Hz and the RF scale factors from 0.8 to 1.2 with a step size of 0.05. When they were tested in vivo, the shape maximizing ϕ resulted in better fluid suppression, which does not imply that ϕ would always be a better choice than ϕ′. Notice that we did not try ϕ′ for the larger ranges of the RF scale factors.
Figure 7.
Dependence of OC pulses and their performances on cost functions. (a) The x components of the OC pulses maximizing the cost functions ϕ (solid) and ϕ′ (dash). The y components are null. (b) The evolutions of the z components of the magnetization vectors on resonance while applying the WURST pulse (black lines) and the OC pulses maximizing the cost functions ϕ (blue lines) and ϕ′ (red lines). (c) The evolutions of the z components of the magnetization vectors at ±100 Hz while applying the WURST pulse (black and green lines) and the OC pulses maximizing the cost functions ϕ (blue lines) and ϕ′ (red lines). For the OC pulses, the trajectories for −100 Hz and +100 Hz coincide. The straight and dashed lines respectively represent the systems with the relaxation times 38 ms and 20 ms.
For these two OC pulses and the WURST pulse, the evolutions of the z components of the magnetization vectors for the systems with T1 = 20 ms and 38 ms were evaluated at the frequency offset of 0 Hz and ±100 Hz and the RF scale factor of 1.0, which are presented in Figs. 7(b) and 7(c). The WURST pulse is supposed to flip a spin when its frequency sweep crosses the resonance frequency of the spin. As seen in Figs. 7(b) and 7(c), the z components of the magnetization vectors display huge changes when the WURST pulse passes the corresponding frequency offsets, are almost inverted, and relax back toward the thermal equilibrium state in accordance with the corresponding relaxation times. For the OC pulse maximizing the cost function ϕ′, the evolutions of the magnetization vectors show that the inversions may happen at the end of the pulse [34], which might not give enough time for the two systems to be separated according to the relaxation times during the remaining pulse duration. In other words, the OC pulse maximizing the cost function ϕ′ seems more robust against the variation of the relaxation time than the WURST pulse, although the optimization was performed with a single relaxation time. By contrast, the OC pulse maximizing the cost function ϕ inverts the magnetization vectors at the beginning so that it allows more time for the relaxation. At the end of the pulse duration, it produces larger difference between the z components of the two magnetization vectors than the WURST pulse, as shown in Figs. 7(b) and 7(c).
Comparing with the conventional selective inversion pulses such as the minimum-phase Shinnar-Le Roux (SLR) inversion pulse [35] and spin-inversion band-selective, uniform response, pure-phase pulse (I-BURP) [36], the OC pulses are not so oscillatory and their RF amplitudes do not get weakened even while any noticeable inversion is happening. In this work, the OC pulses were not band-selective and their RF amplitudes were restricted by design, so the more or less uniform performance under the variations of the B0 and B1 fields could be achieved without excessive amplitude modulation.
4. Summary
Fluid-suppressed 23Na MRI on the knee joint in vivo has been implemented with an OC pulse in place of the inversion pulse in the IR sequence for fluid suppression. The scans on the knee joints of five healthy volunteers at 7 T demonstrated that two fluid-suppressed 23Na MRI’s performed with the OC and WURST pulses were similar regarding their performances of fluid suppression and contrast for cartilage tissues. One practically important benefit of using the OC pulse developed in this study is the reduction of the SAR, which may be exploited to improve the performance of the image acquisition in terms of the scan time and/or the signal-to-noise ratio.
The performance of fluid-suppressed 23Na MRI may be further improved if the excitation pulse is made more robust against the variations of the B0 and B1 fields, which can also be realized by designing an OC pulse for the signal excitation. In the end, a single OC pulse may implement the entire fluid-suppressed 23Na MRI, which would require better knowledge about the quadrupolar coupling constants and relaxation times of 23Na in the knee joint in vivo. In any case, we expect OC pulses to lighten some practical limitations of 23Na MRI and to contribute to extending its use as a diagnostic tool.
Highlights.
Optimal control theory was used to find a shaped pulse for fluid-suppressed 23Na MRI.
The performance of the shaped pulse was demonstrated through in vivo knee MRI.
The fluid suppression was as good as the conventional method.
Higher signal intensities were produced in cartilage tissues.
The RF power deposition to the body was reduced by 58%.
Acknowledgments
Research reported in this publication was supported in part by the National Institute of Arthritis and Musculoskeletal and Skin Diseases of the National Institutes of Health under Award Number NIH K25 AR060269, R01 AR060238, and R01 AR067156 and was performed under the rubric of the Center for Advanced Imaging Innovation and Research (CAI2R, www.cai2r.net), a NIBIB Biomedical Technology Resource Center (NIH P41 EB017183). The content is solely the responsibility of the authors and does not necessarily represent the official views of the National Institutes of Health.
Appendix
A. Optimal-control algorithm for RF pulse design
Here, we present the algorithm for finding RF shaped pulses based on optimal control theory [25,26]. First, we assume that the time evolution of a given system can be modeled by a set of first-order differential equations:
| (A1) |
where μ(t) and P(t) respectively represent the state of a system and the transition matrix at t. For a spin-1/2, the Bloch equations with the T1 and T2 relaxation terms can be easily converted to the homogeneous form like Eq. (A1) [37,38]. We also assume that the transition matrix P(t) can be expressed as P(t) = P0 + Σk Pk uk(t), where P0 is the time-independent part and each Pk corresponds to the control parameter uk(t).
For an RF shape consisting of N even time steps, there are 2N control parameters, N parameters for the x component of the RF amplitude ω1x and the other N for the y component ω1y. Defining Δt as tp/N, where tp is the duration of the RF shaped pulse, for (k − 1)Δt ≤ t < kΔt, and 0 otherwise. Therefore,
| (A2) |
for (k − 1)Δt ≤ t < kΔt, where Δω0 is the resonance offset, such that
| (A3) |
and
| (A4) |
Second, given a cost function Φ to be minimized, the corresponding objective function can be constructed with a help of a vector Lagrange multiplier λ as
| (A5) |
Here, we include the complex conjugate term in the integral to make J real because the components of μ and P are in general complex. It is straightforward to show that the variation of J can be made zero when
| (A6) |
| (A7) |
and
| (A8) |
While Eqs. (A6) and (A7) respectively provide a set of first-order differential equations governing the evolution of λ and the initial condition at tp. Eq. (A8) offers the conditions for stationary or ‘optimal’ trajectories followed by μ and λ. It would not be trivial to analytically solve Eqs. (A1), (A6), and (A8) simultaneously, so one usually relies on numerical iterative approaches in the form of the optimization of J. In such approaches, trajectories followed by μ and λ are evaluated by using Eqs. (A1) and (A6) under prescribed uk(t)’s to calculate λ†Pkμ+μ†Pkλ for each k, which can be seen as δJ/δuk and constitutes the gradient of J. So uk(t)’s may be updated to increase or decrease J and used to repeat the evaluation of new trajectories and gradient. The iteration may stop when the relative change in the value of J does not exceed a certain threshold (for example, 10−6). In this work, we used the conjugate gradient method according to the Polak-Ribière formula [39].
Footnotes
Publisher's Disclaimer: This is a PDF file of an unedited manuscript that has been accepted for publication. As a service to our customers we are providing this early version of the manuscript. The manuscript will undergo copyediting, typesetting, and review of the resulting proof before it is published in its final citable form. Please note that during the production process errors may be discovered which could affect the content, and all legal disclaimers that apply to the journal pertain.
References
- 1.Reece JB, Urry LA, Cain ML, Wasserman SA, Minorsky PV, Jackson RB. Campbell Biology. 9. Benjamin Cummings; San Francisco: 2011. [Google Scholar]
- 2.Rooney WD, Springer CS. A comprehensive approach to the analysis and interpretation of the resonances of spins 3/2 from living systems. NMR Biomed. 1991;4:209–226. doi: 10.1002/nbm.1940040502. [DOI] [PubMed] [Google Scholar]
- 3.Madelin G, Regatte RR. Biomedical applications of sodium MRI in vivo. J Magn Reson Imaging. 2013;38:511–29. doi: 10.1002/jmri.24168. [DOI] [PMC free article] [PubMed] [Google Scholar]
- 4.Madelin G, Lee JS, Regatte RR, Jerschow A. Sodium MRI: methods and applications. Prog Nucl Magn Reson Spectrosc. 2014;79:14–47. doi: 10.1016/j.pnmrs.2014.02.001. [DOI] [PMC free article] [PubMed] [Google Scholar]
- 5.Gold GE, Burstein D, Dardzinski B, Lang P, Boada F, Mosher T. MRI of articular cartilage in OA: novel pulse sequences and compositional/functional markers. Osteoarthr Cartil. 2006;14:A76–A86. doi: 10.1016/j.joca.2006.03.010. [DOI] [PubMed] [Google Scholar]
- 6.Insko EK, Clayton DB, Elliott MA. In Vivo Sodium MR Imaging of the Intervertebral Disk at 4 T. Acad Radiol. 2002;9:800–4. doi: 10.1016/s1076-6332(03)80350-1. [DOI] [PubMed] [Google Scholar]
- 7.Hu JCY, Athanasiou KA. Structure and Function of Articular Cartilage. In: An YH, Martin KL, editors. Handbook of Histology Methods for Bone and Cartilage. Humana Press; Totowa: 2003. pp. 73–95. [DOI] [Google Scholar]
- 8.Navon G, Shinar H, Eliav U, Seo Y. Multiquantum filters and order in tissues. NMR Biomed. 2001;14:112–32. doi: 10.1002/nbm.687. [DOI] [PubMed] [Google Scholar]
- 9.Rong P, Regatte RR, Jerschow A. Clean demarcation of cartilage tissue 23Na by inversion recovery. J Magn Reson. 2008;193:207–9. doi: 10.1016/j.jmr.2008.04.036. [DOI] [PMC free article] [PubMed] [Google Scholar]
- 10.Choy J, Ling W, Jerschow A. Selective detection of ordered sodium signals via the central transition. J Magn Reson. 2006;180:105–9. doi: 10.1016/j.jmr.2006.01.011. [DOI] [PubMed] [Google Scholar]
- 11.Kline RP, Wu EX, Petrylak DP, Szabolcs M, Alderson PO, Weisfeldt ML, Cannon P, Katz J. Rapid in vivo monitoring of chemotherapeutic response using weighted sodium magnetic resonance imaging. Clin Cancer Res. 2000;6:2146–56. [PubMed] [Google Scholar]
- 12.Stobbe R, Beaulieu C. In vivo sodium magnetic resonance imaging of the human brain using soft inversion recovery fluid attenuation. Magn Reson Med. 2005;54:1305–10. doi: 10.1002/mrm.20696. [DOI] [PubMed] [Google Scholar]
- 13.Madelin G, Lee JS, Inati S, Jerschow A, Regatte RR. Sodium inversion recovery MRI of the knee joint in vivo at 7T. J Magn Reson. 2010;207:42–52. doi: 10.1016/j.jmr.2010.08.003. [DOI] [PMC free article] [PubMed] [Google Scholar]
- 14.Kupce E, Freeman R. Adiabatic Pulses for Wideband Inversion and Broadband Decoupling. J Magn Reson A. 1995;115:273–6. doi: 10.1006/jmra.1995.1179. [DOI] [Google Scholar]
- 15.Kirk DE. Optimal Control Theory: An Introduction. Prentice-Hall, Inc; Englewood Cliffs: 1970. [Google Scholar]
- 16.Bertsekas DP. Dynamic Programming and Optimal Control. 3. Vol. 1. Athena Scientific; Nashua: 2005. [Google Scholar]
- 17.Conolly S, Nishimura D, Macovski A. Optimal control solutions to the magnetic resonance selective excitation problem. IEEE Trans Med Imaging. 1986;5:106–15. doi: 10.1109/TMI.1986.4307754. [DOI] [PubMed] [Google Scholar]
- 18.Rosenfeld D, Zur Y. Design of adiabatic selective pulses using optimal control theory. Magn Reson Med. 1996;36:401–9. doi: 10.1002/mrm.1910360311. [DOI] [PubMed] [Google Scholar]
- 19.Mao J, Mareci TH, Scott KN, Andrew ER. Selective inversion radiofrequency pulses by optimal control. J Magn Reson. 1986;70:310–8. doi: 10.1016/0022-2364(86)90016-8. [DOI] [Google Scholar]
- 20.Skinner TE, Reiss TO, Luy B, Khaneja N, Glaser SJ. Application of optimal control theory to the design of broadband excitation pulses for high-resolution NMR. J Magn Reson. 2003;163:8–15. doi: 10.1016/S1090-7807(03)00153-8. [DOI] [PubMed] [Google Scholar]
- 21.Khaneja N, Reiss T, Kehlet C, Schulte-Herbrüggen T, Glaser SJ. Optimal control of coupled spin dynamics: design of NMR pulse sequences by gradient ascent algorithms. J Magn Reson. 2005;172:296–305. doi: 10.1016/j.jmr.2004.11.004. [DOI] [PubMed] [Google Scholar]
- 22.Gershenzon NI, Kobzar K, Luy B, Glaser SJ, Skinner TE. Optimal control design of excitation pulses that accommodate relaxation. J Magn Reson. 2007;188:330–6. doi: 10.1016/j.jmr.2007.08.007. [DOI] [PubMed] [Google Scholar]
- 23.Lapert M, Zhang Y, Janich MA, Glaser SJ, Sugny D. Exploring the Physical Limits of Saturation Contrast in Magnetic Resonance Imaging. Sci Rep. 2012;2:589. doi: 10.1038/srep00589. [DOI] [Google Scholar]
- 24.Lee JS, Regatte RR, Jerschow A. Optimal nuclear magnetic resonance excitation schemes for the central transition of a spin 3/2 in the presence of residual quadrupolar coupling. J Chem Phys. 2008;129:224510. doi: 10.1063/1.3036005. [DOI] [PubMed] [Google Scholar]
- 25.Lee JS, Regatte RR, Jerschow A. Optimal excitation of 23Na nuclear spins in the presence of residual quadrupolar coupling and quadrupolar relaxation. J Chem Phys. 2009;131:174501. doi: 10.1063/1.3253970. [DOI] [PubMed] [Google Scholar]
- 26.Lee JS, Regatte RR, Jerschow A. Optimal control NMR differentiation between fast and slow sodium. Chem Phys Lett. 2010;494:331–6. doi: 10.1016/j.cplett.2010.06.019. [DOI] [Google Scholar]
- 27.Madelin G, Jerschow A, Regatte RR. Sodium relaxation times in the knee joint in vivo at 7T. NMR Biomed. 2011;25:530–7. doi: 10.1002/nbm.1768. [DOI] [PMC free article] [PubMed] [Google Scholar]
- 28.Brown R, Madelin G, Lattanzi R, Chang G, Regatte RR, Sodickson DK, Wiggins GC. Design of a nested eight-channel sodium and four-channel proton coil for 7T knee imaging. Magn Reson Med. 2013;70:259–68. doi: 10.1002/mrm.24432. [DOI] [PMC free article] [PubMed] [Google Scholar]
- 29.Pipe JG, Zwart NR, Aboussouan EA, Robison RK, Devaraj A, Johnson KO. A new design and rationale for 3D orthogonally oversampled k-space trajectories. Magn Reson Med. 2011;66:1303–11. doi: 10.1002/mrm.22918. [DOI] [PubMed] [Google Scholar]
- 30.Stollberger R, Wach P. Imaging of the active B1 field in vivo. Magn Reson Med. 1996;35:246–51. doi: 10.1002/mrm.1910350217. [DOI] [PubMed] [Google Scholar]
- 31.Pipe JG, Menon P. Sampling density compensation in MRI: Rationale and an iterative numerical solution. Magn Reson Med. 1999;41:179–86. doi: 10.1002/(SICI)1522-2594(199901)41:1<179::AID-MRM25>3.0.CO;2-V. [DOI] [PubMed] [Google Scholar]
- 32.Madelin G, Babb JS, Xia D, Chang G, Jerschow A, Regatte RR. Reproducibility and repeatability of quantitative sodium magnetic resonance imaging in vivo in articular cartilage at 3 T and 7 T. Magn Reson Med. 2012;68:841–9. doi: 10.1002/mrm.23307. [DOI] [PMC free article] [PubMed] [Google Scholar]
- 33.Madelin G, Babb J, Xia D, Chang G, Krasnokutsky S, Abramson SB, Jerschow A, Regatte RR. Articular cartilage: evaluation with fluid-suppressed 7.0-T sodium MR imaging in subjects with and subjects without osteoarthritis. Radiology. 2013;268:481–91. doi: 10.1148/radiol.13121511. [DOI] [PMC free article] [PubMed] [Google Scholar]
- 34.Gershenzon NI, Kobzar K, Luy B, Glaser SJ, Skinner TE. Optimal control design of excitation pulses that accommodate relaxation. J Magn Reson. 2007;188:330–6. doi: 10.1016/j.jmr.2007.08.007. [DOI] [PubMed] [Google Scholar]
- 35.Pauly J, Le Roux P, Nishimura D, Macovski A. Parameter relations for the Shinnar-Le Roux selective excitation pulse design algorithm. IEEE Trans Med Imaging. 1991;10:53–65. doi: 10.1109/42.75611. [DOI] [PubMed] [Google Scholar]
- 36.Geen H, Freeman R. Band-selective radiofrequency pulses. 1991;93:93–141. doi: 10.1016/0022-2364(91)90034-q. [DOI] [Google Scholar]
- 37.Levante TO, Ernst RR. Homogeneous Versus Inhomogeneous Quantum-Mechanical Master-Equations. Chem Phys Lett. 1995;241:73–8. doi: 10.1016/0009-2614(95)00578-R. [DOI] [Google Scholar]
- 38.Helgstrand M, Härd T, Allard P. Simulations of NMR pulse sequences during equilibrium and non-equilibrium chemical exchange. J Biomol NMR. 2000;18:49–63. doi: 10.1023/A:1008309220156. [DOI] [PubMed] [Google Scholar]
- 39.Press WH, Teukolsky SA, Vetterling WT, Flannery BP. Numerical Recipes in C. 2. Cambridge University Press; New York: 1992. [Google Scholar]


