Abstract
Complete case analysis is widely used for handling missing data, and it is the default method in many statistical packages. However, this method may introduce bias and some useful information will be omitted from analysis. Therefore, many imputation methods are developed to make gap end. The present article focuses on single imputation. Imputations with mean, median and mode are simple but, like complete case analysis, can introduce bias on mean and deviation. Furthermore, they ignore relationship with other variables. Regression imputation can preserve relationship between missing values and other variables. There are many sophisticated methods exist to handle missing values in longitudinal data. This article focuses primarily on how to implement R code to perform single imputation, while avoiding complex mathematical calculations.
Keywords: Big-data clinical trial, missing data, single imputation, longitudinal data, R

Zhongheng Zhang, MMed.
Introduction
Missing data are ubiquitous in big-data clinical trial. Although many studies do not explicitly report how they handle missing data (1,2), some implicit methods are used in statistical software. As a result, different packages may handle missing data in different ways (or the default methods are different) and results may not be replicated exactly by using different statistical software packages. Sometimes this may not lead significantly different results, but the scientific soundness of the study is compromised. The best practice is to explicitly state how missing values are handled. For simplicity, many investigators simply delete incomplete case (listwise deletion), which is also the default method in many regression packages (3). This method gets reliable results only when the number of missing values is not large and the missing pattern is missing completely at random (MCAR) or missing MAR. Another disadvantage of complete case analysis is information loss. This can be a big problem when there are a large number of variables (columns). A substantial number of cases can be deleted because deletion is based on missingness on one or more variables. Furthermore, complete case analysis can lead to unpredictable bias (3-5). The solution to this problem is imputation. Missing values are replaced by imputed values. Since imputation is an area of active research, there are numerous methods and packages developed for imputation. This article intends to introduce some basic imputation methods for missing data. Multiple imputations will be discussed in the following articles of the big-data clinical trial series.
Dataset simulation
A dataset of 150 observations is created by simulation. The dataset is used for illustration purpose and there is no clinical relevance. There are three variables including sex, mean arterial blood pressure (map) and lactate (lac). In each simulation, I set a seed to allow readers to replicate the results.
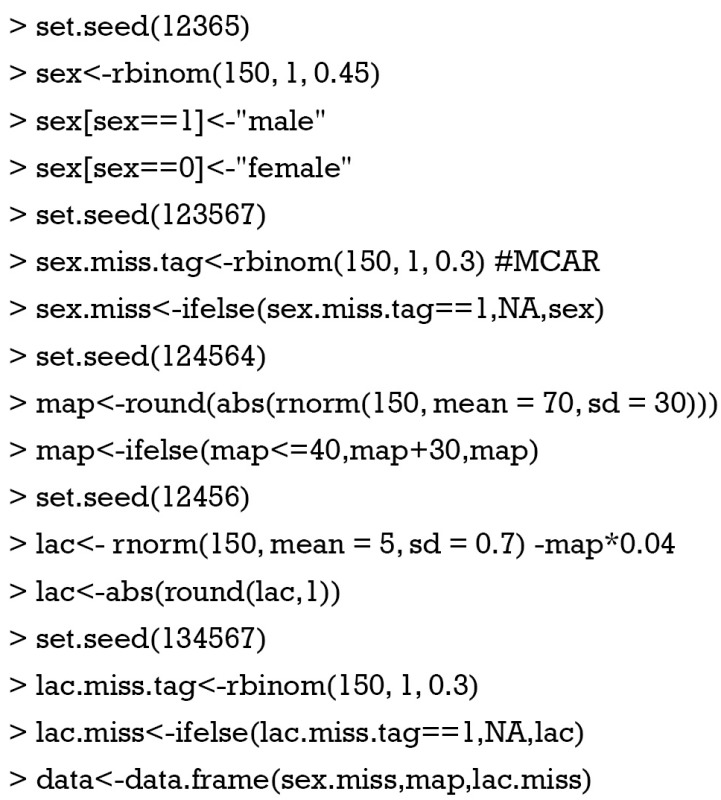
In the dataset, lac is created to have correlation with map. Serum lactate is a reflection of tissue perfusion, and the latter is dependent on mean arterial pressure. A negative correlation coefficient is assumed for map ~ lac relationship. In order to add noise, the intercept is generated by using random number generator [rnorm() function]. Sex is generated in an assumption of MCAR.

There are 47 missing values in the lac variable. The standard deviation is 1.11 and the mean is 2.051.
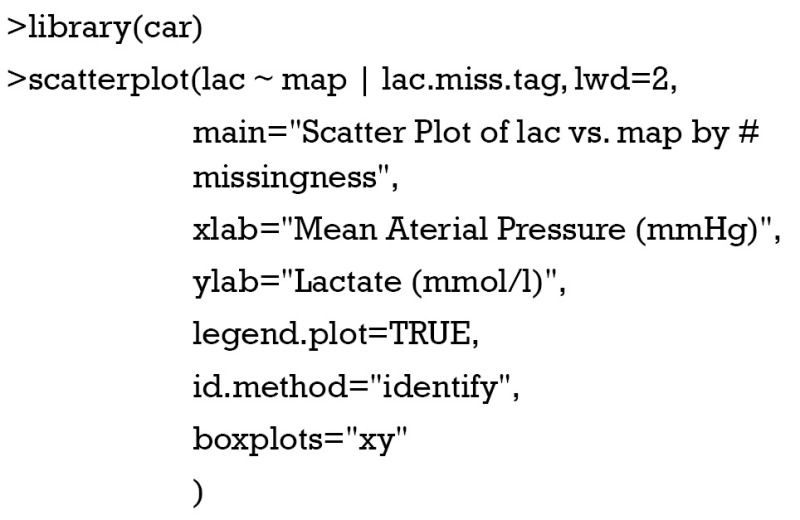
Figure 1 is the scatter plot of lac versus map and missing values on lac is denoted by red triangle. Black and red curves are fitted by nonparametric-regression smooth for nonmissing and missing values, respectively. It is noted that missing values on lac distribute evenly across lac range and is independent of the variable map. This is in consistent with the MCAR.
Figure 1.
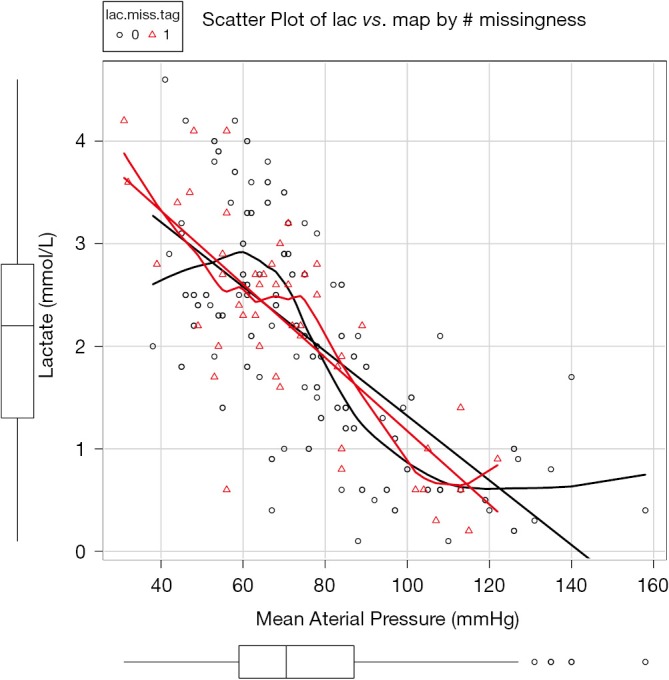
Scatter plot of lac vs. map and missing values on lac is denoted by red triangle.
Rough estimation of missing values with mean, mode or median
A quick approach to missing values is to replace them with mean, median or mode. The initialise() function shipped with VIM package can be used for this purpose. However, it is primarily used internally by some imputation algorithms and has no advantage over other basic methods in performing simple imputation. Suppose we want to impute missing values in data by mean for numeric variables and by mode for categorical variables.

Next, you can take a look at how the imputed values fill the lac ~ map scatter plot.
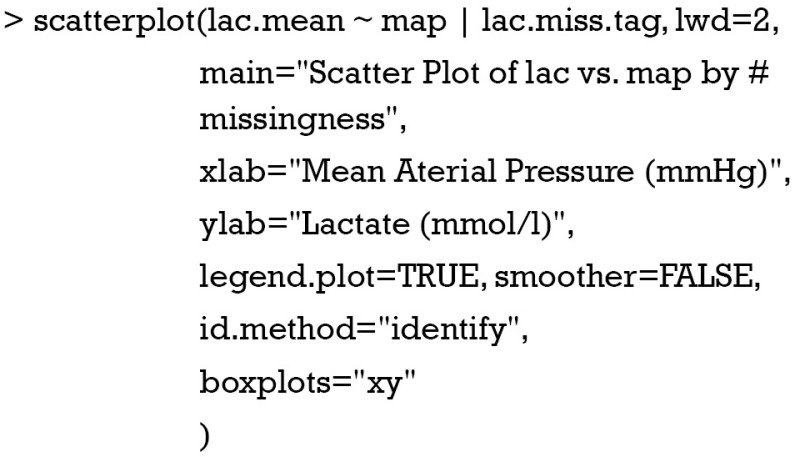
It is noted that all imputed values are at mean lac value of 2.1 mmol/L (Figure 2). The mean and standard deviation are biased. Imputations with mode and median work in the same manner and they are left to readers for practice. Although rough imputation provides fast and simple methods for missing values, it underestimates variance, compromises relationship between variables, and biases summary statistics. Thus rough imputations can only be used when a handful of values are missing, they are not for general use.
Figure 2.
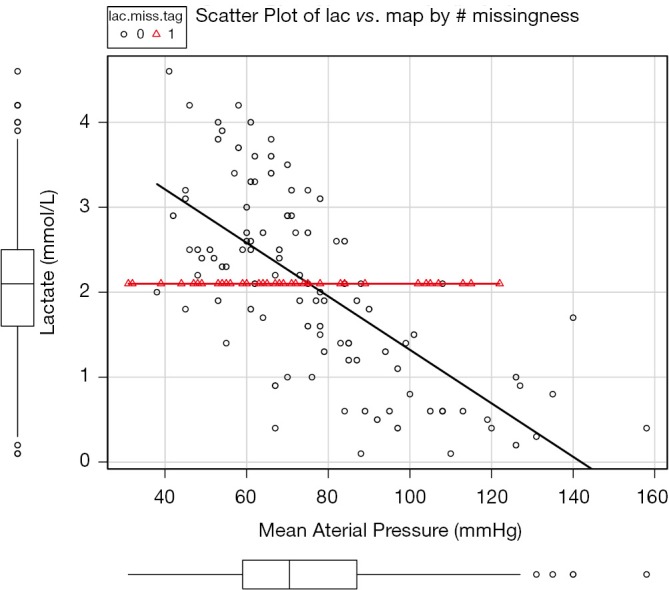
Scatter plot of lac vs. map with missing values on lac replaced by the mean value of observed lac.
Regression imputation
Imputation with regression on other one or more variables may produce smarter values. Firstly, investigators need to fit a regression model by setting the variable of interest as response variable and other relevant variable as covariates. The coefficients are estimated, and then missing values can be predicted by fitted model. Take the dataset for example, one can build a linear regression model between lac and map. Thereafter, missing values on lac can be predicted by the fitted model equation.
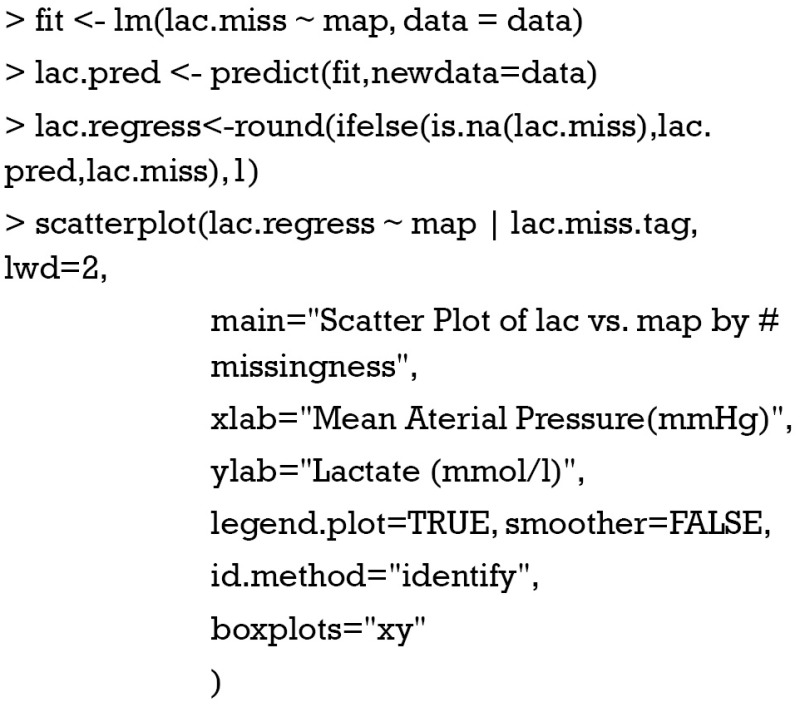
The estimated values are on the regression line without noise (Figure 3). This looks more rational than that estimated with mean. However, this method increases correlation coefficients between map and lac. The variability of imputed data is underestimated. Alternatively, you can add some noises to the regression by using mice() function (6).
Figure 3.
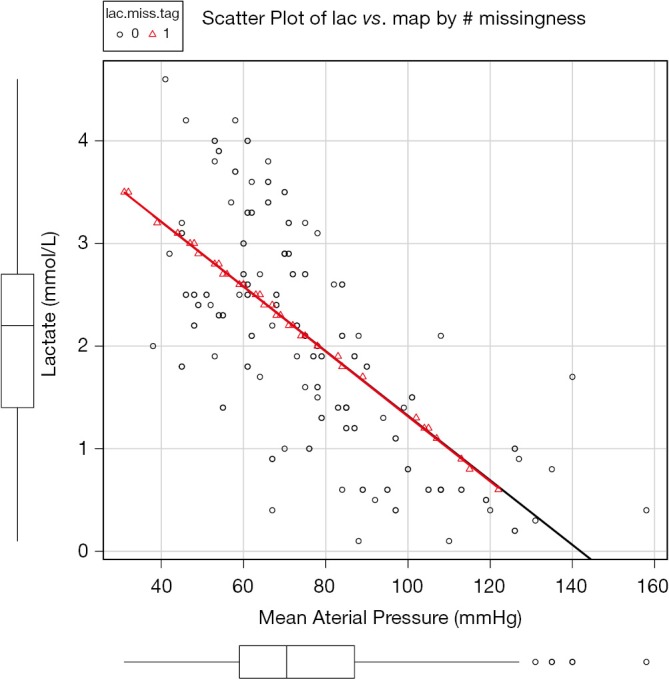
Scatter plot of lac vs. map with missing values on lac replaced by values predicted by fitted regression model.
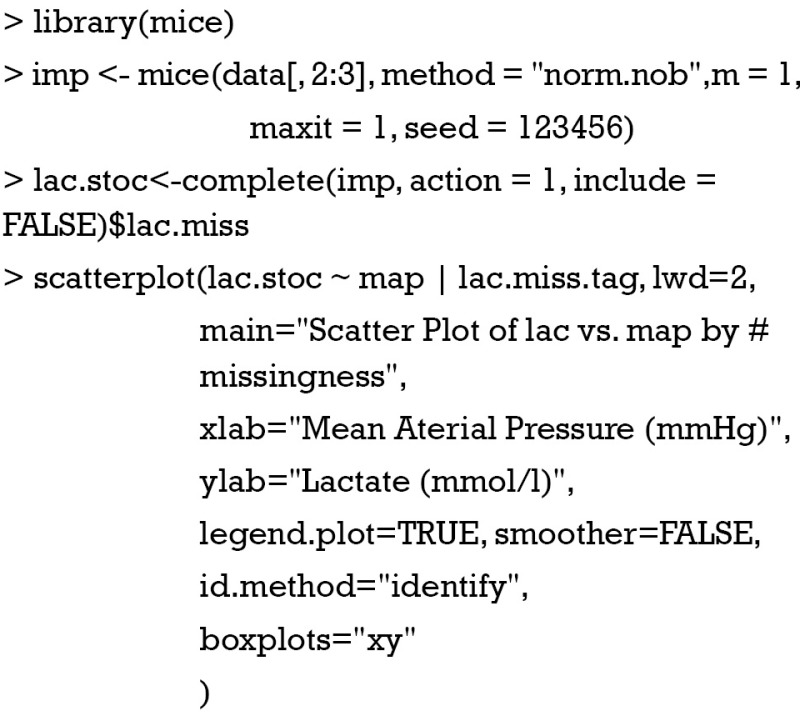
The core of the mice() function is the method=“norm.nob” argument which first estimates the slope, intercept and residual variance with linear regression, then predicts missing values with these specifications. The addition of residual variance opens up the distribution of imputed values (e.g., they are not in the regression line) (Figure 4). However, the limitation is that one imputed value falls below zero, which is practically impossible.
Figure 4.
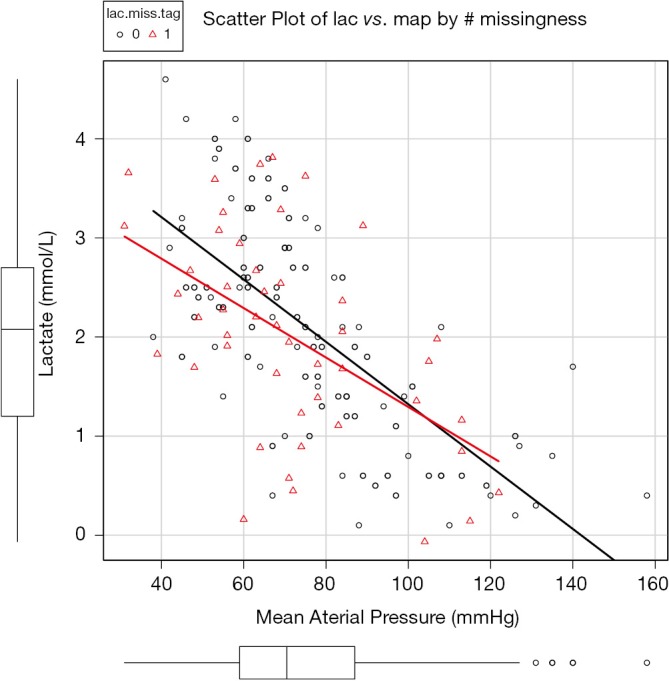
Missing values are predicted by linear regression. Note that residual variance is added to reflect uncertainty in estimation.
Indicator method
Indictor method is alternative to deal with missing values. This method replaces missing data by zero, and can be easily done by modifying the previous R code. I leave it to your practice. Indicator method has once been popular because it is simple and retains the full dataset. On the other hand, it allows for systematic difference between observed and unobserved data. However, indicator method is criticized that it can bring unpredictable bias into regression model, even with small percentage of missing values (4). Some authors have argued against its use in general practice (7).
Imputation of longitudinal data
The function imputation() shipped with longitudinal Data package provide powerful algorithm for imputation of longitudinal data (8). Longitudinal data is characterized by correlation between repeated measurements of a certain variable. Thus, missing values imputed depending on neighboring values are more reliable than methods mentioned above. For example, for a given patients, his or her serum lactate levels are correlated in consecutive measurements.
Suppose we have four patients and serum lactate levels are measured on daily basis. However, there are many missing values. R code for creating the dataset is shown below.
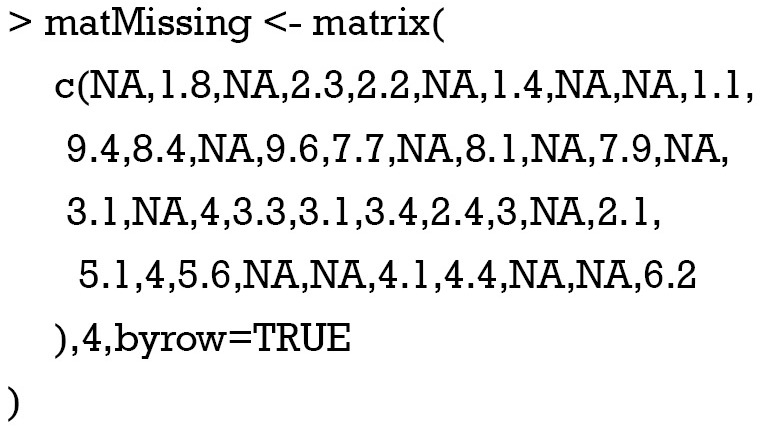
The first step in analyzing such dataset is to estimate the missing values. Since they are longitudinal data, it is reasonable that missing values are correlated to their immediate observed values. However, there are many methods for the imputation. Longitudinal imputation uses non-missing data of the same subject to estimate missing values. The imputation is independent of other individual subjects or cases. There are also varieties of methods for longitudinal imputation (Table 1) (9-11). In the present article, I want to illustrate several simple methods for imputation of longitudinal data. Readers interested in more complex methods are referred to the reference (9).
Table 1. Imputation methods for longitudinal data.
| Imputation methods | Brief description |
|---|---|
| Cross sectional imputation | |
| Cross mean | Replace missing value with mean of values observed at that time |
| Cross median | Replace missing value with median of values observed at that time |
| Cross hot deck | Replace missing value with a randomly chosen value among values observed at that time |
| Longitudinal imputation | |
| Traj mean | Replace missing value by average values of that subject (trajectory) |
| Traj median | Replace missing value by median value of that subject (trajectory) |
| Traj hot deck | Replace missing value by a value chosen randomly from that subject (trajectory) |
| LOCF | Replace missing value by previous non-missing value of that subject (trajectory) |
| Linear interpolation | Values immediately surrounding the missing are join by a line |
| Spline interpolation | Values immediately surrounding the missing are joined by a cubic spline |
| Cross and longitudinal imputation | |
| Copy mean | Combine linear interpolation and imputation using population’s mean trajectory |
| Linear regression | Predict missing value by constructing a model |
LOCF, last occurrence carried forward.
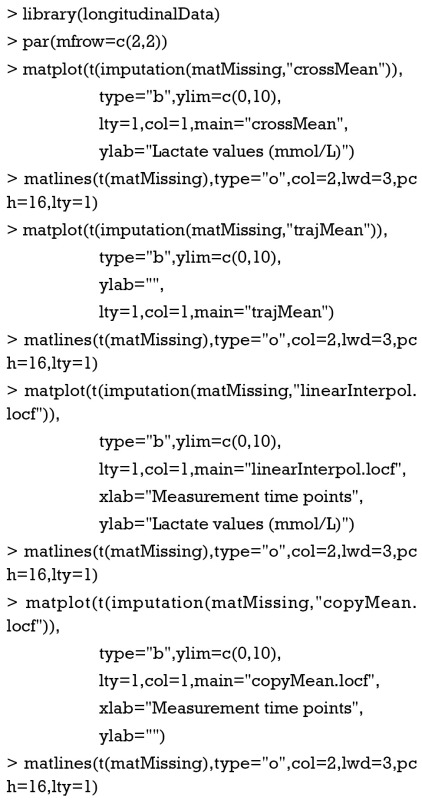
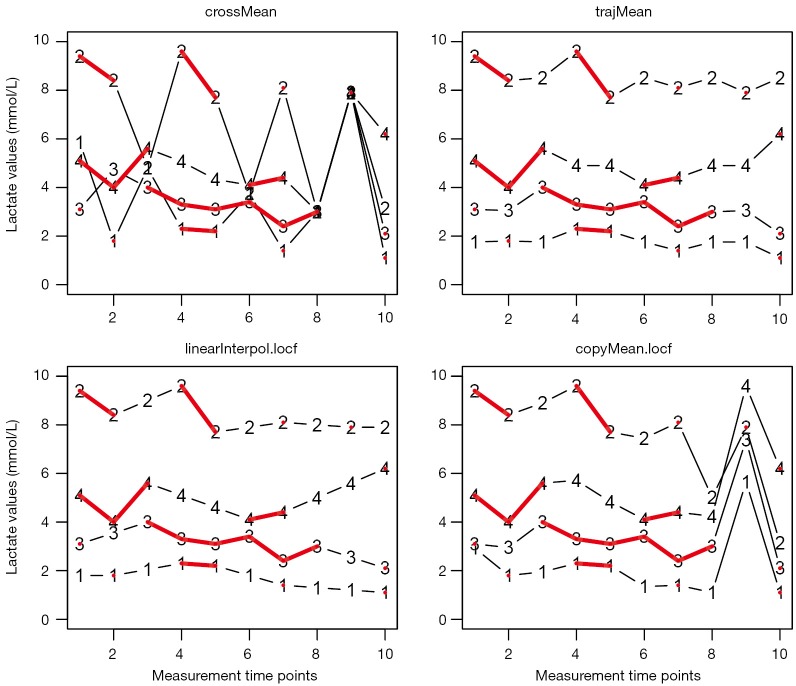
The par() function is powerful in setting R graphical parameters. The mfrow=c(2,2) argument specifies that subsequent figures will be drawn in a two-by-two array on the device by row. In order to illustrate how each imputation method works, I plot observed and imputed lactate measurements on graphics by using matplot() function. Imputation methods are carried out by the imputation() function. The first argument specifies the matrix of trajectory to impute. The second argument specifies the name of the imputation method. In the example I used “crossMean”, “trajMean”, “linearInterpol.locf” and “copyMean.locf”. Different methods resulted in different imputed values (Figure 5). To distinguish observed values from those which are imputed, the matlines() function was used to highlight observed values with red points and lines.
Figure 5.
Longitudinal imputations with different methods.
Summary
Missing data is ubiquitous in big-data clinical trials. Some investigators use the method of complete case analysis and this can get reliable results when missing values are at random and the proportion is not large. However, it is common that complete case analysis many result in information attrition when there are many variables. Imputation is an alternative that can help to obtain reliable results. This article introduces some simple imputation methods. Mean, median and mode imputations are simple, but they underestimate variance and ignore the relationship with other variables. Regression method can preserve their correlation with other variables but the variability of missing values is underestimated. Variability can be adjusted by adding random errors to the regression model. Indicator method is to replace missing values with zeros, which is not recommended for general use. Longitudinal data are special and there are many methods exist for imputations. This is an area of active research and it is controversial on which method is the best. Based on simulation study, the copy mean method may be a good choice (9).
Acknowledgements
None.
Biography
Author’s introduction: Zhongheng Zhang, MMed. Department of Critical Care Medicine, Jinhua Municipal Central Hospital, Jinhua Hospital of Zhejiang University. Dr. Zhongheng Zhang is a fellow physician of the Jinhua Municipal Central Hospital. He graduated from School of Medicine, Zhejiang University in 2009, receiving Master Degree. He has published more than 35 academic papers (science citation indexed) that have been cited for over 200 times. He has been appointed as reviewer for 10 journals, including Journal of Cardiovascular Medicine, Hemodialysis International, Journal of Translational Medicine, Critical Care, International Journal of Clinical Practice, Journal of Critical Care. His major research interests include hemodynamic monitoring in sepsis and septic shock, delirium, and outcome study for critically ill patients. He is experienced in data management and statistical analysis by using R and STATA, big data exploration, systematic review and meta-analysis.
Footnotes
Conflicts of Interest: The author has no conflicts of interest to declare.
References
- 1.Wood AM, White IR, Thompson SG. Are missing outcome data adequately handled? A review of published randomized controlled trials in major medical journals. Clin Trials 2004;1:368-76. [DOI] [PubMed] [Google Scholar]
- 2.Bell ML, Fiero M, Horton NJ, et al. Handling missing data in RCTs; a review of the top medical journals. BMC Med Res Methodol 2014;14:118. [DOI] [PMC free article] [PubMed] [Google Scholar]
- 3.Demissie S, LaValley MP, Horton NJ, et al. Bias due to missing exposure data using complete-case analysis in the proportional hazards regression model. Stat Med 2003;22:545-57. [DOI] [PubMed] [Google Scholar]
- 4.Knol MJ, Janssen KJ, Donders AR, et al. Unpredictable bias when using the missing indicator method or complete case analysis for missing confounder values: an empirical example. J Clin Epidemiol 2010;63:728-36. [DOI] [PubMed] [Google Scholar]
- 5.Masconi KL, Matsha TE, Erasmus RT, et al. Effects of different missing data imputation techniques on the performance of undiagnosed diabetes risk prediction models in a mixed-ancestry population of South Africa. PLoS One 2015;10:e0139210. [DOI] [PMC free article] [PubMed] [Google Scholar]
- 6.Buuren SV, Groothuis-Oudshoorn K. mice: Multivariate Imputation by Chained Equations in R. Journal of Statistics Software 2011;45:1-67. [Google Scholar]
- 7.van der Heijden GJ, Donders AR, Stijnen T, et al. Imputation of missing values is superior to complete case analysis and the missing-indicator method in multivariable diagnostic research: a clinical example. J Clin Epidemiol 2006;59:1102-9. [DOI] [PubMed] [Google Scholar]
- 8.Genolini C. longitudinalData: Longitudinal Data. Available online: https://cran.r-project.org/web/packages/longitudinalData/longitudinalData.pdf
- 9.Genolini C, Écochard R, Jacqmin-Gadda H. Copy Mean: A New Method to Impute Intermittent Missing Values in Longitudinal Studies. Open Journal of Statistics 2013;3:26-40. [Google Scholar]
- 10.Twisk J, de Vente W. Attrition in longitudinal studies. How to deal with missing data. J Clin Epidemiol 2002;55:329-37. [DOI] [PubMed] [Google Scholar]
- 11.Engels JM, Diehr P. Imputation of missing longitudinal data: a comparison of methods. J Clin Epidemiol 2003;56:968-76. [DOI] [PubMed] [Google Scholar]


