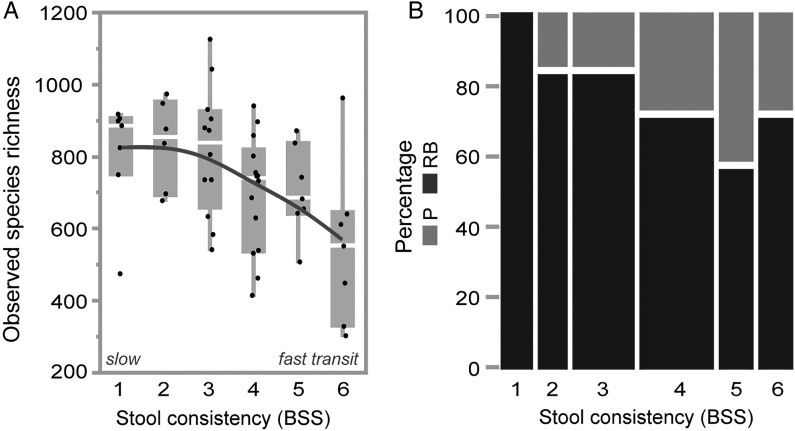
Figure 1.
Stool consistency variation drives species richness and human enterotypes. Correlation between (A) observed species richness and stool consistency, defined by Bristol Stool Scale (BSS) (Spearman's correlation, r=−0.45, p=0.0007) and (B) enterotype distribution and stool consistency (BSS); Blue: Ruminococcaceae-Bacteroides (RB) enterotype (r=−0.88, p=0.019), green: P enterotype (r=0.88, p=0.019).

