Abstract
We present an optical system, called the quantitative absorption cytometer (QAC), to measure the volume and hemoglobin mass of red blood cells flowing through a microfluidic channel. In contrast to clinical hematology analyzers, where cells are sphered in order for both volume and hemoglobin to be measured accurately, the QAC measures cells in their normal physiological shape. Human red blood cells are suspended in a refractive index-matching absorbing buffer, driven through a microfluidic channel, and imaged using a transmission light microscope onto a color camera. A red and a blue LED illuminate cells and images at each color are used to independently retrieve cell volume and hemoglobin mass. This system shows good agreement with red blood cell indices retrieved by a clinical hematology analyzer and in fact measures a smaller coefficient of variation of hemoglobin concentration. In addition to cell indices, the QAC returns height and mass maps of each measured cell. These quantitative images are valuable for analyzing the detailed morphology of individual cells as well as statistical outliers found in the data. We also measured red blood cells in hypertonic and hypotonic buffers to quantify the correlation between volume and hemoglobin mass under osmotic stress. Because this method is invariant to cell shape, even extremely nonspherical cells in hypertonic buffers can be measured accurately.
Key terms: cell volume, hemoglobin mass, red blood cells, quantitative absorption cytometry, microfluidics
Accurate measurements of red blood cell volume and hemoglobin mass are critical for the diagnosis and study of many different forms of anemia and other diseases affecting the hematologic system (1). In addition to mean values, single cell measurements are becoming increasingly valuable in order to characterize the entire distribution of a sample (2). Clinical hematology analyzers routinely quantify volume of single cells, and some instruments quantify hemoglobin as well. These instruments are similar to flow cytometers and measure optical scattering of individual cells (3). One current challenge in single cell measurements, however, is to differentiate instrumental variability from biological variability. A second method based on a different measurement principal would be extremely valuable in order to compare the sample distribution on a single cell level. A second method exists based on quantitative phase imaging (4), but only results for mean values (5) have been compared to that of a clinical hematology analyzer. Consequently, the biological variability of hemoglobin mass and red blood cell volume is still not well understood.
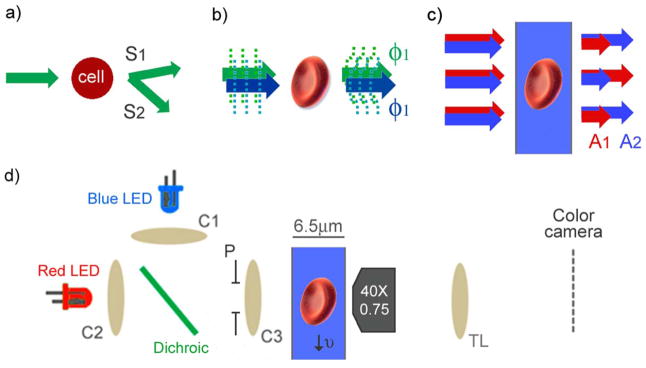
In a clinical hematology analyzer, cell volume and hemoglobin concentration can be retrieved from the scattering signals using Mie theory, but only for spherical cells (3). Because red blood cells are not normally spherical in shape, cells are pretreated with an isovolumetric sphering agent before measurement (6). While this method produces repeatable results and has proved extremely valuable clinically, cells must reduce their surface area to become spheres isovolumetrically and are left in a non-physiological state. In addition, cells from patients with certain pathologies such as sickle cell disease have proven difficult to sphere (7). Scattering measurements are collected at two angular intervals (Fig. 1a) and these two measurements are then mapped into hemoglobin concentration and cell volume. The mapping functions are nonlinear, which results in measurement uncertainty that is difficult to quantify.
Figure 1.
Comparison of optical measurement methods of red blood cell indices. (a) Clinical hematology analyzers quantify optical scattering at different angular intervals, S1 and S2. (b) Phase imaging quantifies optical phase shift of transmitted light, ϕ1 and ϕ2, at two different colors. (c) Quantitative absorption cytometry (QAC) measures transmitted light, A1 and A2, through cells immersed in an absorbing buffer at two different colors. (d) QAC uses two LEDs collimated by condenser lenses (C1, C2) and focused into the channel using C3. The condenser aperture (P) is set so that the illumination numerical aperture is 0.4. Cells travel through the microfluidic channel and are imaged onto a color camera using a microscope objective and tube lens (TL). [Color figure can be viewed in the online issue, which is available at wileyonlinelibrary.com.]
Quantitative phase imaging, or other forms of interferometric microscopy, has also frequently been used for performing volume and refractive index measurements on cells. Quantitative phase microscopes work effectively on cells that are not spherical and return phase maps that spatially resolve cell morphology (Fig. 1b). From a single phase image, however, it is not possible to decouple refractive index and cell height. These two parameters have been decoupled by suspending the same cell in multiple buffers with different refractive index (5), collecting multiple phase images at different colors (8), or combining with absorption measurements (9). After decoupling, hemoglobin concentration can be calculated from refractive index and cell volume can be calculated using the cell height map. Although quantitative phase microscopy has been performed on cells in flow (10), these microscopes often require multiple exposures making high throughput analysis challenging.
In this article, we present an optical system based on two color absorption that is capable of measuring red blood cell volume and hemoglobin mass. First, we describe the physical principles of this measurement method. We then compare the results of this system to that of a clinical hematology analyzer. Finally, we present cell volume and hemoglobin mass measurements at different osmotic pressures.
Materials and Methods
Quantitative Absorption Cytometry
In contrast to optical phase or scattering measurements, it is possible to measure the volume of a cell optically with a method that is nearly independent of the cell’s optical properties (11–13). This method is analogous to an electrical Coulter counter, where the measured cell volume is proportional to the number of displaced charges in the electrolyte and not the cell’s electrical properties. In the optical method, the electrolyte is replaced by a non membrane permeable absorbing dye and the aperture is replaced by a microfluidic channel (Figs. 1c and 1d). The presence of a cell in the detection region displaces dye molecules in the optical path and consequently increases the transmitted light signal. If there is minimal absorption or scattered light from the cell, the change in optical transmission can be related to the absolute cell height at each pixel of the image.
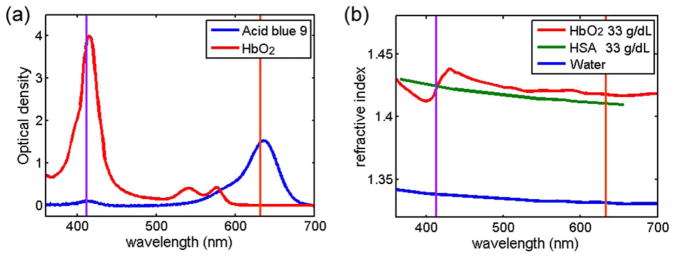
To satisfy the condition that the intensity modulation of the transmitted image is solely from dye exclusion, there needs to be minimal scattering or absorption from the cell (13). The absorption spectrum of oxygenated hemoglobin is shown in Figure 2a (14). We assume that all of the cellular hemoglobin is oxygenated because measurements are carried out under ambient conditions of 21% oxygen partial pressure. Volume measurements are performed using a red LED emitting light having a wavelength of 630 nm. The decay length (1/e) of red light traveling through oxygenated hemoglobin with a concentration of 33 g dL−1 is 1.44 mm, corresponding to absorption of <0.5% for a cell that is 5-μm thick.
Figure 2.
Imaginary and real part of the refractive index. (a) The optical density of a 6.5-μm-thick film of oxygenated hemoglobin (33 g dL−1) and acid blue 9 (0.8 g dL−1) in bovine serum albumin (33 g dL−1). (b) The refractive index of oxygenated hemoglobin, horse serum albumin, and water. The two vertical lines show the wavelengths of the two LEDs at 412 and 630 nm. [Color figure can be viewed in the online issue, which is available at wileyonlinelibrary.com.]
To minimize scattering, the refractive index of the buffer has been increased to match the average cell refractive index. Because red blood cells have minimal internal structure, cells suspended in a refractive index-matched buffer will only scatter a small amount of light due to the membrane having a slightly higher refractive index than the cytoplasm. Figure 2b plots the refractive index dispersion of water (15), horse serum albumin (16), and oxygenated hemoglobin (17). The dispersion is plotted for a protein concentration of 33 g dL−1 of both the hemoglobin and the horse serum albumin by using the refractive increment taken from Ref. 15) and (16). In our measurements we use bovine serum albumin (BSA) instead of horse serum albumin, but assume they have similar optical properties. Hemoglobin and BSA have similar molecular weights and have similar refractive increments (18). Consequently, we have used a concentration of 33 g dL−1 BSA solution to refractive index match a cell hemoglobin concentration of 33 g dL−1. Because not every red blood cell has the same hemoglobin concentration, the refractive index matching is not perfect for every cell. Using the refractive index-matching buffer minimizes scattering, however, and the resulting transmitted intensity modulation is due primarily to absorption.
Volume Measurement using Dye Exclusion
To produce the dye exclusion absorption signal, 0.8 g dL−1 of acid blue 9 (AB9, TCI America, Portland, OR, cat. no B0790) is added to the cell buffer. Acid blue 9 has an absorption peak at 630 nm, which matches the red LED, and has been found to be non-membrane permeable (19). Figure 2a shows the optical density, base e, of AB9 in a BSA solution for a sample depth of 6.5 μm measured using a spectrometer (Jaz, Ocean Optics). The optical density for a wavelength of 630 nm is 1.53, which corresponds to a 1/e decay length of 4.2 μm.
Quantitative absorption measurements require a reference image so that the relative intensity can be measured accurately. Microfluidic fluid flow enables efficient delivery of the cells through the microscope field of view, so that cell images and reference images can be easily captured without moving the microscope optics. From a reference image and the cell image, the cell height (t) is evaluated as
| Equ (1) |
where Icell is an image when the cell is in the field of view, Iref is an image when there is not a cell in the field of view, and α is the absorption coefficient of the AB9, which is experimentally determined to be 0.2 μm−1 by measuring red light absorption and using the known microfluidic channel thickness (6.5 μm). Cells are illuminated using a condenser with an effective numerical aperture of 0.4. Images are captured with a 40×, 0.75 NA Nikon Fluorite objective lens and projected onto a Pike 032c, color CCD camera (Allied Vision, Stadtroda, Germany), shown in Figure 1d. The total volume can then be calculated by summing the cell height values at each pixel and multiplying by the effective pixel area, which in our system is 0.034 μm2.
Hemoglobin Mass Measurement using Soret Band Absorption
While using the red channel of the color camera to measure cell volume, we can simultaneously measure the hemoglobin mass using the blue channel through hemoglobin absorption. Hemoglobin mass is measured directly, unlike both scattering and phase measurement systems that measure refractive index which is proportional to hemoglobin concentration. Mass maps of nucleic acids and protein content of individual cells have been measured using absorption (20,21), but to the best of our knowledge absorption has never been used to resolve the mass distribution of a sample of red blood cells. The optical density of a hemoglobin solution is shown in Figure 2a for a concentration of 33 g dL−1 and sample thickness of 6.5 μm. To measure cellular hemoglobin mass we use a blue LED that has a center wavelength of 412 nm which is located close to the peak absorption of oxygenated hemoglobin, known as the Soret band. Because the LED has a finite spectral width of 15 nm full-width-at-half-maximum, we have calculated the effective molar extinction coefficient (αHb = 4.06 × 10⁵ M−1 cm−1) by spectrally weighting the hemoglobin absorption spectrum over the LED spectrum. For a hemoglobin concentration of 33 g dL−1, the decay length (1/e) of the blue LED is only 2.1 μm, which yields extremely high contrast for the blue channel image. A hemoglobin mass map can be reconstructed using Eq. (1), except replacing αAB9 with −αHb. While typically it is difficult to separate scattering from absorption in extinction measurements of single cells, the refractive index-matching buffer reduces scattering artifacts in the mass measurement in a similar way as with the volume measurements. We call the optical system that combines absorption measurements for volume and hemoglobin mass the quantitative absorption cytometer (QAC).
Cell Collection and Preparation
Whole blood from healthy donors was obtained from an outside supplier (Research Blood Components, Brighton, MA). Blood was collected in an EDTA vacutainer and shipped on ice. Experiments on both the clinical hematology analyzer and the QAC were performed within 6 h of acquiring the samples. For measurements with the QAC, blood was rinsed with phosphate buffer saline (PBS) and spun down at 2,000 RPM for 10 min to remove the serum. To the remaining cells was added 247.5 μL of 40% BSA in PBS, 12 μL of 20% AB9 in PBS, 3 μL of water, and 27.6 μL of 10× PBS, to produce a final osmotic pressure of 272 mOsm. Cells were then loaded into microfluidic channels that are 15-μm wide and 6.5-μm deep and driven through the device using a syringe pump at a rate of ~1,000 per minute per channel.
Results
Hemoglobin Mass and Thickness Maps
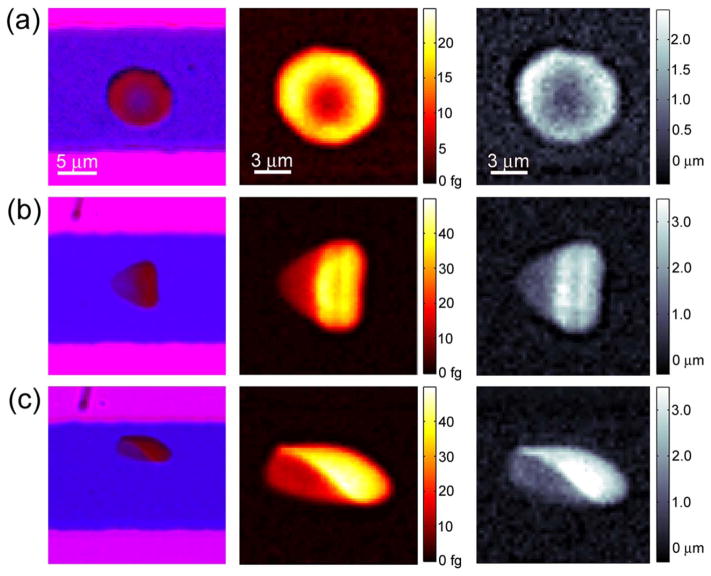
When cells are stationary they take a discoid shape, as is commonly seen in blood smears. Figure 3a shows an image of a stationary cell inside a microfluidic channel. The images on the left are the raw data captured by the color camera, where outside of the channel appears pink due to the red and blue illumination, inside the channel is primarily blue because of red light absorption in the dye, and inside the cell appears red because of blue light absorption in the cell hemoglobin. From background normalized transmission images, mass and height maps can be reconstructed, and are shown in the middle and right columns, respectively. The mass maps quantitatively show the hemoglobin mass per pixel, 185 × 185 nm2 in the object plane, which has a peak value of 50 femtograms. The discoid cell shown in Figure 3a has a maximum height of 2.7 μm and has a minimum center height of 0.42 μm, which agrees with previous studies (22).
Figure 3.
Single cell hemoglobin mass and volume. The first column shows raw color images collected by the camera. The second column shows processed mass maps using the blue channel. The third column shows processed height maps using the red channel. The cell in (a) is stationary, while the cells in (b, c) are flowing at 4 mm s−1 from left to right. [Color figure can be viewed in the online issue, which is available at wileyonlinelibrary.com.]
As has been observed in vivo (23), however, cells in confined shear flow take a parachute shape and are not discoidal. Figures 3b and 3c show two examples of red blood cells taking a parachute shape. Cells flow through the system at 4–5 mm s−1 and the symmetry of their shape depends on their location in the channel. All three cells in Figure 3 have similar volumes and weights, which are 80.2, 80.3, 85.1 fL, and 29.2, 29.5, and 31.4 pg, respectively for a, b, and c. The standard deviation (σ) of the background of the mass map is 0.3 fg and of the height map is 130 nm, which gives the resolution of each pixel and is primarily due to intensity fluctuations of the light source. To evaluate the noise level for cellular measurements, we compare the total mass and volume of the cell in consecutive camera exposures, which give a standard deviation of 75 fg for mass (one part in 250) and 0.85 fL for volume (one part in 100). We found these values to be similar for both stationary and flowing cells. Images are captured using an exposure time of 160 μs at a rate of 300 frames per second. Temporal averaging can further reduce noise, but this is more effective for stationary cells due to the difficulty in image registration of moving cells.
Volume and Hemoglobin Mass Distributions
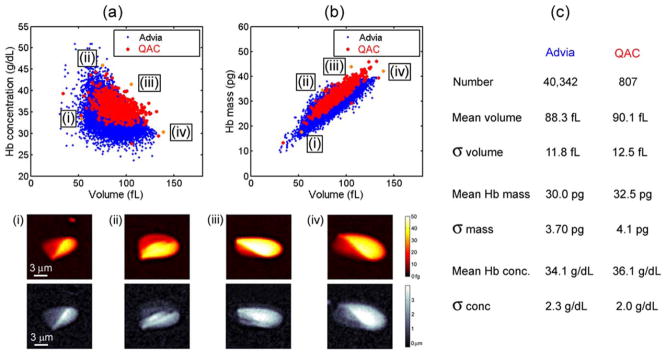
To compare our system to a clinical standard we have measured the same blood sample with the Siemens Advia 2120 clinical hematology analyzer and the QAC. Complete blood counts commonly show a scatter plot of red blood cell volume and hemoglobin concentration, enabling their correlation to be displayed graphically. Figure 4a shows volume and concentration scatter plots collected by the two systems. Both measurements show a negative correlation between volume and hemoglobin concentration, which has previously been studied (2). The two methods agree within 2% for mean volume and within 8% for mean hemoglobin mass. Interestingly, while the coefficient of variation (COV, σ/mean) of the volume and mass agree within 5% for the two methods, the hemoglobin concentration measured by QAC has a 20% smaller COV. Hemoglobin concentration is thought to be tightly regulated in red blood cells (2), and the measurement of a more narrow distribution might more accurately reflect the actual population. The smaller COV of hemoglobin concentration collected by the QAC indicates that this system measures hemoglobin concentration on a cellular level more accurately than the clinical hematology analyzer.
Figure 4.
Comparison between the QAC and the clinical hematology analyzer. (a, b) Show scatter plots measured by both systems of the volume vs. hemoglobin concentration and volume vs. hemoglobin mass of the same sample. Below the scatter plot are displayed mass and height maps of four cells occurring at the edges of the distribution. (c) Shows a chart that compares the mean and standard deviation of volume, mass and concentration for the two measurement systems. [Color figure can be viewed in the online issue, which is available at wileyonlinelibrary.com]
Similar to imaging flow cytometry (24,25), every data point can be connected to a height and a mass map of the cell. This is especially useful for studying statistical outliers and verifying the fidelity of stray points. At the bottom of Figure 4 are four examples of cells that lie at the edges of the scatter plot distribution. The first cell has a normal hemoglobin concentration, but a volume of only 53 fL, which is <60% of the mean value. The second cell has the highest hemoglobin concentration of the set, 46 g dL−1. This extremely large concentration corresponds to an internal cell viscosity of >170 cP, where as the viscosity of a hemoglobin concentration of 37 g dL−1 is only 15 cP (26). The third and fourth cells both have large mass, 44 and 42 pg, and are likely reticulocytes, though this cannot be confirmed in our system. While the fourth cell also has a large volume, 139 fL, the third cell has a smaller volume of 106 fL. Using the images, we can verify that these outliers are individual red blood cells and their morphology can be characterized as a function of volume, mass, and hemoglobin concentration.
Measurements as a Function of Osmotic Pressure
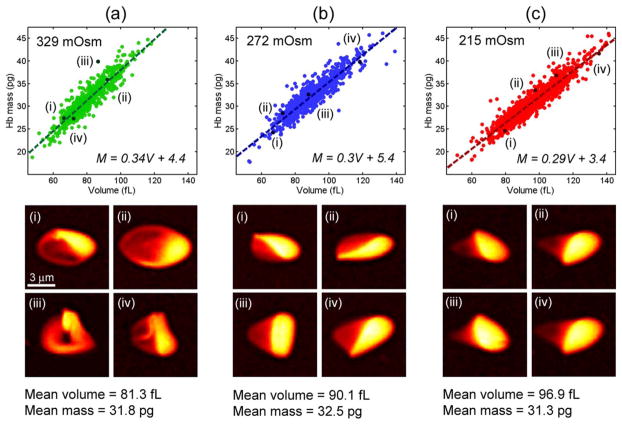
In addition to isotonic conditions, the QAC can also measure cell volume and hemoglobin mass as a function of osmotic pressure. This measurement is challenging in clinical hematology analyzers because they are capable of measuring only spherical cells. In our system, the osmotic pressure of the buffer is adjusted by adding a different relative fraction of 10× PBS, which can produce both hypertonic and hypotonic solutions. Figure 5 shows volume and mass scatter plots for cells in 329, 272, and 215 mOsm buffers. The mass and volume are linearly correlated in all three buffers, but the slope increases as a function of osmotic strength. While cell volume increases with reduced osmolarity, cell hemoglobin mass is consistent across the three measurements, as expected. The COV of the mean mass is <2% and the COV of the standard deviation of cell mass is <1%, implying that the greater irregularity of hypertonic cell shape does not produce a larger variance of cell mass. The mass map of four representative cells is shown below each scatter plot. As can be seen in the images, cells in the hypertonic buffer are significantly nonspherical and often have a folded membrane due to a loss in volume. Because of the consistency of the retrieved data, we conclude that the QAC quantifiably measures volume and mass independently of cell shape.
Figure 5.
Hemoglobin mass and volume under osmotic stress. (a–c) Scatter plots of mass and volume in hypertonic (329 mOsm), isotonic (272 mOsm), and hypotonic (215 mOsm) buffers. Below each scatter plot are shown four mass maps of representative cells from the distribution. [Color figure can be viewed in the online issue, which is available at wileyonlinelibrary.com.]
Discussion
In this article we have presented a high throughput optical system for measuring cell volume and hemoglobin mass of individual red blood cells called the quantitative absorption cytometer (QAC). Unlike scattering or phase based measurements, the QAC measures volume and hemoglobin mass independently using absorption of hemoglobin and a well characterized dye. We observe reasonable agreement between the data produced by this system and a clinical hematology analyzer. In fact, while the QAC produces a similar coefficient of variation for cell volume and hemoglobin mass, it produces a smaller coefficient of variation of hemoglobin concentration, implying measurement accuracy of the QAC could be greater than the clinical hematology analyzer that we tested. This could be due to the fact that cells in the clinical hematology analyzer are modeled as perfect spheres, while this is likely not exactly true. The QAC, however, does not require this assumption. By analyzing cells under different osmotic pressure, we have verified the shape independence of the QAC’s measurement principle.
In addition, the QAC is able to measure cells in their normal physiological shape unlike the clinical hematology analyzer, where cells need to be fixed in an isovolumetrically sphering agent. For every cell, a mass map and a height map is produced, so cell morphology can be analyzed as a function of hemoglobin mass, volume or hemoglobin concentration. Other morphological properties can be defined on the cell images, such as aspect ratio or perimeter. However, because in our fluidic system cells are not hydrodynamically focused, they experience different shear forces depending on their position in the microfluidic channel. This results in variations of cell shape that are likely not due to the properties of each cell, but due to their location in the microfluidic channel.
By taking further advantage of microfluidic technology, we plan on using this system for future studies on cell mass and volume as a function of other biological, chemical, and physical perturbations. This could lead to observation of biological processes that are otherwise difficult to quantify, such as cell volume regulation, senescence, and vesiculation.
Literature Cited
- 1.Wintrobe MM, Greer JP. Clinical Hematology. Philadelphia: Lea and Febiger; 1981. [Google Scholar]
- 2.Higgins JM, Mahadevan L. Physiological and pathological population dynamics of circulating human red blood cells. Proc Natl Acad Sci USA. 2010;107:20587–20592. doi: 10.1073/pnas.1012747107. [DOI] [PMC free article] [PubMed] [Google Scholar]
- 3.Tycko DH, Metz MH, Epstein EA, Grinbaum A. Flow-cytometric light scattering measurement of red blood cell volume and hemoglobin concentration. App Opt. 1985;24:1355–1365. doi: 10.1364/ao.24.001355. [DOI] [PubMed] [Google Scholar]
- 4.Popescu G. Quantitative Phase Imaging of Cells and Tissues. New York: McGraw-Hill Biophotonics; 2011. [Google Scholar]
- 5.Rappaz B, Barbul A, Emery Y, Korenstein R, Depeursinge C, Magistretti PF, Marquet P. Comparative study of human erythrocytes by digital holographic microscopy, confocal microscopy, and impedence volume analyzer. Cytometry A. 2008;73A:895–903. doi: 10.1002/cyto.a.20605. [DOI] [PubMed] [Google Scholar]
- 6.Kim YR, Ornstein L. Isovolumetric sphering of erythrocytes for more accurate and precise cell volume measurement by flow cytometry. Cytometry. 1983;3:419–427. doi: 10.1002/cyto.990030606. [DOI] [PubMed] [Google Scholar]
- 7.Steinberg MH, Forget BG, Higgs DR, Nagel RL, Franklin Bunn H. Disorders of Hemoglobin: Genetics, Pathophysiology, and Clinical Management. Cambridge, UK: Cambridge University Press; 2000. [Google Scholar]
- 8.Park Y, Yamauchi T, Choi W, Dasari R, Feld MS. Spectroscopic phase microscopy for quantifying hemoglobin concentrations in intact red blood cells. Opt Lett. 2009;34:3668–3670. doi: 10.1364/OL.34.003668. [DOI] [PMC free article] [PubMed] [Google Scholar]
- 9.Mir M, Tangella K, Popescu G. Blood testing at the single cell level using quantitative phase and amplitude microscopy. Opt Exp. 2011;2:3259–3266. doi: 10.1364/BOE.2.003259. [DOI] [PMC free article] [PubMed] [Google Scholar]
- 10.Gorthi SS, Schonbrun E. Phase imaging flow cytometry using a focus-stack collecting microscope. Opt Lett. 2012;37:707–709. doi: 10.1364/OL.37.000707. [DOI] [PubMed] [Google Scholar]
- 11.Gray ML, Hoffman RA, Hansen WP. A new method for cell volume measurement based on volume exclusion of a fluorescence dye. Cytometry. 1983;3:428–434. doi: 10.1002/cyto.990030607. [DOI] [PubMed] [Google Scholar]
- 12.Model MA, Khitrin AK, Blank JL. Measurement of the absorption of concentrated dyes and their use for quantitative imaging of surface topography. J Micro. 2008;231:156–167. doi: 10.1111/j.1365-2818.2008.02026.x. [DOI] [PubMed] [Google Scholar]
- 13.Schonbrun E, DiCaprio G, Schaak D. Dye exclusion microfluidic microscopy. Opt Exp. 2013;21:8793–8798. doi: 10.1364/OE.21.008793. [DOI] [PubMed] [Google Scholar]
- 14.Prahl S. Tabulated molar extinction coefficient for hemoglobin in water. 1998 Available at: http://omlc.ogi.edu/spectra/hemoglobin/summary.html.
- 15.Daimon M, Masumura A. Measurement of the refractive index of distilled water from the near-infrared region to the ultraviolet region. App Opt. 2007;46:3811–3820. doi: 10.1364/ao.46.003811. [DOI] [PubMed] [Google Scholar]
- 16.McFarlane AS. An ultracentrifugal investigation of the serum proteins. Biochem J. 1935;29:407–429. doi: 10.1042/bj0290407. [DOI] [PMC free article] [PubMed] [Google Scholar]
- 17.Friebel M, Meinke M. Model function to calculate the refractive index of native hemoglobin in the wavelength range of 250–1100 nm dependent on concentration. App Opt. 2006;12:2838–2842. doi: 10.1364/ao.45.002838. [DOI] [PubMed] [Google Scholar]
- 18.Barer R, Tkaczyk S. Refractive index of concentrated protein solutions. Nature. 1954;173:821–822. doi: 10.1038/173821b0. [DOI] [PubMed] [Google Scholar]
- 19.Gregg JL, McGuire KM, Focht DC, Model MA. Measurement of the thickness and volume of adherent cells using transmission-through-dye microscopy. Pflugers Arch. 2010;460:1097–1104. doi: 10.1007/s00424-010-0869-2. [DOI] [PubMed] [Google Scholar]
- 20.Hardie DC, Gregory TR, Hebert PDN. Pixels to pictograms: A beginners’ guide to genome quantification by Feulgen image analysis densitometry. Histochem Cytochem. 2002;50:735–749. doi: 10.1177/002215540205000601. [DOI] [PubMed] [Google Scholar]
- 21.Cheung MC, Evans JG, McKenna B, Ehrlich DJ. Deep ultraviolet mapping of intra-cellular protein and nucleic acid in femtograms per pixel. Cytometry A. 2011;79A:920–932. doi: 10.1002/cyto.a.21111. [DOI] [PMC free article] [PubMed] [Google Scholar]
- 22.Evans E, Fung YC. Improved measurement of the erythrocyte geometry. Microvasc Res. 1972;4:335–347. doi: 10.1016/0026-2862(72)90069-6. [DOI] [PubMed] [Google Scholar]
- 23.Skalak R, Branemark PI. Deformation of red blood cells in capillaries. Science. 1969;164:717–719. doi: 10.1126/science.164.3880.717. [DOI] [PubMed] [Google Scholar]
- 24.Basiji DA, Ortyn WE, Liang L, Venkatachalam V, Morrissey P. Cellular image analysis and imaging by flow cytometry. Clin Lab Med. 2007;27:653–670. doi: 10.1016/j.cll.2007.05.008. [DOI] [PMC free article] [PubMed] [Google Scholar]
- 25.Schonbrun E, Gorthi SS, Schaak D. Microfabricated multiple field of view imaging flow cytometry. Lab Chip. 2012;12:268–273. doi: 10.1039/c1lc20843h. [DOI] [PubMed] [Google Scholar]
- 26.Mohandes N, Gallagher PG. Red cell membrane: Past, present, and future. Blood. 2008;15:3939–3948. doi: 10.1182/blood-2008-07-161166. [DOI] [PMC free article] [PubMed] [Google Scholar]


