

Abstract
The nutritional status of an individual or population needs to be assessed through valid and reliable biomarkers. Cutoffs generally have an underlying relation to health status and are one of the important quantitative criteria against which biomarker outputs are compared. For this reason, cutoffs are integral for surveys, surveillance, screening, interventions, monitoring, and evaluation. Despite their importance, nutritional biomarker cutoffs have not been adequately addressed in the literature. Furthermore, the field has not reached a consensus on which cutoff to use for each biomarker, and different cutoffs are often used for the same biomarkers in published studies. This review provides a comprehensive overview of cutoffs related to nutritional biomarkers and highlights some of the high-priority research gaps and challenges of using micronutrient case studies.
Keywords: cutoffs, nutritional biomarkers, Youden index, ROC curve, nutritional assessment, nutritional surveillance, nutritional deficiency, reference values
Introduction
Experts view biomarkers as representative molecules or as responses to a disease or intervention, although several overlapping definitions of biomarkers exist in the literature (1, 2). The NIH defines biomarkers as biological measurements (e.g., in blood or urine) that are used to indicate “normal biological processes, pathogenic processes, or pharmacologic responses to therapeutic intervention” (1). Although a wide range of biomarkers are available whose utility depends on the purpose of evaluation, no single biomarker has thus far been deemed to be a gold standard for all purposes (3).
Nutritional biomarkers are essential for assessing the nutritional status of an individual and/or population. These biomarkers are commonly used in basic and clinical research and in community assessments. In general, program managers and policymakers use population-level biomarkers for screening, surveillance, and monitoring and evaluation of interventions; clinicians use biomarkers mainly for diagnosis, prognosis, and treatment; and researchers use biomarkers for any or all of these purposes based on their needs (4). There are some important attributes that need to be considered for population-level biomarkers such as sensitivity, specificity, predictive values, likelihood ratios, field friendliness, measurement error, and low cost. On the other hand, in a clinical setting, assay features conducive to point-of-care testing are important, as are the previously mentioned characteristics (5). Although assessment at a population level is used to plan and evaluate population-based interventions, the assessment of individuals can be used for treatment, follow-up, or counseling. The important distinction between individual- and population-based assessment is that, whereas the former needs to be precise at the individual level, the latter may not provide certainty with regard to every single individual’s true status. Despite these differences, some population-level biomarkers and their cutoffs may still be valid for detecting individuals at risk of deficiency (6).
An essential component of applying nutritional biomarkers for clinical or public health purposes is the development and acceptance of cutoffs designed to identify those who are at risk of adverse health outcomes as a result of either under- or overexposure to nutrients and those who are not at risk of these outcomes. Relying upon specific micronutrients as case studies, this review summarizes the literature on cutoffs for nutritional biomarkers and highlights the challenges of using them.
Current Status of Knowledge
What are cutoffs?
The Institute of Medicine (7) defines a cutoff for a biomarker as a “specified quantitative measure used to demarcate the presence or absence of a health-related condition; often used in interpreting measures obtained from analysis of blood.” Cutoffs generally reflect the underlying health status of the population and are required for translating, stratifying, and reliably distinguishing the spectrum of results that represents a continuum from deficiency to excess obtained from a biomarker analysis (8, 9). The continuum of biomarker results is often broken down into 3 categories: inadequate, adequate, and excess intake (10).
Cutoffs are important for making good decisions about how to translate what we know about diet, nutrition, and health into evidence-based standards of care or programs and are important for comparing data across studies, regions, and countries (11). They play an integral role in nutritional surveys, intervention, monitoring, and evaluation and help compare surveillance results across populations that assess progress against global health targets. Cutoffs provide benchmarks and are commonly used in research and clinical settings because of their inherent uses, including 1) simplicity of risk classification as deficient compared with excess; 2) ease of interpreting effect measures such as OR and relative risk; 3) estimating diagnostic criteria; 4) deciphering the underlying relation between the biomarker results and health outcomes; and 5) summarizing data more efficiently (8, 12, 13).
Despite these advantages, a great deal of uncertainty and confusion exists regarding the use of cutoffs in nutritional assessment at the clinical and community levels. Their utility differs between clinical, epidemiological, and other research (14). The methods used to identify a cutoff are seldom documented in the literature, and optimal cutoffs are often chosen in a fairly nonsystematic manner—sometimes selected strategically to minimize the P value and improve the statistical significance that relates to prognostic factor outcomes (10, 15, 16). To our knowledge, no universally accepted cutoffs are available for many micronutrient biomarkers, and even some well-accepted cutoffs may not always correlate with physiological indexes or functions (17–19). Thus, selecting an appropriate cutoff for a given biomarker requires careful derivation and “agenda-free science” (20).
Categorizing continuous biomarker values using cutoffs.
Figure 1 shows the distribution and overlap of populations with normal and deficient nutrient status. Ideally, a cutoff accurately distinguishes people with optimum from those with suboptimum values. In real-life situations, however, values in the deficient and optimum areas are usually categorized correctly, but the status of those in the gray area (the overlapping area of the 2 curves in Figure 1) who have subclinical deficiency is difficult to interpret and often misclassified (22). The gray area represents both persons with low or deficient nutritional biomarker values and those with normal values. These misclassifications can affect the sensitivity and specificity of the biomarker (23).
FIGURE 1.

A good discriminatory test with almost perfect ability to discriminate between people with a nutrient deficiency and those with optimum nutrient status. The ability to correctly detect all the true negatives depends on the specificity of the biomarker; the ability to correctly detect all the true positives depends on the sensitivity of the biomarker. FN, false negative; FP, false positive; TN, true negative; TP, true positive. Adapted from reference 21 with permission.
For a given cutoff, the sensitivity and specificity of a biomarker provides the probability of identifying the true nutritional status with precision (22). A good diagnostic and/or screening test should maximize both the sensitivity and specificity of the biomarker (24). However, in some situations, it is impractical to select a cutoff that has both high sensitivity and specificity; instead of compromising 1 over the other, cutoffs can be chosen to minimize the misclassification (8, 15). For example, if a follow-up procedure involves performing invasive or expensive diagnostic tests at an individual or population level, cutoffs with high specificity may be preferred; conversely, if there is a high penalty for not diagnosing an individual (e.g., clinical diagnosis of a fatal condition), then a cutoff with high sensitivity may be selected. Thus, depending on the circumstance, it may be necessary to maximize either sensitivity or specificity, sometimes one at the expense of the other.
How are cutoffs developed and validated?
Receiver operating characteristic curves.
Many cutoffs currently used for nutritional biomarkers were derived using receiver operating characteristic (ROC)6 curves (Figure 2) (8, 25). ROC curves are graphical displays of the true-positive rate (sensitivity) on the vertical axis plotted against the false-positive rate (1-specificity) on the horizontal axis (21, 21, 26, 27). ROC curves are useful for evaluating and comparing the effectiveness of biomarkers in distinguishing nutritional deficiency from optimal status (22, 28).
FIGURE 2.
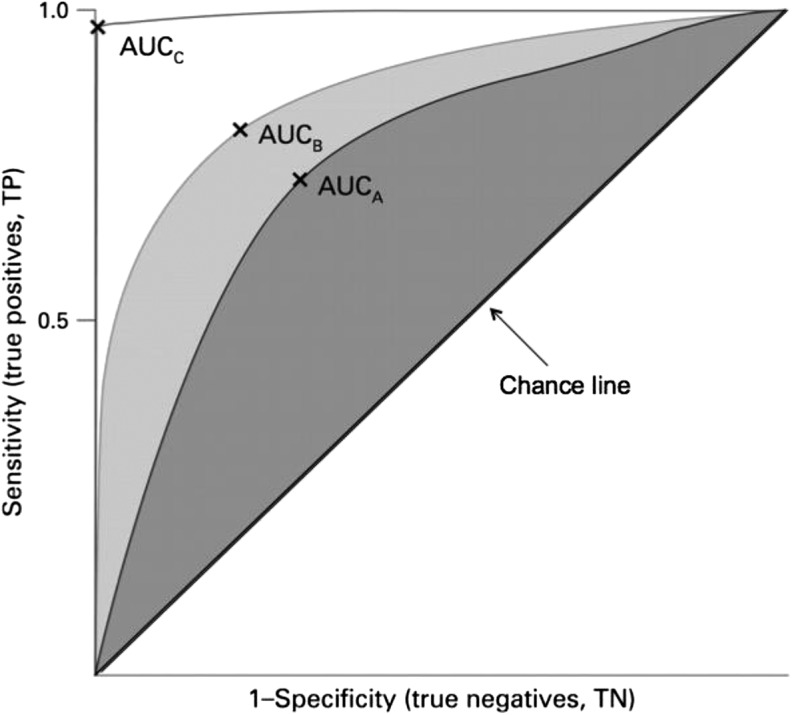
Receiver operating characteristic curves. Three plots and their respective AUCs are given. The diagnostic accuracy of marker C (white area) is better than those of markers B and A. X is the best cutoff for the biomarker. TN, true negative; TP, true positive. Adapted from reference 21 with permission.
AUC, also called the “c statistic,” is a commonly used summary measure of the cutoff’s accuracy. AUCs can range from 0.5 to 1.0, where 0.5 results from random chance or has no predictive ability, ≥0.75 is good, and >0.9 is excellent (15, 21, 29). The larger the AUC, the better the diagnostic ability of the test (22, 30). To illustrate this further, commonly used iron biomarkers have AUCs significantly higher than 0.5. The AUCs for some iron biomarkers are as follows: serum ferritin (SF), 0.82; soluble transferrin receptor, 0.80; soluble transferrin receptor/log ferritin, 0.79; and mean cell hemoglobin concentration, 0.68 (31). When multiple biomarkers are available for the same nutrient, users might prefer the biomarker with the highest AUC (32). Although AUCs can help ascertain a biomarker’s usefulness, they should not be relied upon solely for identifying optimal cutoffs. As discussed previously, other factors such as sensitivity, specificity, and ROC curves should be considered as well (22).
Youden index (J).
J is a summary statistic of the ROC curve used to interpret and evaluate biomarkers (33). This measure of overall diagnostic effectiveness is a function of sensitivity and specificity. J can be defined by J = (maximum sensitivity(c) + specificity(c) − 1) over all cutoffs c, −∞ < c < ∞ (28, 34). According to Ruopp et al. (33), “the cutoff that achieves this maximum is referred to as the optimal cutoff (c*) because it is the point that optimizes the biomarker’s differentiating ability when equal weight is given to sensitivity and specificity.” J can range from 0 to 1, with values closer to 1 indicating a perfect diagnostic test and values closer to 0 signifying a limited effectiveness (28, 34). In many cases, a biomarker’s sensitivity and specificity have an inverse relation, and moving the cutoff increases 1 while lowering the other (34). For continuously distributed biomarkers, J occurs at the intersection of fx and fy, the probability density functions of cases and controls, respectively. In the ROC curve, J is the maximum vertical line from the curve to the positive diagonal, making it the point on the curve furthest from chance (22, 34).
Reference values, reference distribution, and reference limits.
Reference limits are another common method for generating cutoffs (35).They are derived from a reference distribution and are based on 3rd or 5th and 95th or 97th percentiles or on a z score, which indicates the biomarker cutoff values as a number of SDs above or below the reference median or mean (8, 35–37). Reference values are obtained from a well-defined reference sample population (8). Figure 3 describes the relation between reference values and reference distribution, reference limits, and how reference sample are used to arrive at these values (8).
FIGURE 3.

The concept of reference values and their relation to reference distribution, reference limits, and reference intervals. Adapted from reference 8 with permission.
Reference limits help interject the continuum of variables using z scores, and the central 95% of the distribution is assumed to represent a normal range, although unusually high or low values may not necessarily relate to an impairment of health status (5, 19). The reference intervals are the values that are between the lower and upper reference limits (37). The WHO uses z scores for classifying some of the commonly used anthropometric biomarkers. For example, using the WHO growth standard median, the proportion of children with values >2 SDs are categorized as overweight and those with values >3 SDs as obese (38).
Criteria for selecting a reference sample.
The reference limits for a biomarker are generated using a cross-sectional analysis of a reference sample that is derived from a homogenous healthy population of reference individuals who meet well-defined inclusion and exclusion criteria. Although an ideal goal, in real-life situations healthy and unhealthy members of the reference sample are not always easy to distinguish from one another (5, 19, 39, 40). In fact, the selection of healthy reference individuals is the most difficult step in generating reference values. The characteristics of the individuals in the reference sample are rarely documented systematically, and the investigators seldom have access to a healthy population (19). On average, 120 subjects are needed within each category to generate the reference limits for subgroups within each strata such as age groups or sex (5, 41). More often than not, only a small pool of samples are selected to derive a reference range, and it is assumed that the healthy individuals stratified by age and sex are essentially identical (42). When a large random sample is not accessible, a small pool of random samples that represent a large geographic area are selected (42). Because of these challenges in sample selection, the strict exclusion criteria are seldom used, and the reference sample group is drawn from the general population, as in the case of NHANES III (1988–1994) and the United Kingdom National Diet and Nutrition Survey (8). However, in some cases [e.g., measurement of hemoglobin for NHANES III (1988–1994)], strict exclusion criteria are followed, and the reference sample chosen consists only of healthy individuals (8).
The biomarker measurements in individuals are rarely constant, and reference intervals generated from a reference sample using single time point measurements may not be accurate in all scenarios (43). Ideally, multiple measurements are collected, and statistical procedures are used to eliminate the impact of within-person variation. Therefore, to minimize interindividual variability, the population must not only be healthy but homogenous as well (19). Ideally, the reference sample should be the same in terms of age, sex, ethnicity, geography, socioeconomic status, and any other characteristic known to affect the measurement of the reference population (8, 44). It is important to eliminate individuals who have illnesses, take medications, smoke, have chronic alcohol abuse problems, or have certain physiological characteristics (such as pregnancy, lactation, strenuous exercise, or inflammation) when developing the reference intervals for a normal population. However, eliminating individuals with inflammation from a reference population is not always feasible because some populations may have persistent undetected low-grade inflammation (19). When there are obvious differences within a population, the reference values should be adapted to represent different subgroups (42), and sometimes new reference intervals may need to be estimated (19). For example, there has been some consideration for redefining BMI cutoffs for Asian Americans because the established BMI cutoff is inappropriate for this group [e.g., their risk of health conditions such as diabetes increases at a much lower BMI compared with non-Hispanic whites (45)].
Trigger levels for surveillance and public health decision making.
Cutoffs establish a benchmark for estimating the prevalence of certain nutrition-related public problems, such as determining whether a population has optimum status, deficiency, or excess levels. Over the years, international organizations such as the WHO, the International Vitamin A Consultative Group, and the International Zinc Nutrition Consultative Group have identified trigger levels that might signal public health problems (8). These trigger levels should be interpreted with caution because they have not yet been validated in population-based surveys (46). Table 1 provides the WHO classification system for interpreting low SF and high transferrin receptor concentrations at a population level as examples of trigger levels for iron biomarkers.
TABLE 1.
Trigger levels (cutoffs) for SF1
| SF values below trigger level,2 % | Transferrin receptor values abovetrigger level,3 % | Interpretation |
| <204 | <10 | Iron deficiency not prevalent |
| <204 | ≥10 | Iron deficiency and inflammation prevalent |
| ≥205 | ≥10 | Iron deficiency prevalent |
| ≥205 | <10 | Iron depletion prevalent |
Reproduced from reference 46 with permission. SF, serum ferritin.
Apply cutoffs by age group.
Apply cutoffs recommended by the assay manufacturer until an international reference standard is available.
<30% for pregnant women.
≥30% for pregnant women.
Validation.
The standard process of biomarker validation is to compare it to a gold standard of practice with a sufficient population and a defined condition (47). Cutoffs can only be validated through systematic clinical trials and reliable, accurate, harmonized assays. Although NHANES provides reference data that allow the determination of reference limits and cutoffs for healthy US populations, it is important to remember that it is cross-sectional and cannot be used to validate cutoffs (23, 48).
Factors that influence cutoffs
Inherent intra- and interindividual variability influences the sensitivity and specificity of cutoffs and, more importantly, the interpretation of biomarkers (23, 43, 49). Understanding the purpose of the cutoff (e.g., for measurements in an individual or population), patient-specific factors (e.g., underlying biological variations), and external factors (e.g., laboratory methods and assays used to measure the biomarker) is critical in generating and applying cutoffs and reference limits (43). Some examples of these factors include assay characteristics such as assay method, time and method of sample collection, and individual characteristics such as age, sex, genetics, life stage, race/ethnicity, amount of exercise, presence or absence of inflammation, obesity, fasting and hydration status, kidney function, drugs used, nutritional status, and environmental exposure (including smoking), and so on (43). Although these factors are not of equal importance for each biomarker, at least a few critical ones need to be considered.
Individual characteristics.
Age is one of the primary criteria used to establish cutoffs and therefore potentially fits the partition criteria for most biomarkers (19). Cutoffs developed for 1 age group, usually healthy adults, are often adapted for other age groups. However, caution is warranted when applying the same cutoffs to all age groups because inappropriate extrapolations can result in spurious overestimation or underestimation of the prevalence. This is especially true in certain age groups, such as older adults who have other underlying physiological and pathological conditions (17) that may warrant specific cutoffs.
Some issues to consider when altering cutoffs for use in other age groups are 1) how physiological variations resulting from age can be distinguished from the pathological aging process; 2) whether the reference values used in adults can be used and applied in older adults; 3) what the role of medication is and how it influences biomarkers; and 4) whether the cutoffs for younger adults can be used to indicate normal status for older adults with benign, nonfatal conditions (19). Despite these lingering issues, it is sometimes necessary and acceptable to include elderly adults who are not healthy to create reference limits, provided that the disease and medications do not interfere with the biomarkers being measured (39). For example, the commonly used cutoff in adults for SF is 15 μg/L; however, this cutoff may yield inaccurate and unreliable results for the elderly because they often have a spike in SF levels as a result of concomitant chronic disorders (30). Similarly, NHANES data consistently indicate that folate status varies by age. Serum and RBC folate concentrations are twice as high among older than younger adults (50, 51). Although this is primarily associated with supplement use, higher folate levels can be observed among older adults who do not use dietary supplements. In addition to age, other equally important partition criteria include ethnicity, sex, body weight, and physiological state (19). In fact, studies have shown ethnicity-specific differences in some biomarker measurements (52), but these differences are seldom accounted for or even acknowledged.
Pregnancy is 1 of the physiological states that usually require a separate cutoff from that used in nonpregnant women. However, cutoffs are rarely well defined for pregnancy, causing spurious results, especially if nutrient depletion progresses rapidly during pregnancy (as with RBC folate) (51). Hemodilution, especially in the second and third trimesters, affects how the biomarker measurements are interpreted, and the cutoffs used for nonpregnant women may therefore not be appropriate for pregnant women (53, 54).
Another challenge with selecting cutoffs for certain populations (such as pregnant women) is the size of the sample from which the cutoff is derived. Even in large surveys, such as NHANES, samples stratified by trimester or even pregnancy status are relatively small, thereby further restricting the statistical power of drawing meaningful conclusions. Hence, samples should only be stratified when the population subgroups are adequately represented (42).
Using different cutoffs for individuals or populations with different characteristics might be appropriate when the absolute difference among groups in the biomarker measurement is greater than a moderate level of analytical measurement error (55). For example, when serum zinc concentrations were reanalyzed from NHANES II (1976–1980) data, the authors proposed different cutoffs for different sexes, ages, and time/fasting status for serum zinc concentrations because there was a meaningful difference above and beyond the coefficient of variation between groups (55).
Utility of cutoffs based on user needs.
Cutoffs chosen can vary based on user needs. The cutoffs selected for a population may or may not be relevant or applicable in a clinical setting. For example, an SF cutoff of <15 μg/L is used for population-level assessments of iron status (for children older than 5 y and adults) (46). However, a higher cutoff is often used in clinical settings to diagnose iron deficiency because of the high probability that patients with higher SF concentrations have iron deficiency (56). Similarly, in a clinical setting, a serum vitamin B-12 cutoff based on the risk of adverse outcomes might be especially useful for detecting subclinical vitamin B-12 deficiency (48). However, using a clinical cutoff for detecting adverse outcomes at a subclinical level may not be feasible or practical for a population-level assessment.
Implications of laboratory methods for cutoffs.
Using cutoffs without considering the laboratory method implemented to measure the biomarker is problematic. For example, Thacher and Clark (57) demonstrated that a single serum sample assessed as showing adequate vitamin D status in 1 laboratory had inadequate vitamin D status according to another, and the difference between the laboratory measurements was up to 17 μg/L. Unfortunately, many studies published in the literature do not always indicate the type of methods and assays used to measure biomarkers, although many cutoffs are assay-specific. Therefore, caution should be exercised when extrapolating values to biomarker measurements by other assays or when values from different laboratories are compared. Even when the assay methods are sufficiently similar, the method of analysis (such as whether the cells are washed before the assay) affects cutoffs, as in the case of zinc protoporphyrin, 1 of the biomarkers used to detect iron deficiency (53).
The challenges associated with assay-specific cutoffs were highlighted in an NHANES III (1988–1994) analysis in which the population distribution of serum folate was used to determine deficiency cutoffs using a microbiological assay (58). These cutoffs were subsequently applied to continuous NHANES serum folate values measured by immunoassay. Because the microbiological assay measured all folate forms, its ranges were ∼30% higher than the ranges obtained from the immunoassay. When the cutoffs generated through the microbiological assay were applied to the results produced from the immunoassay, the risk of folate inadequacy was exaggerated (58). Calibration equations were therefore applied to the immunoassay-derived values to determine trends of time in the United States before and after the implementation of folic acid fortification.
Another issue that restricts the comparability of data across different studies is the lack of availability of international reference materials for many biomarkers (59). For example, soluble transferrin receptor, a useful biomarker for diagnosing iron deficiency (less affected by inflammation than SF) lacks assay standardization, which limits the ability to compare data across different surveys (60–62). Harmonizing international reference materials and initiating open interactions between laboratories regarding the analysis are needed so that population prevalence of micronutrient deficiency (or excess) can be precisely calculated and compared (18, 63). Finally, a common albeit important challenge is using different cutoff units (15, 64), e.g., a serum folate cutoff of <4 μg/L in 1 study compared with a <10 nmol/L cutoff in another. This issue is rampant in the literature, and manufacturers compound this problem (64).
Biomarkers of vitamin B-12, retinol-binding protein, and vitamin D as exemplars of cutoff challenges
Vitamin B-12 biomarkers.
The inconsistencies in cutoffs for vitamin B-12 biomarkers in the literature can be attributed to a variety of factors, including lack of a gold standard, whether 2 or 3 SDs from a reference range’s mean was used to set the cutoff, and the population from which the distribution was obtained (17, 20, 48). Table 2 demonstrates how different cutoffs can affect the prevalence of B-12 deficiency in an NHANES sample of people aged ≥60 y with normal renal function (48). Depending on the cutoff, the prevalence of vitamin B-12 deficiency was as low as 3% or as high as 26% (65). Similarly, methylmalonic acid cutoffs are quite variable, and the literature reports cutoffs ranging from 210 to 480 nmol/L, sometimes even within the same laboratory methods (20).
TABLE 2.
Prevalence estimates of vitamin B-12 deficiency using different cutoffs for serum vitamin B-12 and MMA
| Cutoffs | Prevalence estimates for vitamin B-12 deficiency, % |
| Serum vitamin B-12, pmol/L | |
| <148 | 2.9 ± 0.2 |
| <200 | 10.6 ± 0.4 |
| <258 | 25.7 ± 0.6 |
| Serum MMA, nmol/L | |
| >376 | 2.3 ± 0.2 |
| >271 | 5.8 ± 0.3 |
The validity of serum vitamin B-12 concentrations as biomarkers of vitamin B-12 status has been questioned for some time (66). Approximately 2.5–5.2% of patients diagnosed with vitamin B-12 deficiency have spurious normal values (>148 pmol/L) (48, 66). However, ∼20–40% of older adults have low levels of serum vitamin B-12 but no clinical or metabolic signs of vitamin B-12 deficiency (48, 66). The mismatch between the serum vitamin B-12 cutoffs and the presence of deficiency or sufficiency complicates the interpretation of vitamin B-12 status data in populations and makes comparison difficult.
Retinol binding protein and serum retinol.
Retinol binding protein (RBP) has several inherent advantages over retinol as a biomarker of vitamin A status. However, RBP is not widely used for assessing vitamin A status at a population level because of a lack of consensus on the RBP cutoff for this purpose (67). Over the years, authors of several studies have proposed cutoffs for RBP that reflect concentrations of <0.70 μmol/L serum retinol and that ranged broadly from 0.69 to 1.29 μmol/L (67). Because the proposed cutoffs diverge greatly, it has not been practical to derive a universally accepted cutoff for RBP that validly and reproducibly reflects a serum retinol concentration of <0.70 μmol/L. Further research is needed to establish a relation between serum retinol concentration and RBP in a wide array of populations to demonstrate its validity and reliability before a universally accepted cutoff for RBP can be proposed (67).
A second challenge is the misclassification bias that results from the inappropriate usage of biomarker cutoffs. A study was conducted to compare the proportion of children aged <5 y that were classified as vitamin A-deficient using 2 different cutoffs in 2 datasets (67). Children were diagnosed as deficient if the values of serum retinol were lower than <0.70 μmol/L or <1.05 μmol/L (67). When the serum retinol cutoff of <1.05 μmol/L was applied to both datasets, vitamin A deficiency prevalence was >50%; however, when a lower cutoff (<0.70 μmol/L) was applied to the same study subjects, only ≤15% were vitamin A-deficient (67).
Vitamin D biomarker.
In addition to the challenges mentioned previously, it is important to consider the functional consequences and policy implications for individuals and for public health overall when deriving cutoffs. At a population level, the cutoffs selected affect prevalence estimates, which may have ramifications for nutrition public policy (7) and decisions about the course of treatment in clinical settings (48). For example, a variety of cutoffs are used for vitamin D (in relation to bone health) that range from 20 to 50 μg/L (68). Many studies have been using higher cutoffs, and when these values are compared with earlier estimates, it artificially inflates the prevalence of vitamin D deficiency in the North American population, possibly resulting in unwarranted clinical interventions (7).
Improving the precision and utility of cutoffs
Cutoffs are developed to provide a dichotomous interpretation of biomarker outcome measures. If conceptualized graphically, cutoffs can be conceived as a step function that explains the relation between a continuous covariate and an outcome where the risk is assumed to be constant up to a certain cutoff, beyond which it abruptly drops or rises to a new level, where again it stays constant (13). In reality, however, this is biologically artificial because the actual risk increases along a continuum as values move further away from optimal levels. Thus, tension exists between keeping the cutoffs practical and simple and capturing the breadth of the information that the biomarker offers (69).
What avenues can be pursued to improve the precision and utility of cutoffs? One option is to use the “gray zone” approach, which entails providing 2 cutoffs that are separated by a gray zone (15). In this method, the first cutoff is chosen to include deficiency with near certainty, and the second cutoff is chosen to exclude deficiency with near certainty (70). When the biomarker values fall into the gray zone (suggesting subclinical deficiency), additional assessment tools can be used to validate the results. This option results in less loss of information and seems to be more useful than the historically used black or white binary outcome (15, 70). Even when multiple cutoffs are used, the rules for choosing them should be determined a priori, clearly defined and justified, and include a 95% CI (15).
The gray zone approach is slowly gaining momentum in other fields (e.g., anesthesiology) and has thus far been shown to be efficient (70). It provides flexibility and better reflects biological systems than the absolute cutoffs. For example, with a binary approach, a cutoff value of 148 pmol/L for serum vitamin B-12 concentration would classify someone with a value of 147 pmol/L as having vitamin B-12 deficiency and someone with 149 pmol/L as having adequate vitamin B-12 status, even if these outputs might simply be a result of random variability. Both of these values would fall into the gray zone when a more flexible cutoff approach is used. Although the gray zone approach does not yield an absolute diagnosis, it flags people for additional analysis to make a more precise diagnosis. This approach uses the precious resources more efficiently than would have been otherwise used to administer an intervention to individuals who did not need it.
Conclusions
Cutoffs provide benchmarks against which clinical- and population-level interventions, surveillance, and surveys are measured. When cutoffs are inconsistent, it questions everything else it measures. Over the years, the WHO has played a lead role in developing and validating population-level cutoffs for many nutritional biomarkers, and US government agencies such as CDC have been partners in these efforts. The Institute of Medicine is another key player in this sphere. Table 3 provides a list of research gaps and priorities for the cutoff agenda specific to nutritional biomarkers. The nutrition community should support these efforts in a unified way and consistently use the cutoffs validated by the WHO and other normative agencies.
TABLE 3.
List of research gaps and priorities for cutoffs pertaining to nutritional biomarkers1
| Harmonize cutoffs for commonly used nutritional biomarkers that have not yet been validated by the WHO (e.g., serum vitamin B-12, 25-hydroxyvitamin D, MMA, RBP). |
| Identify and develop reliable, harmonized assays and accepted reference materials (e.g., assay measurements for sTfR). |
| Examine the use of different micronutrient deficiency cutoffs depending on the different inflammatory states (71). |
| Validate cutoffs derived from cross-sectional studies (e.g., NHANES) with those derived using large prospective studies. |
| Compare statistically derived cutoffs with those developed based on clinical signs of deficiency/excess and substantiate the similarities or differences. |
| Harmonize the use of cutoffs for different age groups, sex, race/ethnicity, life stage such as pregnancy, lactation, and population with diverse genetic endowments. |
| Develop cutoffs for emerging biomarkers [e.g., development of metallothionein in mRNA analyses in lymphocytes as a biomarker of zinc status (72)]. |
| Validate trigger levels for population-based surveys. |
| Conceptualize other methods similar to the gray zone approach to capture continuous biomarker data in a simple yet valid and reliable way. |
MMA, MMA, methylmalonic acid; RBP, retinol-binding protein; sTfR, soluble transferrin receptor.
Huge challenges and opportunities await those involved in the development of reference limits and cutoffs, especially with the advent of new technologies such as lab on a chip, genomics, and proteomics. The field has been progressing rapidly, and more advances are yet to come (42). In this era of rapid change, it is the responsibility of the nutrition community to address the remaining gaps to move the science forward while using the available knowledge to provide guidance for programs and policies today.
Acknowledgments
All authors read and approved the final manuscript.
Footnotes
Abbreviations used: RBP, retinol-binding protein; ROC, receiver operating characteristic; SF, serum ferritin.
References
- 1.Strimbu K, Tavel JA. What are biomarkers? Curr Opin HIV AIDS 2010;5:463–6. [DOI] [PMC free article] [PubMed] [Google Scholar]
- 2.Raiten DJ, Namaste S, Brabin B, Combs G Jr, L’Abbe MR, Wasantwisut E, Darnton-Hill I. Executive summary–biomarkers of nutrition for development: building a consensus. Am J Clin Nutr 2011;94:633S–50S. [DOI] [PMC free article] [PubMed] [Google Scholar]
- 3.Labbé RF, Dewanji A. Iron assessment tests: transferrin receptor vis-a-vis zinc protoporphyrin. Clin Biochem 2004;37:165–74. [DOI] [PubMed] [Google Scholar]
- 4.Schulte PA. The use of biomarkers in surveillance, medical screening, and intervention. Mutat Res 2005;592:155–63. [DOI] [PubMed] [Google Scholar]
- 5.Vasan RS. Biomarkers of cardiovascular disease: molecular basis and practical considerations. Circulation 2006;113:2335–62. [DOI] [PubMed] [Google Scholar]
- 6.Brown KH, Rivera JA, Bhutta Z, Gibson RS, King JC, Lönnerdal B, Ruel MT, Sandtröm B, Wasantwisut E, Hotz C. Assessment of the risk of zinc deficiency in populations and options for its control. Food Nutr Bull 2004;25:S99–203. [PubMed] [Google Scholar]
- 7.Institute of Medicine. Dietary reference intakes for calcium and vitamin D. Washington (DC): National Academies Press; 2010. [PubMed] [Google Scholar]
- 8.Gibson RS. Principles of nutritional assessment. 2nd ed New York: Oxford University Press; 2005. [Google Scholar]
- 9.Klee GG. Clinical interpretation of reference intervals and reference limits. A plea for assay harmonization. Clin Chem Lab Med 2004;42:752–7. [DOI] [PubMed] [Google Scholar]
- 10.Budczies J, Klauschen F, Sinn BV, Gyorffy B, Schmitt WD, Darb-Esfahani S, Denkert C. Cutoff Finder: a comprehensive and straightforward Web application enabling rapid biomarker cutoff optimization. PLoS One 2012;7:e51862. [DOI] [PMC free article] [PubMed] [Google Scholar]
- 11.Stoltzfus RJ. Rethinking anaemia surveillance. Lancet 1997;349:1764–6. [DOI] [PubMed] [Google Scholar]
- 12.Mazumdar M, Glassman JR. Categorizing a prognostic variable: review of methods, code for easy implementation and applications to decision-making about cancer treatments. Stat Med 2000;19:113–32. [DOI] [PubMed] [Google Scholar]
- 13.Williams BA, Mandrekar JN, Mandrekar SJ, Cha SS, Furth AF. Finding optimal cutpoints for continuous covariates with binary and time-to-event outcomes. Rochester (MN): Mayo Clinic; 2006. [Google Scholar]
- 14.Onyango AW. Approaches to developing cut-off points for overweight and obesity in childhood. Int J Pediatr Obes 2008;3(Suppl 2):33–5. [DOI] [PubMed] [Google Scholar]
- 15.Ray P, Le Manach Y, Riou B, Houle TT. Statistical evaluation of a biomarker. Anesthesiology 2010;112:1023–40. [DOI] [PubMed] [Google Scholar]
- 16.Altman DG, Lausen B, Sauerbrei W, Schumacher M. Dangers of using “optimal” cutpoints in the evaluation of prognostic factors. J Natl Cancer Inst 1994;86:829–35. [DOI] [PubMed] [Google Scholar]
- 17.Bailey RL, Carmel R, Green R, Pfeiffer CM, Cogswell ME, Osterloh JD, Sempos CT, Yetley EA. Monitoring of vitamin B-12 nutritional status in the United States by using plasma methylmalonic acid and serum vitamin B-12. Am J Clin Nutr 2011;94:552–61. [DOI] [PMC free article] [PubMed] [Google Scholar]
- 18.de Benoist B. Conclusions of a WHO technical consultation on folate and vitamin B12 deficiencies. Food Nutr Bull 2008;29(2 Suppl):S238–44. [DOI] [PubMed] [Google Scholar]
- 19.Henny J, Petitclerc C, Fuentes-Arderiu X, Petersen PH, Queralto JM, Schiele F, Siest G. Need for revisiting the concept of reference values. Clin Chem Lab Med 2000;38:589–95. [DOI] [PubMed] [Google Scholar]
- 20.Carmel R. Biomarkers of cobalamin (vitamin B-12) status in the epidemiologic setting: a critical overview of context, applications, and performance characteristics of cobalamin, methylmalonic acid, and holotranscobalamin II. Am J Clin Nutr 2011;94:348S–58S. [DOI] [PMC free article] [PubMed] [Google Scholar]
- 21.Søreide K. Receiver-operating characteristic curve analysis in diagnostic, prognostic and predictive biomarker research. J Clin Pathol 2009;62:1–5. [DOI] [PubMed] [Google Scholar]
- 22.Perkins NJ, Schisterman EF. The inconsistency of “optimal” cutpoints obtained using two criteria based on the receiver operating characteristic curve. Am J Epidemiol 2006;163:670–5. [DOI] [PMC free article] [PubMed] [Google Scholar]
- 23.Blanck HM, Bowman BA, Cooper GR, Myers GL, Miller DT. Laboratory issues: use of nutritional biomarkers. J Nutr 2003;133 (Suppl 3):888S–94S. [DOI] [PubMed] [Google Scholar]
- 24.Olivares M, Walter T, Cook JD, Hertrampf E, Pizarro F. Usefulness of serum transferrin receptor and serum ferritin in diagnosis of iron deficiency in infancy. Am J Clin Nutr 2000;72:1191–5. [DOI] [PubMed] [Google Scholar]
- 25.Klotsche J, Ferger D, Pieper L, Rehm J, Wittchen HU. A novel nonparametric approach for estimating cut-offs in continuous risk indicators with application to diabetes epidemiology. BMC Med Res Methodol 2009;9:63. [DOI] [PMC free article] [PubMed] [Google Scholar]
- 26.Fujita M, Brindle E, Rocha A, Shell-Duncan B, Ndemwa P, O’Connor KA. Assessment of the relative dose-response test based on serum retinol-binding protein instead of serum retinol in determining low hepatic vitamin A stores. Am J Clin Nutr 2009;90:217–24. [DOI] [PubMed] [Google Scholar]
- 27.Baker SG. The central role of receiver operating characteristic (ROC) curves in evaluating tests for the early detection of cancer. J Natl Cancer Inst 2003;95:511–5. [DOI] [PubMed] [Google Scholar]
- 28.Schisterman EF, Perkins NJ, Liu A, Bondell H. Optimal cut-point and its corresponding Youden index to discriminate individuals using pooled blood samples. Epidemiology 2005;16:73–81. [DOI] [PubMed] [Google Scholar]
- 29.Schisterman EF, Faraggi D, Reiser B. Adjusting the generalized ROC curves for covariates [Internet] [cited 2013 Jul 1]. Available from: http://stat.haifa.ac.il/~reiser/article/AdjustingROC.pdf. [DOI] [PubMed]
- 30.Choi CW, Cho WR, Park KH, Choi IK, Seo JH, Kim BS, Shin SW, Kim YH, Kim JS, Lee J. The cutoff value of serum ferritin for the diagnosis of iron deficiency in community-residing older persons. Ann Hematol 2005;84:358–61. [DOI] [PubMed] [Google Scholar]
- 31.Phiri KS, Calis JC, Siyasiya A, Bates I, Brabin B, van Hensbroek MB. New cut-off values for ferritin and soluble transferrin receptor for the assessment of iron deficiency in children in a high infection pressure area. J Clin Pathol 2009;62:1103–6. [DOI] [PMC free article] [PubMed] [Google Scholar]
- 32.Perkins NJ, Schisterman EF, Vexler A. ROC curve inference for best linear combination of two biomarkers subject to limits of detection. Biom J 2011;53:464–76. [DOI] [PMC free article] [PubMed] [Google Scholar]
- 33.Ruopp MD, Perkins NJ, Whitcomb BW, Schisterman EF. Youden index and optimal cut-point estimated from observations affected by a lower limit of detection. Biom J 2008;50:419–30. [DOI] [PMC free article] [PubMed] [Google Scholar]
- 34.Perkins NJ, Schisterman EF. The Youden Index and the optimal cut-point corrected for measurement error. Biom J 2005;47:428–41. [DOI] [PubMed] [Google Scholar]
- 35.Vickers AJ, Lilja H. Cutpoints in clinical chemistry: time for fundamental reassessment. Clin Chem 2009;55:15–7. [DOI] [PMC free article] [PubMed] [Google Scholar]
- 36.De Onis M, Blössner M. WHO global database on child growth and malnutrition. Geneva (Switzerland): WHO; 1997. [DOI] [PubMed] [Google Scholar]
- 37.Hoet P, Jacquerye C, Deumer G, Lison D, Haufroid V. Reference values and upper reference limits for 26 trace elements in the urine of adults living in Belgium. Clin Chem Lab Med 2013;51:839–49. [DOI] [PubMed] [Google Scholar]
- 38.de Onis M, Blössner M, Borghi E. Global prevalence and trends of overweight and obesity among preschool children. Am J Clin Nutr 2010;92:1257–64. [DOI] [PubMed] [Google Scholar]
- 39.Rustad P, Felding P, Lahti A. Proposal for guidelines to establish common biological reference intervals in large geographical areas for biochemical quantities measured frequently in serum and plasma. Clin Chem Lab Med 2004;42:783–91. [DOI] [PubMed] [Google Scholar]
- 40.Gräsbeck R. The evolution of the reference value concept. Clin Chem Lab Med 2004;42:692–7. [DOI] [PubMed] [Google Scholar]
- 41.Lahti A, Hyltoft Petersen P, Boyd JC, Fraser CG, Jorgensen N. Objective criteria for partitioning Gaussian-distributed reference values into subgroups. Clin Chem 2002;48:338–52. [PubMed] [Google Scholar]
- 42.Petitclerc C. Normality: the unreachable star? Clin Chem Lab Med 2004;42:698–701. [DOI] [PubMed] [Google Scholar]
- 43.Fraser CG. Inherent biological variation and reference values. Clin Chem Lab Med 2004;42:758–64. [DOI] [PubMed] [Google Scholar]
- 44.Ritchie RF, Palomaki G. Selecting clinically relevant populations for reference intervals. Clin Chem Lab Med 2004;42:702–9. [DOI] [PubMed] [Google Scholar]
- 45.Hsu WC, Araneta MR, Kanaya AM, Chiang JL, Fujimoto W. BMI cut points to identify at-risk Asian Americans for type 2 diabetes screening. Diabetes Care 2015;38:150–8. [DOI] [PMC free article] [PubMed] [Google Scholar]
- 46.WHO. Serum ferritin concentrations for the assessment of iron status and iron deficiency in populations. Geneva (Switzerland): WHO; 2011. [Google Scholar]
- 47.Puntmann VO. How-to guide on biomarkers: biomarker definitions, validation and applications with examples from cardiovascular disease. Postgrad Med J 2009;85:538–45. [DOI] [PubMed] [Google Scholar]
- 48.Yetley EA, Pfeiffer CM, Phinney KW, Bailey RL, Blackmore S, Bock JL, Brody LC, Carmel R, Curtin LR, Durazo-Arvizu RA, et al. . Biomarkers of vitamin B-12 status in NHANES: a roundtable summary. Am J Clin Nutr 2011;94:313S–21S. [DOI] [PMC free article] [PubMed] [Google Scholar]
- 49.Gamble MV, Ramakrishnan R, Palafox NA, Briand K, Berglund L, Blaner WS. Retinol binding protein as a surrogate measure for serum retinol: studies in vitamin A-deficient children from the Republic of the Marshall Islands. Am J Clin Nutr 2001;73:594–601. [DOI] [PubMed] [Google Scholar]
- 50.WHO. Serum and red blood cell folate concentrations for assessing folate status in populations. Geneva (Switzerland): WHO; 2012. [Google Scholar]
- 51.WHO. Folate and vitamin B12 deficiencies: proceedings of a WHO technical consultation held 18–21 October, 2005, in Geneva, Switzerland. Introduction. Food Nutr Bull 2008; 29(2 Suppl):S3–4. [PubMed] [Google Scholar]
- 52.Kant AK, Graubard BI. Ethnicity is an independent correlate of biomarkers of micronutrient intake and status in American adults. J Nutr 2007;137:2456–63. [DOI] [PubMed] [Google Scholar]
- 53.WHO. Assessing the iron status of populations. Geneva (Switzerland): WHO; 2007. [Google Scholar]
- 54.WHO. Serum retinol concentrations for determining the prevalence of vitamin A deficiency in populations. Geneva (Switzerland): WHO; 2011. [Google Scholar]
- 55.Hotz C, Peerson JM, Brown KH. Suggested lower cutoffs of serum zinc concentrations for assessing zinc status: reanalysis of the second National Health and Nutrition Examination Survey data (1976–1980). Am J Clin Nutr 2003;78:756–64. [DOI] [PubMed] [Google Scholar]
- 56.Wang W, Knovich MA, Coffman LG, Torti FM, Torti SV. Serum ferritin: past, present and future. Biochim Biophys Acta 2010;1800:760–9. [DOI] [PMC free article] [PubMed] [Google Scholar]
- 57.Thacher TD, Clarke BL. Vitamin D insufficiency. Mayo Clin Proc 2011;86:50–60. [DOI] [PMC free article] [PubMed] [Google Scholar]
- 58.Pfeiffer CM, Johnson CL, Jain RB, Yetley EA, Picciano MF, Rader JI, Fisher KD, Mulinare J, Osterloh JD. Trends in blood folate and vitamin B-12 concentrations in the United States, 1988 2004. Am J Clin Nutr 2007;86:718–27. [DOI] [PubMed] [Google Scholar]
- 59.McLean E, de Benoist B, Allen LH. Review of the magnitude of folate and vitamin B12 deficiencies worldwide. Food Nutr Bull 2008; 29(2 Suppl):S38–51. [DOI] [PubMed] [Google Scholar]
- 60.Flesland O, Eskelund AK, Flesland AB, Falch D, Solheim BG, Seghatchian J. Transferrin receptor in serum. A new tool in the diagnosis and prevention of iron deficiency in blood donors. Transfus Apher Sci 2004;31:11–6. [DOI] [PubMed] [Google Scholar]
- 61.Raiten DJ, Namaste S, Brabin B. Considerations for the safe and effective use of iron interventions in areas of malaria burden: full technical report. Bethesda (MD): Eunice Kennedy Shriver National Institute of Child Health and Human Development; 2012. [Google Scholar]
- 62.Pfeiffer CM, Cook JD, Mei Z, Cogswell ME, Looker AC, Lacher DA. Evaluation of an automated soluble transferrin receptor (sTfR) assay on the Roche Hitachi analyzer and its comparison to two ELISA assays. Clin Chim Acta 2007;382:112–6. [DOI] [PubMed] [Google Scholar]
- 63.Yetley EA, Pfeiffer CM, Schleicher RL, Phinney KW, Lacher DA, Christakos S, Eckfeldt JH, Fleet JC, Howard G, Hoofnagle AN, et al. . NHANES monitoring of serum 25-hydroxyvitamin D: a roundtable summary. J Nutr 2010;140:2030S–45S. [DOI] [PMC free article] [PubMed] [Google Scholar]
- 64.Thorpe SJ, Heath A, Sharp G, Cook J, Ellis R, Worwood M. A WHO reference reagent for the serum rransferrin receptor (sTfR): international collaborative study to evaluate a recombinant soluble transferrin receptor preparation. Clin Chem Lab Med 2010;48:815–20. [DOI] [PubMed] [Google Scholar]
- 65.Yetley EA, Johnson CL. Folate and vitamin B-12 biomarkers in NHANES: history of their measurement and use. Am J Clin Nutr 2011;94:322S–31S. [DOI] [PMC free article] [PubMed] [Google Scholar]
- 66.Carmel R. Current concepts in cobalamin deficiency. Annu Rev Med 2000;51:357–75. [DOI] [PubMed] [Google Scholar]
- 67.de Pee S, Dary O. Biochemical indicators of vitamin A deficiency: serum retinol and serum retinol binding protein. J Nutr 2002;132(9 Suppl):2895S–901S. [DOI] [PubMed] [Google Scholar]
- 68.Napoli N, Strollo R, Sprini D, Maddaloni E, Rini GB, Carmina E. Serum 25-OH vitamin D in relation to bone mineral density and bone turnover. Int J Endocrinol 2014;2014:487463. [DOI] [PMC free article] [PubMed] [Google Scholar]
- 69.Morrow DA, Cook NR. Determining decision limits for new biomarkers: clinical and statistical considerations. Clin Chem 2011;57:1–3. [DOI] [PubMed] [Google Scholar]
- 70.Cannesson M, Le Manach Y, Hofer CK, Goarin JP, Lehot JJ, Vallet B, Tavernier B. Assessing the diagnostic accuracy of pulse pressure variations for the prediction of fluid responsiveness: a “gray zone” approach. Anesthesiology 2011;115:231–41. [DOI] [PubMed] [Google Scholar]
- 71.Raiten DJ, Sakr Ashour FA, Ross AC, Meydani SN, Dawson HD, Stephensen CB, Brabin BJ, Suchdev PS, van Ommen B, Group IC. Inflammation and Nutritional Science for Programs/Policies and Interpretation of Research Evidence (INSPIRE). J Nutr 2015;145:1039S–108S. [DOI] [PMC free article] [PubMed] [Google Scholar]
- 72.Hambidge M. Biomarkers of trace mineral intake and status. J Nutr 2003;133 (Suppl 3):948S–55S. [DOI] [PubMed] [Google Scholar]