Abstract
Morphogenesis is driven by small cell shape changes that modulate tissue organization. Apical surfaces of proliferating epithelial sheets have been particularly well studied. Currently, it is accepted that a stereotyped distribution of cellular polygons is conserved in proliferating tissues among metazoans. In this work, we challenge these previous findings showing that diverse natural packed tissues have very different polygon distributions. We use Voronoi tessellations as a mathematical framework that predicts this diversity. We demonstrate that Voronoi tessellations and the very different tissues analysed share an overriding restriction: the frequency of polygon types correlates with the distribution of cell areas. By altering the balance of tensions and pressures within the packed tissues using disease, genetic or computer model perturbations, we show that as long as packed cells present a balance of forces within tissue, they will be under a physical constraint that limits its organization. Our discoveries establish a new framework to understand tissue architecture in development and disease.
Keywords: epithelial organization, morphogenesis, neuromuscular diseases, Voronoi diagrams
Subject Categories: Development & Differentiation
Introduction
Natural patterns such as fractals, spirals or tessellations have intrigued mathematicians and biologists for decades (Haeckel, 1904; Stevens, 1974). These evolutionary conserved structures emerge from the physical properties of the soft living matter. During development, cell shape is modulated to drive the essential process of tissue and organ morphogenesis. Geometrical concepts have been widely applied as an approach to understand the basis of tissue architecture and remodelling (Honda, 1978; Chichilnisky, 1986; Rivier et al, 1995; Hayashi & Carthew, 2004; Classen et al, 2005). A clear example is the stereotyped polygon distribution found in very diverse arrangements of cells among metazoans. Apical surfaces of proliferating epithelial sheets have been particularly well studied. From the early analysis of Lewis using the cucumber epidermis to the Drosophila wing disc, numerous works have tried to understand the particular arrangement of polygonal cells (Lewis, 1928; Korn & Spalding, 1973; Gibson et al, 2006; Gibson & Gibson, 2009). Currently, it is accepted that the conserved distribution of cellular side numbers (polygons) that is observed in many proliferating tissues is a mathematical consequence of cell divisions via a probabilistic Markov chain (Axelrod, 2006; Gibson et al, 2006) in conjunction with cell rearrangements (Zallen & Zallen, 2004; Classen et al, 2005; Aegerter‐Wilmsen et al, 2010). In this work, we challenge this assumption by analysing a series of natural and artificial patterns to demonstrate that the conserved polygon distribution does not necessarily require cell proliferation mechanisms.
Voronoi diagrams fill the plane or space forming convex polygons (called Voronoi cells) that do not overlap (Voronoi, 1908). Each Voronoi cell emerges from a seed and is characterized by the feature that all the points belonging to the cell are closer to its corresponding seed than to any other seed. In nature, it is easy to find tissues that resemble the organization of Voronoi diagrams, hence their occasional use to analyse natural patterns (Honda, 1978; Zhu et al, 2001; Gibson & Gibson, 2009; Hocevar et al, 2010).
Here, we describe how Voronoi diagrams are able to predict the diverse polygon distributions of any natural packed tissue. Our data indicate that as long as packed cells present a balance of forces within tissue, they will be under a physical con‐straint that limits its organization. We uncover a primary level of cell arrangement regulation that correlates with the tissue homogeneity.
Results and Discussion
Natural packed tissues present diverse polygon distributions
It has been described that proliferating epithelia across metazoan have a “conserved polygon distribution” that emerge, at least in part, from cell division mechanisms or growth rates of these tissues (Gibson et al, 2006; Nagpal et al, 2008; Patel et al, 2009; Aegerter‐Wilmsen et al, 2010). We have also confirmed this with our own images from proliferating Drosophila prepupal wing discs (dWP, (Sanchez‐Gutierrez et al, 2013)) (Fig 1A and E, and Table EV1). Aiming to understand the general mechanisms of tissue packing, we studied the organization of a non‐proliferative tissue that also presented packed cells: the muscle fibres (Wigmore & Dunglison, 1998). Images from sections of normal human adult biceps (BCA, Fig 1B and C) were analysed. Interestingly, the same stereotyped polygon distribution emerged (Fig 1E). We then analysed other proliferating epithelia. The chicken neuroepithelium (cNT) (Frade, 2002; Wilcock et al, 2007) presented a very different cellular organization when compared to other analysed tissues: cells with small and large apical surfaces were mixed resulting in a very heterogeneous tissue (Fig 1D). cNT polygon distribution looked very different to the stereotyped distribution found in other proliferative epithelia, with a clear decrease in the number of hexagons (falling to the 28.3%) and a high increase in the number of four‐ and eight‐sided cells (Fig 1E). These results challenge the concept of a conserved organization for all the proliferating tissues based on proliferative mechanisms.
Figure 1. Polygon distribution of biological tissues compared with Voronoi diagrams.
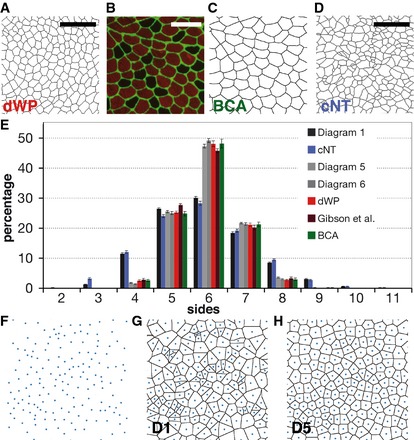
- Segmentation of a Drosophila prepupal wing imaginal disc epithelium (dWP).
- Biceps control adult (BCA) biopsy stained with anti‐collagen VI (green) and anti‐myosin heavy chain (red) antibodies.
- Segmentation of the image showed in (B).
- Segmented image from a chicken embryo neural tube epithelium (cNT).
- Polygon distribution of the different biological tissues analysed. Two types of distribution can be distinguished: the Poisson‐Voronoi polygon distribution for Diagram 1 (D1) and cNT, and the conserved polygon distribution for the rest of image categories. Data are represented as mean ± SEM. Diagrams 1, 5 and 6: 20 replicates. cNT: 16 replicates. dWP: 16 replicates. Gibson et al.: 12 replicates. BCA: 29 replicates.
- Diagram with Voronoi seed distributed randomly in the plane.
- Poisson‐Voronoi tessellation of the seed showed in (F).
- Resulting Voronoi diagram after performing four Lloyd's algorithm iterations to the Diagram 1 (Diagram 5, D5).
Voronoi tessellations share organization principles with natural packed tissues
We have chosen Voronoi tessellations to explore the emergence of diverse organizations in packed tissues. It has been described that a random distribution of seeds in the Euclidean plane produces a Poisson–Voronoi diagram with a fixed polygon distribution that is independent of the number of starting seeds (Miles & Maillardet, 1982). We have reproduced these results (Fig 1F and G) and also obtained histograms enriched in hexagons (29.5%), pentagons (25.9%) and heptagons (19.9%), among other polygons (Fig 1E Diagram 1 and Table EV1). Voronoi diagrams can be homogenized by applying Lloyd's algorithm on them (Lloyd, 1982; Du et al, 1999). This process identifies the centroids of the Voronoi cells and uses them as the seed to perform a new Voronoi tessellation producing a “relaxation” of the diagram. This makes them more homogeneous in terms of the shapes and sizes of the cells (Fig 1H). The iterative application of Lloyd's algorithm approximates the image to an optimal centroidal Voronoi tessellation (CVT) (Lloyd, 1982; Du et al, 1999), where the seed of each Voronoi cell is its centroid. Starting from Poisson–Voronoi diagrams, we obtained the polygon distribution of 50 iterations (Fig 2A and Table EV1). The histograms changed rapidly after the first iterations, increasing the number of hexagons and heptagons. After 50 iterations, the histograms were stabilized showing 70% of hexagons (similar results were obtained with 200 iterations Fig EV1A). The combination of these diagrams and distributions forms what we will call a “CVT path”. Interestingly, we observed that diagrams 5 and 6 of the CVT path presented “the conserved distribution” (Fig 1E). Obviously, these artificial Voronoi diagrams were obtained without invoking any cell division mechanisms. The results obtained with muscle and Voronoi samples suggested that the conserved polygon distribution could in principle arise through more general physical constraints.
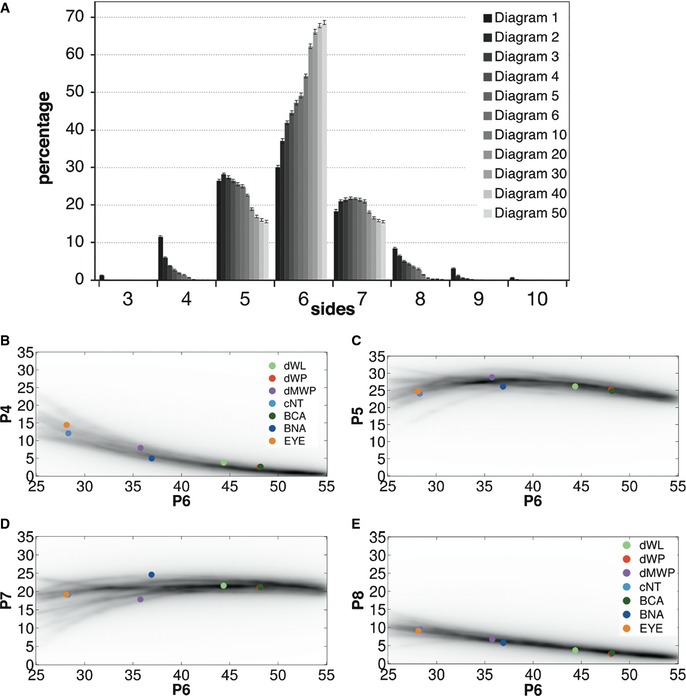
Figure 2. The CVT path matches the polygon distribution of natural tissues.
-
APolygon distribution Voronoi diagrams resulting from the iterative application of Lloyd's algorithm. Data are represented as mean ± SEM. All diagrams: 20 replicates.
-
B–EDensity plot showing the frequency of a value for four‐, five‐, seven‐ and eight‐sided cells, respectively, depending of the percentage of hexagons (P6) in the CVT diagrams. The darker region reflects the higher probability of a determined value. Coloured circles represent the average values of each polygon class for the different sets of images analysed in this study. dWL, Drosophila larva wing disc, light green. dMWP, Drosophila mutant wing disc, violet. EYE, Drosophila eye disc, orange. BCA, biceps control adult, dark green. BNA, biceps neurogenic atrophy, dark blue.
Figure EV1. Polygon distribution for CVT diagrams from 1 to 200, dWL and Volvox images.
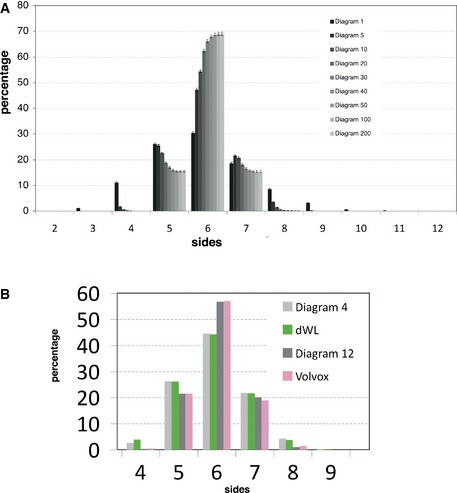
- Comparison of the different polygon distributions along the CVT path. The number of hexagons never reached more than 70% of the total number of cells. Data are represented as mean ± SEM. All diagrams: 20 replicates.
- Volvox is a green alga that forms spherical colonies. We compared the data obtained from Korn and Spalding (1973) with the different CVT diagrams. The Volvox polygon distribution was very similar to a Voronoi Diagram 12. Drosophila larva wing disc epithelium (dWL) polygon distribution was very similar to the one for Diagram 4.
Further analysis of the ensemble of Voronoi diagrams provided other surprising results. First, the cNT polygon distribution looked similar to the distribution obtained by the random Voronoi Diagram 1 (Fig 1E). Also, the actively proliferating third instar wing disc (dWL, (Sanchez‐Gutierrez et al, 2013)) showed that its polygon distribution was similar to a Diagram 4 (Fig EV1B). Another example of a proliferating tissue that does not have the conserved polygon distribution is the Volvox, a green alga that forms spherical colonies that presented a very high proportion of hexagons (Korn & Spalding, 1973) and a polygon distribution similar to a Voronoi Diagram 12 (Fig EV1B). Taken together, these results suggest that alternative mechanisms in addition to cell proliferation may explain the emergence of stereotyped polygon distributions. Importantly, we have found a more general phenomenon: the natural tessellations analysed in this and other works (Lewis, 1928; Korn & Spalding, 1973; Gibson et al, 2006; Aegerter‐Wilmsen et al, 2010; Sanchez‐Gutierrez et al, 2013) appeared qualitatively similar to the distributions produced by one of the diagrams of the “CVT path” (Figs 1E and EV1B), suggesting that natural packed tissues cannot present infinite organizations but are constrained to certain combinations of polygon distributions.
We have compared these polygon distributions by using chi‐squared tests (Table EV2 and Material and Methods). There were no significant differences between BCA vs D5 or D6, dWP vs D5 (dWP vs D6 being in the border of significance) and dWL vs D4. However, we found that the chi‐squared test was able to find differences between cNT and D1. We reasoned that this reflected a difference in the position of cNT and D1 tessellations along the CVT path. The succession of Voronoi diagrams is discrete. The Voronoi diagrams are very different in the first steps of the Lloyd iteration (D1, D2…) and become progressively more similar (D5, D6…). cNT could be different to D1 and still match the CVT path. This indicated to us that the direct comparisons between Voronoi diagrams and natural images were not sufficient to address whether a tissue is organized like the CVT path.
In order to solve this problem, we have designed a general method to quantify the similarity between the natural images and the CVT path. For each Voronoi diagram, the value of the number of hexagons has a corresponding value for each of the other polygon types. We used this property to transform the different steps of the CVT path into a continuous function. In this way, we could calculate how the percentage of four‐, five‐, seven‐ or eight‐sided cells was changing with respect to the percentage of hexagons and convert these data into a probability cloud that facilitates the visualization of the similarity between Voronoi and natural tessellations (Fig 2B–E and Materials and Methods). More importantly, this allowed us to quantitatively compare the different natural images with any part of the CVT path. We confirmed that cNT, dWL, dWP and BCA images largely behaved as predicted by the continuous CVT path using appropriate tests to compare its polygon frequencies (with some small variations in the less frequent polygons, Materials and Methods and Table EV2). Therefore, the CVT path serves as an objective scale to compare the organization of any packed tissue at the level of their polygon distribution.
The distribution of cell sizes correlates with the frequency of polygon types in the packed tissues
We have found a range of polygon distributions in natural tessellations that are described by the CVT. We wondered what was the origin of this variety of arrangements. Both the different tissues analysed and the Voronoi diagrams share some similarities: their cells were similar to convex polygons that cover the plane without overlapping or leaving empty spaces. These packed polygonal cell layers have been studied from several angles and it is known that they are restrained to several generalizations: (i) Euler's theorem: taking a tissue with a large number of cells, the average number of neighbours of a cell will be six. (ii) The Lewis' law states that the average area (A n) of an n‐sided cell increases linearly with n (so, small cells tend to have less sides). (iii) Aboav–Weaire Law asserts that cells with a higher number of sides tend to have few‐sided neighbours and vice versa. Direct or indirectly, these laws imply a relationship between the number of cells, the total space that they fill and the distribution of neighbours. Therefore, we analysed the cell area distribution of the different Voronoi diagrams (Fig 3A). The area distribution of Diagram 1 was clearly left‐skewed as a result of the large number of small cells present in these images. The area distributions for the successive diagrams showed a higher degree of symmetry and a narrower base, as expected from the increase of homogeneity of their cells.
Figure 3. Relationship between area and polygon distribution.
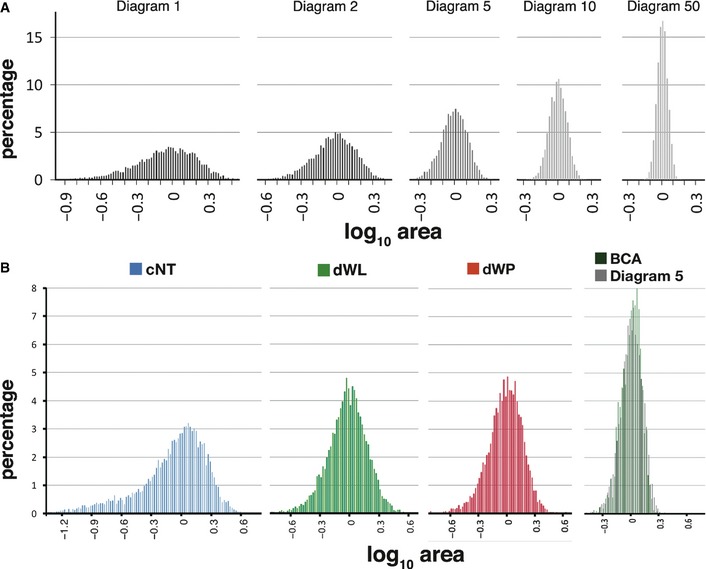
- Area distribution of several Voronoi diagrams along the CVT path. Cell areas became progressively more homogeneous after each Lloyd iteration.
- Comparison of area distribution for proliferating epithelia cNT (blue), dWL (green) and dWP (red). At the right of the image biceps (green) and Diagram 5 (grey) images.
All the natural tissues analysed in this work largely comply with the three laws described above (Fig EV2 and Table EV3). Therefore, we also found the same relationship between the area distribution and the polygon distribution in the proliferating tissues. cNT presented a large tail due to the high number of cells with small apical surfaces present in this tissue (Fig 3B and Table EV4). On the other hand, dWL and dWP showed a more symmetric distribution due to the increase in cell size homogeneity. In the case of the non‐proliferating muscle tissue, we observed that BCA showed the same area distribution as Diagram 5 (Fig 3B and Table EV4). These qualitative comparisons were confirmed using Kolmogorov–Smirnov tests to compare the area distribution of these tessellations (Table EV4). This could be reflecting the absence of cell size variance induced by proliferation (discussed below).
Figure EV2. Analysed packed tissues largely hold to several geometrical laws.
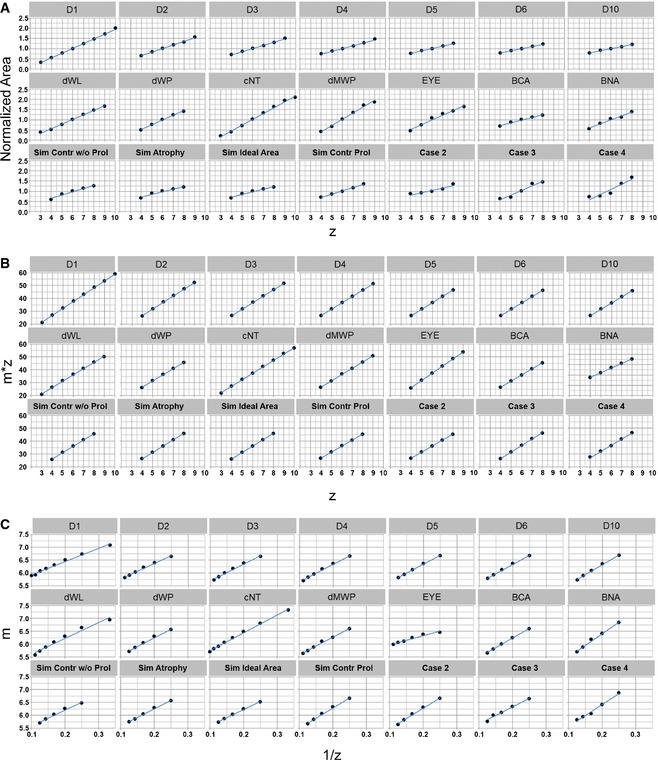
- Lewis' law. All samples show a linear relationship between cell area and the number of cell sides (z). Each solid point represents an average of cell areas across all samples. Blue lines show a linear fit to the data.
- Aboav–Weaire law. All samples show a linear relationship between the number of cell sides (z) and the product of this quantity with the average number of sides of a cell's neighbour (m). This demonstrates that all samples follow the predicted trend.
- To see whether there are any minor deviations from the Aboav–Weaire law, we plotted the inverse of the number of cell sides (1/z) against m. The slight curvature in the profiles demonstrates that there is in fact a minor deviation for most samples, which is consistent with previous studies of random Voronoi tessellations (Hilhorst, 2006).
Data information: In both (A) and (B), solid points represent averaged quantities across all samples, while blue lines show a linear fit to the data.
The large number of small cells appearing in cNT or Diagram 1 will directly increase the number of few‐sided cells (Lewis' law), but indirectly will also give sides to the larger cells (Aboav–Weaire law). The increase on the homogeneity of the cell sizes correlates with a higher number of hexagons, pentagons and heptagons. This explains the “conserved polygon distribution” previously published where tissues analysed were very homogeneous (Gibson et al, 2006). However, these authors missed other natural tissues presenting diverse arrangements such as cNT. In summary, our results support the existence of a constraint that affects any natural tessellation of convex polygons and that correlates the shape of the cell area distributions with the frequency of polygon types.
Physical constraints in packed tissues
We were intrigued by why the CVT path was able to predict the different types of polygon distributions found in natural tissues. Our hypothesis was that the geometrical Voronoi tessellations were reflecting some of the physical cellular properties of the epithelial cells (Farhadifar et al, 2007). Voronoi cells emerge from their seeds that “push” towards each other with equal “force” until they meet in the middle to form the Voronoi cell boundary. One possibility is that the cells share this homogeneity of forces as this dictates the packing order. To test this, we first analysed a tissue where contractile and adhesion forces are clearly asymmetrical, the Drosophila eye disc (EYE) (Brown et al, 2006; Mirkovic & Mlodzik, 2006; Escudero et al, 2007) (Fig 4A). During eye development, the photoreceptors form clusters with small apical areas and are surrounded by 4 larger cone cells. We analysed the polygon distribution of these local structures and found that they did not follow a CVT path arrangement. The photoreceptors and cone cells were enriched in four‐, eight‐ and nine‐sided cells, and presented a low percentage of hexagons (Table EV1). However, when the EYE tissue was analysed taking in account all the cells, the frequency of polygon types was close to Diagram 1 (Fig 4E). Accordingly, the area distribution presented a high variance and was left‐skewed, this time in the form of a bimodal distribution of small and large cells (Fig EV3A and Table EV4). Although there is a clear asymmetrical organization in this tissue, the polygon distribution was maintained in the limits of the CVT path (Fig 2B–E). These results suggest that physiological balanced changes in contractility and/or adhesion were increasing the levels of cell area heterogeneity, tuning but still maintaining the tissue along the CVT path.
Figure 4. Polygon and area distribution of altered tissues.
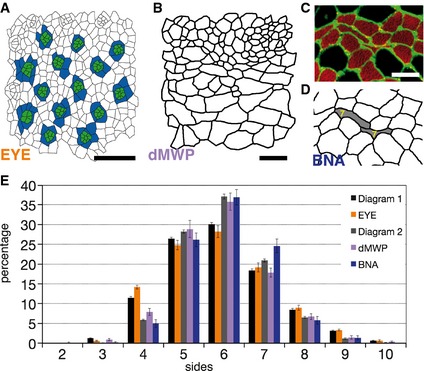
- Segmentation of a prepupal eye imaginal disc from Drosophila (anterior to the left). The analysed developing photoreceptors are labelled in green. The cells adjacent to the photoreceptors are labelled in blue (these are “cone cells” in the most posterior clusters).
- Segmentation of a prepupal wing imaginal disc epithelium where myosin II levels have been reduced.
- Adult biceps biopsy from a patient with neurogenic atrophy pathology. Fibres outlined with collagen VI antibody (green).
- Segmentation of the image showed in (C) highlighting two atrophic elongated fibres that present seven neighbours.
- Comparison of polygon distributions of different tissues with altered contractibility, tension or pressure balance within the tissue. Data are represented as mean ± SEM. Diagram 1 and 2: 20 replicates. EYE: 3 replicates. dMWP: 10 replicates. BNA: 12 replicates.
Figure EV3. Comparison of area distribution of diverse natural tissues.

- Comparison of the area distribution of Diagram 1 and EYE. The eye presents a left‐skewed bimodal distribution of areas.
- Comparison of the area distribution of dWP and dMWP. The mutant wing presents a more irregular frequency of sizes and slight left skewness.
- Comparison of the area distribution of BCA and BNA. The high number of small atrophic fibres characteristic of neurogenic atrophies produces a left‐skewed distribution shape in the case of BNA.
We then studied the effect of non‐physiological alterations of cell biophysical properties, either genetically or pathologically. Myosin II is a contractile molecule responsible for the architecture of epithelial cells (Pilot & Lecuit, 2005). Its deregulation alters the cortical contraction and adhesion of primarily the apical domain of epithelial cells, as well as their cytokinesis (Young et al, 1993; Escudero et al, 2007). We analysed the consequences of a relatively mild and heterogeneous reduction of myosin II heavy chain (Zipper) in the Drosophila wing epithelium. This was done using the C765‐Gal4 line driving the expression of UAS‐zipper‐RNAi (Escudero et al, 2011). The resulting epithelia (dMWP) presented cells with different degrees of enlarged apical profiles (Fig 4B). This heterogeneity in myosin II reduction was also the cause of the high diversity between the different samples analysed. Compared to the wild‐type wing, dMWP had a more irregular cell area distribution, with a higher variance, and was moderately left‐skewed (Fig EV3B and Table EV4). This change in the cell area distribution was associated with a change in polygon frequency (Fig 4E), further emphasizing the correlation between area and polygon distributions. We then checked whether the dMWP polygon distribution was behaving like the CVT path diagrams. In this case, we observed a small deviation of the number of heptagons: dMWP presented a lower percentage of seven‐sided cells compared with the CVT diagrams (Fig 2D and Table EV2).
In parallel, we analysed another tissue where the cellular biophysical properties were clearly non‐physiological. Neurogenic atrophy is a large family of neuromuscular diseases that affect motor neurons or peripheral nerves. A particular characteristic of these pathologies is the scattered appearance of atrophic fibres that are smaller and elongated (Fig 4C and D). This is a consequence of the healthy fibres compressing the atrophic fibres that are degenerating (Mastaglia, 1992; Brazis, 2011; Finsterer et al, 2011). Accordingly, the histogram of cell area distribution showed an increase of small cells compared with BCA images (Fig EV3C and Table EV4). Although the resulting polygon distribution was close to Diagram 2, it had an outstanding difference—an unusual increase of heptagons, resulting in its lack of compliance with the CVT path (Fig 2D and Table EV2). In this case, the chi‐square comparison was not able to differentiate these two distributions (Table EV2) indicating that our method was more sensitive in finding deviations in a particular polygon's frequency.
Taking together all the area distributions from the different natural packed tissues analysed, we have not been able to find a general rule that relates area and polygon distribution. Different area distributions can appear with similar polygon distributions. This is the case of dWP and D5, or cNT, EYE and D1 (Figs 1 and EV3, and Table EV4). This can be due to the very different tissues (and diagrams) that we are comparing. For example, in the actively proliferating tissues (dWL, dWP, cNT, dMWP), the area distributions are greatly influenced by the cell division process: cells grow during a determined time and then divide reducing the size by half, increasing the range of areas. One possibility could be that the cell rearrangements that take place in these epithelia facilitates that the tissue reaches a polygon distribution similar to Voronoi diagrams with narrower area distributions. What we have been able to consistently observe is that the increase of smaller cells in any way (as in D1, cNT, with a left‐skewed distribution or EYE with a bimodal distribution; Figs 3 and EV3) correlates with a decrease of hexagons and increase of three‐, four‐, eight‐, nine‐ and ten‐sided cells following the CVT.
Homogeneity of cellular resting volume constrains natural tessellations within CVT path
We have found two conditions where the tissues deviate from the polygon distributions described by the CVT path. The detailed analysis of these two exceptions (dMWP and BNA) could be key to understanding the general phenomena that makes the Voronoi diagrams to reproduce very different tissue patterns.
Biological tissues do not emerge from seeds, but analogously from cells that grow until a determined resting volume. This gives the cells an internal cell pressure that causes them to push against each other, forming a packed tissue of convex cells. We hypothesize that in the two non‐physiological conditions that we examined, the original balance of cell resting volumes is compromised. In the case of the reduction of myosin II, some cells could continue growing without performing cytokinesis, thus giving them a greater resting volume. In the case of atrophic fibres, the degeneration process could reduce their resting volume, and therefore, they are deformed by the adjacent normal fibres.
As it is currently technically very challenging to measure the internal pressure or the resting volume of cells in in vivo tissues, we have employed a classical “loss of function” approach, but in silico. We have used computer simulations to analyse the arrangement of cells with altered resting area inside the tissue. To do this, we performed two types of analysis using a vertex model (Farhadifar et al, 2007; Mao et al, 2011) trying to simulate dMWP and BNA tissues.
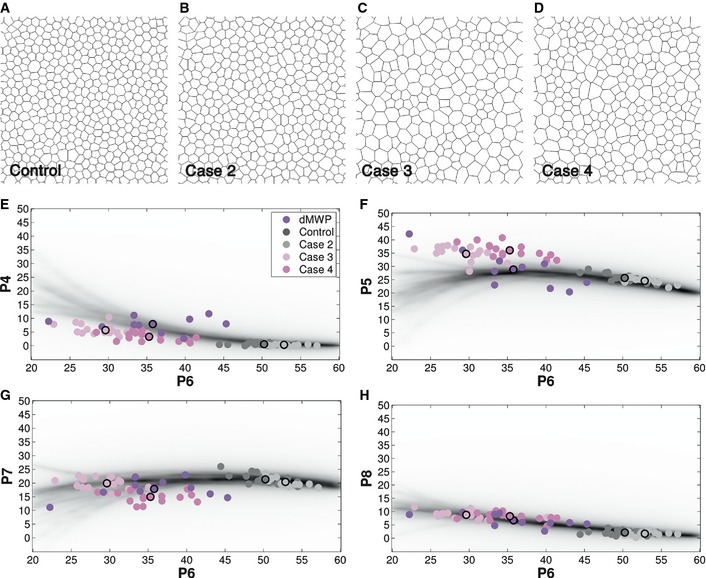
We attempted to simulate the complex biophysical events occurring in a proliferating tissue mutant for myosin II. As cells enter the mitotic phase, they increase their ideal area and grow to twice their original area before dividing into two cells, thus driving the growth of the whole tissue (for details, see Materials and Methods, control, Fig 5A and E–H). First, to simulate the loss of cortical tension that occurs in the mutant tissue, we randomly assigned a reduced tension parameter to each cell from the uniform distribution. However, this did not change the arrangement of the tissue (case 2, Fig 5B and E–H). Second, we added an additional condition that cells must have a minimum tension threshold in order to divide (Materials and Methods). If the cells do not reach this threshold, they continue to grow in size, without being able to divide the cell body. A cell without the ability to divide will be stuck in mitotic phase and will not start a second round of cell division. Therefore, it will have a higher value for its ideal area. We screened several values of thresholds in an attempt to simulate the dMWP data. Similarly to the case of the myosin II mutant tissue where the images were very variable, the results obtained with each individual simulation (realization) were very diverse. We analysed in more detail the simulations with a threshold value of 30 and 40 percentage of control tension (case 3, Fig 5C and case 4, Fig 5D, respectively) to allow cell division since it was able to reproduce the wide range of average numbers of hexagons found in dMWP. In each case, there was a mix of images close to the CVT path with images deviating in different directions (Fig 5E–H and Table EV1, violet: 10 dMWP images, light pink: 17 realizations for case 3, dark pink: 15 realizations for case 4). In summary, the alteration of the ideal resting area was critical to produce the diversity of results and the deviation from the CVT prediction. This broke the original balance of forces in the tissue in different manners, allowing the tissue to adopt different topologies. The fact that altering line tension alone was insufficient to alter the cell packing patterns from the CVT path (Fig 5B) suggests that the resting volume of the cells is the main factor responsible for the rupture from the CVT path.
Figure 5. Biophysical alterations in proliferating tissues using computer simulations.
-
ADiagram resulting from a vertex model simulation that includes cell proliferation.
-
BDiagram resulting from a vertex model simulation that includes cell proliferation and heterogeneous reduction of line tension among the tissue cells.
-
CDiagram resulting from a vertex model simulation with heterogeneous reduction of line tension and an impairment of the cell division when tension value is under the 30 percentage of the initial value.
-
DSimilar simulation than in (C) with a threshold of 40 percentage.
-
E–HDensity plot showing the frequency of a value for four‐, five‐, seven‐ and eight‐sided cells, respectively, depending of the percentage of hexagons (P6) in the CVT diagrams. The values for the individual myosin mutant images (violet) and the individual diagrams of the four simulations (light grey, grey, light pink and pink) are shown in each plot. The average value for each simulation is shown with a black circumference.
Aiming to clarify the importance of the resting volume of cells in the packing of tissues, we tried to simulate the atrophic muscle tissue. In this case, our “loss of function” approach consisted in comparing a control simulation where all the cells have the same ideal resting area (Fig 6A) with the effect of having lower ideal area in certain cells (Fig 6B, we also increased the effective cell–cell adhesion to prevent the cells from delaminating; see Materials and Methods for details). This autonomously created small elongated (highly anisotropic) cells that also presented an abnormally high number of neighbours (Fig 6D) in comparison with the small cells of the control tissue (BCA) and control simulations (control simulation) that had the expected low number of neighbours (Figs 6D and EV4, and Table EV5). Our analysis demonstrated that this was due to a higher proportion of seven‐sided cells among the small atrophic fibres (Fig 6D, BNA sick, Fig EV4 and Table EV5). When analysing these elongated cells separately, we observed that they were breaking a fundamental constraint: The direct relationship (linear or not) that larger cells should have more sides and vice versa. In this tissue, many of the smaller cells were having an abnormally high number of neighbours, which was altering the polygon distribution of the whole tissue.
Figure 6. Computer simulations indicate that changes to homogeneous resting areas are able to alter cell topology.
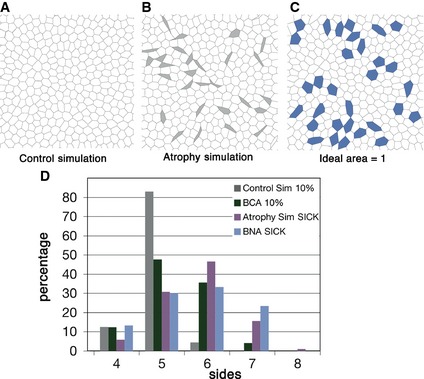
- Diagram resulting from a vertex model simulation with homogeneous parameters for contractility, line tension and ideal area.
- Diagram resulting from a vertex model simulation where in ten percentage of the cells (grey), the line tension and ideal area parameters were reduced.
- Control diagram where in the ten percentage of the cells (blue) only line tension parameter was reduced.
- Comparison of polygon distribution for the 10% smallest cells from BCA (green bar) and control simulation (grey bar) with the sick cells from BNA (light blue bar) and atrophy simulation (grey cells from (B), purple bar).
Figure EV4. Polygon distribution of different subset of cells from muscle samples and simulations.
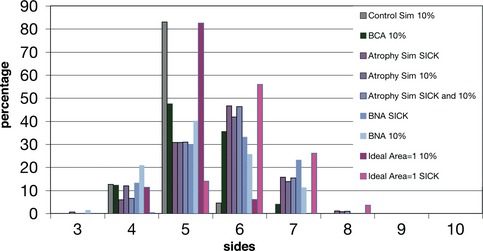
Comparison of the polygon distribution of different subsets of cells: the atrophic cells of the BNA images (see Materials and Methods), the 10% of the smallest cells from BCA and the three simulations, and the selected “sick” cells with different parameter values from the atrophy simulation and ideal area = 1 simulation (see Materials and Methods). “control simulation 10%”, “ideal area = 1 simulation 10%”, “BCA 10%”, “BNA 10%” and “atrophy simulation 10%” presented a higher percentage of pentagons than hexagons. On the other hand, when analysing the “atrophic cells” from “BNA sick” and “atrophy simulation sick,” an increase of hexagons and heptagons was observed. “Atrophy simulation sick”, “atrophy simulation 10%” and “atrophy simulation sick and 10%” presented a similar polygon distribution since in this simulation most of the sick cells are included in the 10% smaller cells (Table EV2). The small difference between “BNA 10%” and “BNA sick” reflected the presence of small rounded cells inside the smaller 10% of BNA cells. The polygon distribution of the “ideal area = 1 sick” cells was due to the higher area presented by this subset of cells that gives them higher number of neighbours (Fig 6C and Table EV2).
Conclusions
In summary, our results suggest that natural packed tissues cannot freely arrange into infinite organizations. Instead, they are limited to certain topologies that we have been able to define by comparing them with the Voronoi tessellations. CVT does not reflect the dynamic evolution of tissues during development, but it is able to reproduce stationary states. Our results imply that this is due to a physical constraint induced by the normal physiological balance of forces between cells or fibres. The Voronoi diagrams and natural tessellations analysed in this work share this restriction; therefore, we suggest the CVT path could present a physical frame that packed tissues under physiological conditions would convey to. In non‐physiological conditions, such as in disease, this original balance of forces between the cell's ideal resting volume and cortical tension is broken, which drive tissues to deviate from the CVT path. Cell shape anisotropies, which can affect the correlation between the area and the number of sides of a cell (Kim et al, 2014), can be one factor that breaks the original physical constraints. The muscle atrophic tissue together with the in silico LOF experiments suggests that a cell's resting volume, which creates an internal cell pressure, is the main biophysical component that sets the original physical constraints for the packing of a tissue. Any pathological deviations from a cell's physiological resting volume will break this constraint and create new tissue packing geometries away from the CVT path.
An important avenue for future research would be to test whether the CVT path holds true for other tissues, especially differentiating tissues, and whether deviations from the CVT diagrams can indeed be diagnostic for non‐physiological cell types. This could represent a novel imaging method for early detection of the emergence of disease onsets.
Materials and Methods
Generation of Voronoi diagrams
Voronoi diagram is a geometrical way of dividing space into a number of regions or cells. A set of “n” seeds was specified in a plane ((x 1, y 1), (x 2, y 2)… (x n, y n)). From each seed (x n, y n), a corresponding Voronoi cell (Cell k) was formed containing all pixels closer to that seed than to any other. Therefore, a pixel (a, b) belonged to a Voronoi cell (Cell k) when distance to point (x k, y k) was less or equal than its Euclidean distance to any other seed.
| (1) |
For the analysis of the relaxation of the Voronoi diagrams (Lloyd's algorithm), the centroid (c k) of each Voronoi cell (Cell k) was calculated and used as the seed (x k, y k) of the new diagram. This makes them more homogeneous in terms of the shapes and sizes of the cells (Fig 1H). Subsequent iterations of this process produced a set of Voronoi diagrams that form a CVT path.
In our experiments, we used 500 random points in image of 1,024 × 1,024 pixels and performed Voronoi diagram (Diagram 1 or Poisson‐Voronoi tessellation). We used 20 different initiations (Poisson–Voronoi initial images) to obtain the CVT path data.
Image analysis
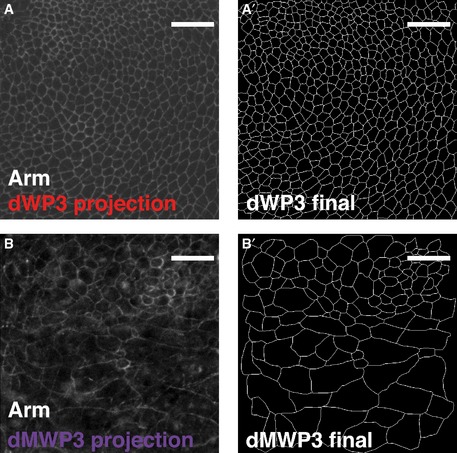
Drosophila and chicken images were described in Escudero et al (2011). The images used in the study were as follows: 15 images from Drosophila wing larva (dWL), 16 images from Drosophila prepupal wing (dWP), 10 images from Drosophila mutant wing prepupa (dMWP, using the following genetic combination: C765‐Gal4 line driving the expression of UAS‐zipper‐RNAi; this induces a reduction of myosin II expression in the wing disc epithelium), 16 images from chick neuroepithelium (cNT). 3 images from Drosophila prepupal eye (EYE, obtained as described in Escudero et al, 2007) were segmented manually. Fig EV5 shows two examples of the projection of the original confocal image that was used for the segmentation of the natural images. The examples correspond to Fig 1A (Fig EV5A) and Fig 4B (Fig EV5B). All the analysed images had a size of 1,024 × 1,024 pixels. The area of 1 pixel in these cases is 3.78 × 10⁻³ μm2. We have identified the neighbours of each cell using a circle with radius r = 4 pixels.
Figure EV5. Original images processed to obtain segmented data.
-
AProjection of the original confocal stack used to segment dWP3 sample.
-
A'dWP3 final segmented image.
-
BProjection of the original confocal stack used to segment dWP3 sample. Some confocal sections included signal from the peripodial membrane of the wing imaginal disc. Therefore, part of the processing was manual.
-
B'dMWP3 segmented final image. The signal from the peripodial membrane has been removed.
Data information: Scale bars: 10 μm.
In the case of human muscle biopsies, we obtained a ROI with resolution 1,100 × 1,100 pixels from images of 3,072 × 4,080 pixels. In this way, it is possible to avoid small artefacts due to the manipulation and staining of the samples. The images were segmented following the method developed in Sáez et al (2013). We used 29 images (taken from 12 different biopsies) for biceps control adult (BCA) and 12 images taken from 6 biopsies for the biceps neurogenic atrophies adult (BNA). The Hospital Virgen del Rocío ethics commission gave approval for this work (File 2/11). All biopsies were performed under informed consent using a standardized protocol (Dubowitz & Sewry, 2007) and processed as described in Sáez et al (2013).
Continuous model of CVT path and probability density cloud
We had a discrete number of diagrams that form the CVT path (diagrams 1–200). We transformed them into a continuous model to be able to compare it with the natural images. To do that, we took the percentage of hexagons as a reference of the organization of the tessellations. The Voronoi diagrams forming the CVT path present a percentage of hexagons that corresponds univocally with a determined percentage for each one of the rest of polygons. We extracted data points (P6, Px) for all individual diagrams of the CVT path represented in Table EV1 (i.e. 20 realizations of D1, D2, D3, D4, D5, D6, D10, D20, D30, D40, D50, D100, D200). P6 indicates the percentage of hexagons of the diagram and Px the percentage of polygon with “x” sides (being “x” equals to 4, 5, 7 or 8). We did not include the rest of the polygons since they appear in a very low frequency (always less than 5%, and 0% in most of the Voronoi diagrams, Table EV1). Applying a curve fitting, we adjusted a mathematical function to each set of data points in a range {25–75}. Therefore, we obtained 20 functions per each (P6, Px), one per each realization of the CVT. The {25–75} range was chosen since it is the range where the percentage of hexagons took values along the different diagrams of the CVT. Table EV6 shows the values for the 80 equations that have been selected as the best fitting for the data points.
To represent the continuous CVT path and facilitate the visualization of the data, we selected 500 random numbers in a range from 20 to 70 for each function that resolve Px (this range was slightly different to the one used for the curve fitting experiment, since it allowed better visualization of the relative position of the natural images). The resulting 10,000 points provide the probability density information in Figs 2B–E and 5E–H. This range was chosen so the values for all individual images showed in both figures were included. This information is represented in a greyscale where the darker area represents the higher probability. Over this graph, we plotted the average percentage of Px in natural images (dWL, dWP, dMWP, CNT, BCA, BNA and EYE) and simulations to compare the behaviour of natural tissues in relation with CVT path. Code EV1 includes the code for the generation of Voronoi diagrams to perform CVT path and the density graph CVT path.
Statistical differences between CVT path and natural images
We employed the continuous model of the CVT path described above to quantify the differences between the natural images and the Voronoi diagrams. We selected the average percentage of hexagons (P6) of each set of natural images and introduce the value in the 20 continuous equations of the CVT path generated to extract the 20 values of percentage of square, pentagons, heptagons and octagons that “ideally” correspond to each set of images (P6‐Px values). We compared the real values of P6‐Px of each category of natural images and the corresponding “ideal” data from the continuous CVT path (Table EV2). First, we evaluated whether “real” and “ideal” values presented similar distribution and variance using Kolmogorov–Smirnov and F‐Snedecor tests, respectively. In case that data presented the same distribution but not an equal variance, we employed a two‐tailed Welch test to compare the means from both groups. In case that data presented different distribution and a different variance, we employed Wilcoxon test to compare the means from both groups. We employed a two‐tailed Student's t‐test to compare the means in the cases where both distribution and variance of the two sets of data were similar. A P‐value smaller than 0.05 indicated that real P6‐Px values from biological samples were significantly different to the “ideal” P6‐Px values from the CVT path continuous model. We only considered relevant for the study the comparisons of P6‐Px with a representation higher of the 5% of the total of cells (lower percentages often involves a wide variation even in the individual Voronoi diagrams). Where comparisons to the continuous CVT path were not required, we tested polygonal distribution similarity using chi‐square tests of independence. In these cases, pairwise tests between tissues were performed using integer counts of the number of x‐sided polygons per sample.
Extraction of features from the images
In each image (natural, Voronoi diagrams and simulations), we selected a subset of “valid cells” to calculate several features. Valid cells were identified as follows: cells positioned in the edge of the image were called “border cells” (BC); the neighbours of BC were called “neighbours border Cell” (NBC). We define the Valid Cell (VC) as every cell in the image that is not including in CB and NCB.
| (2) |
We calculated features related with geometric and topological properties of the valid cells. Area: size (in pixels) of the cell in segmented image. Normalized Area: to compare Area from different categories. This has been used to test the different laws (Fig EV2 and Table EV3). log10 Normalized Area: as represented in the following equation.
| (3) |
where m is the number of valid cells in image, Area i is the size of the cell, and is the mean area of valid cells. We classified the values in bins of 0.02 units. The use of the log10 makes the values distribute similar to a normal distribution facilitating the comparison. We employed the two‐sample Kolmogorov–Smirnov test to compare “log10 normalized area” distribution of each category of natural images and the corresponding Voronoi diagram (Table EV4). Relation Axis: Ratio between the major and minor axes of each cell. Number of neighbours of a cell: Used to calculate the polygon distributions. For each category, cells were grouped by individual images and the relative percentages of each type of polygon were calculated. This allowed obtaining the standard error of the mean value for the frequency of each type of polygon. Average number of Neighbours of Neighbouring cells of a cell: Used to test the Aboav–Weaire law.
Computer simulations
The computer model is based on a vertex model described previously (Farhadifar et al, 2007; Mao et al, 2011). The cells are defined as polygons, and the cell shapes are traced by the position of the polygon vertices. Each connection between two vertices represents the attached boundary between two neighbouring cells. The energy of the whole tissue (4) is calculated as the total energy contribution from (a) the deviation of each cell from its ideal size, (b) sum of tensile and adhesive energy at individual cell–cell junctions and (c) overall contractility of each cell, reflecting the basic tendency of the cortical actomyosin cytoskeleton to resist deformation from an isometric shape.
| (4) |
Here, E(R i) is the total energy for the vertex positions R i, defining N c cells (a = 1…N c), composed of N v vertices (i = 1…N v). In the calculation of “area elasticity” (1), K α is the elasticity coefficient, Aα is the current area of the cell, and Aα (0) is the ideal area. In the “line tension” (2) calculation, the summation runs over all connected vertices <i, j>, Λi j is the line tension coefficient, and l ij is the length of the junction between vertices. In the “cortical contractility” (3) calculation, Lα is the cell perimeter, and Γα is the contractility coefficient. For details of the relaxation of the tissues, see Farhadifar et al (2007) and Mao et al (2011).
The simulations investigating the effects of cell divisions on topology are run to an equivalent of 18 h, with average cell division cycle of 5 h, where on average 4 h of growth is followed by potential division and an hour of resting period. During the growth phase, the ideal area (A α (0)) of the cell is gradually increased up to 2 × A α (0). In control scenarios, the cell is allowed to divide once the current cell area reaches 1.95 times the cell area at the onset of cell growth. Upon division, the ideal areas of the daughter cells are reset to A α (0), and the resting phase is initiated. Here, the control set‐up parameters of the healthy tissue are the same as above (A α (0) = 1.0, K α = 1.0, Λij = 0.26, and Γα = 0.0). The myosin mutation is simulated by randomly assigning a reduced tension parameter to each cell from the uniform distribution in the range Λij = 0.05–0.2. For the tension‐dependent cases, the cells are required to fulfil the additional criteria of having a tension parameter above the selected threshold, to successfully complete cell division; otherwise, they grow in size, without being able to divide the cell body. A cell without the ability to divide will be stuck in mitotic phase and will not start a second round of cell division. Two threshold values for the ability for division, 30 percentage of control tension (Λij = 0.078) and 40 percentage of control tension (Λij = 0.104) are simulated.
For the non‐proliferating simulations, first, 20 random Voronoi diagrams of 500 cells were generated and relaxed for 4 iterations applying Lloyd's algorithm. These iterations provided 20 starting frames equivalent to Diagram 5 of the CVT path. For the healthy cell simulations, the control set‐up parameters are the same as above (A α (0) = 1.0, K α = 1.0, Λij = 0.26, and Γα = 0.0). For the simulations mimicking neurogenic atrophy, random sick cells were generated to comprise 10 percentage of the total cell population. The sick cells had reduced ideal area, A α (0) = 0.3; reduced line tension, Λij = −0.104 (negative value indicates adhesion dominates at cell–cell junctions, leading to a tendency to increase the contact zone); and slight increased overall contractility, Γα = 0.05. As a control, a similar produce was performed with normal value of the ideal area: A α (0) = 1.0; reduced line tension, Λij = −0.104 and Γα = 0.05.
All simulations relating to muscle atrophy scenarios are run to an equivalent of 240 s, and the analysis is carried out by the image analysis procedure used for experimental images. The borders are excluded from the analysis to avoid border effects influencing the size distributions.
Analysis of subsets of cells from the images
To identify atrophic fibres from BNA images, we followed the instructions and advice from two neuromuscular disease specialists (pathologist and a neurologist from Hospital Virgen del Rocío, Seville, Spain). We selected as atrophic the valid cells that fulfilled two conditions: to be elongated and small. These conditions were made objective using the following procedure: To select elongated cells, we employed the “relation axis” (major axis/minor axis) feature that defined the roundness of a cell; we selected as atrophic cells those with a “relation axis” value higher than 3 and an area smaller than −0.2 (17.15% smaller cells from the BNA total).
“10% smaller cells” were selected from the valid cells using the area feature. “Sick cells” were selected from the randomly generated cells with altered parameters that also were valid cells.
Author contributions
LME designed the study with help from YM and AP. DS‐G wrote the software to generate and analyse Voronoi diagrams and compare them with natural images. DS‐G and JDB performed the statistical analysis. MT performed the computer simulations. JDB analysed the packed tissues in relation to Lewis and Aboav–Weaire laws. All authors participated in the interpretation of results, discussions and the development of the project. LME wrote the manuscript with help from YM and input from all authors.
Conflict of interest
The authors declare that they have no conflict of interest.
Supporting information
Expanded View Figures PDF
Table EV1
Table EV2
Table EV3
Table EV4
Table EV5
Table EV6
Code EV1
Review Process File
Acknowledgments
L.M.E. and D.S.‐G. are supported by the Ramón y Cajal Programme (PI13/01347), the Spanish Government grant BFU2011‐25734 and the ISCIII and FEDER funds PI13/01347. MT was funded by Sir Henry Wellcome Postdoctoral Fellowship (Grant No: 103095). YM was funded by a Medical Research Council Career Development Award Fellowship (Grant No: MR/L009056/1). The authors thank Juan F Martín‐Rodríguez for his kindly help with the statistical analyses.
The EMBO Journal (2016) 35: 77–88
References
- Aegerter‐Wilmsen T, Smith AC, Christen AJ, Aegerter CM, Hafen E, Basler K (2010) Exploring the effects of mechanical feedback on epithelial topology. Development 137: 499–506 [DOI] [PubMed] [Google Scholar]
- Axelrod JD (2006) Cell shape in proliferating epithelia: a multifaceted problem. Cell 126: 643–645 [DOI] [PubMed] [Google Scholar]
- Brazis PW (2011) General principles of Neurological Localization In Localization in Clinical Neurology, Williams L. (ed), 6th edn Philadelphia, PA: Lippincott, Williams & Wilkins; [Google Scholar]
- Brown KE, Baonza A, Freeman M (2006) Epithelial cell adhesion in the developing Drosophila retina is regulated by Atonal and the EGF receptor pathway. Dev Biol 300: 710–721 [DOI] [PubMed] [Google Scholar]
- Chichilnisky EJ (1986) A mathematical model of pattern formation. J Theor Biol 123: 81–101 [DOI] [PubMed] [Google Scholar]
- Classen AK, Anderson KI, Marois E, Eaton S (2005) Hexagonal packing of Drosophila wing epithelial cells by the planar cell polarity pathway. Dev Cell 9: 805–817 [DOI] [PubMed] [Google Scholar]
- Du Q, Faber V, Gunzburger M (1999) Centroidal voronoi tessellations: applications and algorithms. SIAM Rev 41: 637–676 [Google Scholar]
- Dubowitz V, Sewry CA (2007) Muscle Biopsy: A Practical Approach, 3rd edn Philadelphia, PA: Saunders Eselvier; [Google Scholar]
- Escudero LM, Bischoff M, Freeman M (2007) Myosin II regulates complex cellular arrangement and epithelial architecture in Drosophila . Dev Cell 13: 717–729 [DOI] [PubMed] [Google Scholar]
- Escudero LM, Costa Lda F, Kicheva A, Briscoe J, Freeman M, Babu MM (2011) Epithelial organisation revealed by a network of cellular contacts. Nat Commun 2: 526 [DOI] [PMC free article] [PubMed] [Google Scholar]
- Farhadifar R, Roper JC, Aigouy B, Eaton S, Julicher F (2007) The influence of cell mechanics, cell‐cell interactions, and proliferation on epithelial packing. Curr Biol 17: 2095–2104 [DOI] [PubMed] [Google Scholar]
- Finsterer J, Papic L, Auer‐Grumbach M (2011) Motor neuron, nerve, and neuromuscular junction disease. Curr Opin Neurol 24: 469–474 [DOI] [PubMed] [Google Scholar]
- Frade JM (2002) Interkinetic nuclear movement in the vertebrate neuroepithelium: encounters with an old acquaintance. Prog Brain Res 136: 67–71 [DOI] [PubMed] [Google Scholar]
- Gibson MC, Patel AB, Nagpal R, Perrimon N (2006) The emergence of geometric order in proliferating metazoan epithelia. Nature 442: 1038–1041 [DOI] [PubMed] [Google Scholar]
- Gibson WT, Gibson MC (2009) Cell topology, geometry, and morphogenesis in proliferating epithelia. Curr Top Dev Biol 89: 87–114 [DOI] [PubMed] [Google Scholar]
- Haeckel E (1904) Kunstformen der Natur. Leipzig und Wien: Bibliographisches Institut; [Google Scholar]
- Hayashi T, Carthew RW (2004) Surface mechanics mediate pattern formation in the developing retina. Nature 431: 647–652 [DOI] [PubMed] [Google Scholar]
- Hilhorst HJ (2006) Planar Voronoi cells: the violation of Aboav's law explained. J Phys A: Math Gen 39: 7227–7243 [Google Scholar]
- Hocevar A, El Shawish S, Ziherl P (2010) Morphometry and structure of natural random tilings. Eur Phys J E Soft Matter 33: 369–375 [DOI] [PubMed] [Google Scholar]
- Honda H (1978) Description of cellular patterns by Dirichlet domains: the two‐dimensional case. J Theor Biol 72: 523–543 [DOI] [PubMed] [Google Scholar]
- Kim S, Cai M, Hilgenfeldt S (2014) Lewis' law revisited: the role of anisotropy in size–topology correlations. New J Phys 16: 015024 [DOI] [PMC free article] [PubMed] [Google Scholar]
- Korn RW, Spalding RM (1973) The geometry of plant epidermal cells. New Phytol 72: 1357–1365 [Google Scholar]
- Lewis FT (1928) The correlation between cell division and the shapes and sizes of prismatic cells in the epidermis of cucumis. Anatom Rec 38: 341–376 [Google Scholar]
- Lloyd S (1982) Least square quantization in PCM. IEEE Trans Inform Theory 28: 129–137 [Google Scholar]
- Mao Y, Tournier AL, Bates PA, Gale JE, Tapon N, Thompson BJ (2011) Planar polarization of the atypical myosin Dachs orients cell divisions in Drosophila . Genes Dev 25: 131–136 [DOI] [PMC free article] [PubMed] [Google Scholar]
- Mastaglia FL (1992) Skeletal Muscle Pathology. London: Churchill Living‐stone; [Google Scholar]
- Miles RE, Maillardet RJ (1982) The basic structure of Voronoi and generalized Voronoi polygons. J Appl Prob 19: 97–111 [Google Scholar]
- Mirkovic I, Mlodzik M (2006) Cooperative activities of drosophila DE‐cadherin and DN‐cadherin regulate the cell motility process of ommatidial rotation. Development 133: 3283–3293 [DOI] [PubMed] [Google Scholar]
- Nagpal R, Patel A, Gibson MC (2008) Epithelial topology. BioEssays 30: 260–266 [DOI] [PubMed] [Google Scholar]
- Patel AB, Gibson WT, Gibson MC, Nagpal R (2009) Modeling and inferring cleavage patterns in proliferating epithelia. PLoS Comput Biol 5: e1000412 [DOI] [PMC free article] [PubMed] [Google Scholar]
- Pilot F, Lecuit T (2005) Compartmentalized morphogenesis in epithelia: from cell to tissue shape. Dev Dyn 232: 685–694 [DOI] [PubMed] [Google Scholar]
- Rivier N, Schliecker G, Dubertret B (1995) The stationary state of epithelia. Acta Biotheor 43: 403–423 [DOI] [PubMed] [Google Scholar]
- Sáez A, Rivas E, Montero‐Sánchez A, Paradas C, Acha B, Pascual A, Serrano C , Escudero LM (2013) Quantifiable diagnosis of muscular dystrophies and neurogenic atrophies through network analysis. BMC Med 11: 77 [DOI] [PMC free article] [PubMed] [Google Scholar]
- Sanchez‐Gutierrez D, Saez A, Pascual A, Escudero LM (2013) Topological progression in proliferating epithelia is driven by a unique variation in polygon distribution. PLoS ONE 8: e79227 [DOI] [PMC free article] [PubMed] [Google Scholar]
- Stevens PS (1974) Patterns in Nature. Boston‐Toronto: Little Brown and Co. in association with The Atlantic Monthly Press; [Google Scholar]
- Voronoi GF (1908) Nouvelles applications des paramètres continus à la théorie de formes quadratiques. J Reine Angew Math 134: 198–287 [Google Scholar]
- Wigmore PM, Dunglison GF (1998) The generation of fiber diversity during myogenesis. Int J Dev Biol 42: 117–125 [PubMed] [Google Scholar]
- Wilcock AC, Swedlow JR, Storey KG (2007) Mitotic spindle orientation distinguishes stem cell and terminal modes of neuron production in the early spinal cord. Development 134: 1943–1954 [DOI] [PMC free article] [PubMed] [Google Scholar]
- Young PE, Richman AM, Ketchum AS, Kiehart DP (1993) Morphogenesis in Drosophila requires nonmuscle myosin heavy chain function. Genes Dev 7: 29–41 [DOI] [PubMed] [Google Scholar]
- Zallen JA, Zallen R (2004) Cell‐pattern disordering during convergent extension in Drosophila . J Phys: Condens Matter 16: S5073–S5080 [DOI] [PMC free article] [PubMed] [Google Scholar]
- Zhu HX, Thorpe SM, Windle AH (2001) The geometrical properties of irregular two‐dimensional Voronoi tessellations. Philos Mag A 81: 2765–2783 [Google Scholar]
Associated Data
This section collects any data citations, data availability statements, or supplementary materials included in this article.
Supplementary Materials
Expanded View Figures PDF
Table EV1
Table EV2
Table EV3
Table EV4
Table EV5
Table EV6
Code EV1
Review Process File


