

Abstract
Cell fate specification relies on the action of critical transcription factors that become available at distinct stages of embryonic development. One such factor is NeuroD1, which is essential for eliciting the neuronal development program and possesses the ability to reprogram other cell types into neurons. Given this capacity, it is important to understand its targets and the mechanism underlying neuronal specification. Here, we show that NeuroD1 directly binds regulatory elements of neuronal genes that are developmentally silenced by epigenetic mechanisms. This targeting is sufficient to initiate events that confer transcriptional competence, including reprogramming of transcription factor landscape, conversion of heterochromatin to euchromatin, and increased chromatin accessibility, indicating potential pioneer factor ability of NeuroD1. The transcriptional induction of neuronal fate genes is maintained via epigenetic memory despite a transient NeuroD1 induction during neurogenesis. NeuroD1 also induces genes involved in the epithelial‐to‐mesenchymal transition, thereby promoting neuronal migration. Our study not only reveals the NeuroD1‐dependent gene regulatory program driving neurogenesis but also increases our understanding of how cell fate specification during development involves a concerted action of transcription factors and epigenetic mechanisms.
Keywords: epigenetics, gene regulation, NeuroD1, neurogenesis, pioneer transcription factor
Subject Categories: Chromatin, Epigenetics, Genomics & Functional Genomics; Neuroscience; Transcription
Introduction
Embryonic development in mammals involves function of a plethora of transcription factors that act at various levels to generate a spatiotemporally regulated gene expression program (Guillemot, 2007; Spitz & Furlong, 2012). Basic helix‐loop‐helix (bHLH) transcription factors are among such key players, and they contribute to the lineage commitment and terminal differentiation of various cell types during development (Jones, 2004). In mice, the first neurons of the central nervous system (CNS) are born at mid‐gestation, between embryonic day 10 (E10) and E11, heralding an important transition in the development of neural progenitor cells in the brain. Radial glial (RG) stem cells persist as the principal progenitor type during development of the embryonic and postnatal CNS (Kriegstein & Alvarez‐Buylla, 2009; Taverna et al, 2014). These neural stem cells located in the ventricular zone (VZ) undergo asymmetric division generating basal progenitors and neurons that migrate toward the subventricular zone (SVZ) and cortical plate (CP), respectively (Taverna et al, 2014). This process involves a number of key factors, including neurogenin family members (Neurog 1/2), which initiate a cascade of other critical proneural transcription factors, one of which is NeuroD1 (Ma et al, 1996; Sommer et al, 1996).
NeuroD1 is a bHLH transcription factor that plays an important role during neuronal differentiation (Hevner et al, 2006; Aprea et al, 2014). Given its prominent function during embryonic neurogenesis, it has also recently been used to reprogram other somatic cell types into neurons. In one such study, a combination of Pou3f2, Ascl1, and Myt1l, together with NeuroD1, was successfully used to reprogram fetal and postnatal fibroblasts into neurons (Vierbuchen et al, 2010). Furthermore, NeuroD1 alone was able to convert reactive glial cells into functional neurons in vivo as well as it could convert human astrocytes into glutamatergic neurons (Guo et al, 2014). These findings imply that NeuroD1 is a highly potent factor that promotes neuronal fate. However, no comprehensive investigation has been performed to uncover the gene regulatory program through which NeuroD1 mediates neuronal fate specification during development and reprogramming. Furthermore, NeuroD1's direct genomewide targets during neurogenesis remain unknown. In addition, despite existing knowledge that cell fate specification involves reprogramming of the epigenome (Mohn et al, 2008; Magnusdottir et al, 2012; Wamstad et al, 2012; Xie et al, 2013), very little is known regarding whether NeuroD1's function at its target sites involves chromatin remodeling. Finally, it is unknown whether the transient action of such factors during differentiation is able to induce long‐term epigenetic memory.
Here, we show that ectopic expression of NeuroD1 is sufficient to induce a program that closely recapitulates neuronal development in vivo. Genomewide analysis revealed that NeuroD1 activates neuronal development genes by directly binding to their regulatory elements. We found that NeuroD1 is able to bind its target heterochromatic promoters, which is followed by the loss of the Polycomb group (PcG)‐associated repressive mark H3K27me3 and replacement of repressor proteins such as TBX3. This is accompanied by the gain of the active mark H3K27ac, as well as increased chromatin accessibility, resulting in induced gene expression. On the other hand, NeuroD1 target enhancers are repressed by MBD3 occupancy and histone deacetylation in its absence. NeuroD1 binding displaces MBD3 from these sites and results in increased H3K27ac levels, leading to gene activation. These observations further suggest that NeuroD1 targeting to distal sites is both necessary and sufficient to trigger events that activate enhancers. Interestingly, in addition to key neuronal development genes, NeuroD1 also induces genes involved in the epithelial‐to‐mesenchymal transition. We further show that a transient action of NeuroD1 during development is sufficient to induce a neuronal gene expression program that is stably maintained by epigenetic memory. Taken together, our comprehensive findings uncovered the gene regulatory program through which NeuroD1 specifies the neuronal fate and revealed how this function involves reprogramming of the transcription factor and chromatin landscapes at its target sites.
Results
Ectopic expression of NeuroD1 is sufficient to induce the neuronal development program
A number of previous studies have shown that NeuroD1 is induced following the onset of neurogenesis (Lee et al, 1995, 2000; Schwab et al, 1998). We first investigated whether high NeuroD1 expression is a specific feature of neurogenic progenitors and newborn neurons. Using RNA‐seq datasets (Table EV1) (Fietz et al, 2012; Shen et al, 2012; Yue et al, 2014) from embryonic tissues that are representative of all three lineages, as well as from various layers of embryonic cortex, we found that NeuroD1 was highly expressed in the ventricular zone (VZ), was upregulated several fold in the subventricular zone (SVZ), and then downregulated in the cortical plate (CP; Fig 1A). Except in the pancreas, where it was transcribed at low levels, NeuroD1 was not expressed in any other investigated tissue. To determine whether similar NeuroD1 expression dynamics could be observed during the neuronal differentiation of embryonic stem cells, we adapted a highly refined system that generates over 95% pure neuronal progenitor (NP) cells (“radial glial‐like” cells) from embryonic stem (ES) cells that subsequently become terminally differentiated pyramidal neurons (TN) (Bibel et al, 2004, 2007). Previous studies, including our own, have demonstrated highly synchronous and reproducible changes in the epigenome and transcriptome during neuronal differentiation in this system (Mohn et al, 2008; Lienert et al, 2011; Stadler et al, 2011; Tiwari et al, 2012a,b; Thakurela et al, 2013). Moreover, in terms of the epigenome and the transcriptome, both the behavior of individual genes and genomewide analyses in mouse primary cortical neurons were in good agreement with this in vitro system, making it a highly appropriate model (Mohn et al, 2008; Tiwari et al, 2012a; Thakurela et al, 2013). We performed expression analysis of NeuroD1 in this system using qPCR which revealed that its expression was peaking immediately following the onset of neurogenesis (Fig 1B).
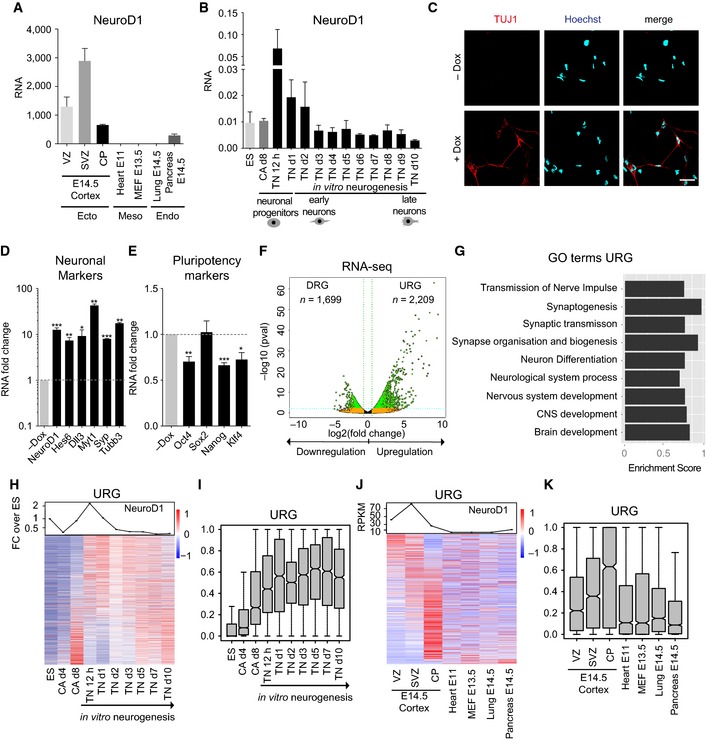
Figure 1. Ectopic expression of NeuroD1 is sufficient to initiate a neurogenic program that mimics neuronal development in vivo .
-
ARNA‐seq datasets from in vivo embryonic samples were analyzed for NeuroD1 expression. RNA represents the normalized tag counts from biological replicates.
-
BRT–qPCR results for NeuroD1 expression in an in vitro neuronal differentiation time course using biological replicates. RNA reflects the relative gene expression normalized to a housekeeping gene (Rpl19).
-
CImmunostaining of ES cells for TUJ1 (neuronal marker) and Hoechst (nucleus) after 48 h of NeuroD1 induction (+Dox) as well as for non‐induced control cells (−Dox). Scale bar, 10 μm.
-
D, ERT–qPCR results for the expression of neuronal markers (D) and hallmark pluripotency genes (E) after 48 h of NeuroD1 induction in ES cells. RNA fold change reflects the relative gene expression normalized to a housekeeping gene (Rpl19) plotted as the fold change of induced (+Dox) versus non‐induced (−Dox) condition. The y‐axis in (D) is plotted in a log10 scale.
-
FVolcano plot [x‐axis: log2 (fold change +Dox versus −Dox), y‐axis: −log10 (P‐value)] depicting differential gene expression after 48 h of NeuroD1 induction in ES cells. Data points marked in green represent genes crossing our significance cutoff for differential expression P‐value < 0.05 (blue dotted line) as well as abs (log2 (fold change)) ≥ 0.58 (green dotted line).
-
GTop GO terms that are enriched in the high‐confidence upregulated genes (URG) in (F). The bar length is determined by the enrichment score calculated by GSEA.
-
H, ILine plot showing NeuroD1 expression as fold change over ES during in vitro neurogenesis (H, upper panel). Heat map depicting the expression of URG from (F) in an in vitro neuronal RNA‐seq time course using biological triplicates (H, lower panel). Each row represents one promoter where gene expression is scaled from red (high expression) to blue (low expression). The same information is presented in (I) as a boxplot.
-
J, KLine plot showing NeuroD1 expression in embryonic tissues from (A) (J, upper panel). Heat map depicting the expression of URG in embryonic tissues from (A) (J, lower panel). The same information is presented in (K) as a boxplot.
To uncover the gene regulatory circuitry through which NeuroD1 functions to promote the neuronal fate, we ectopically induced expression of NeuroD1 in pluripotent mouse ES cells using a previously described system (Appendix Fig S1A and B) (Iacovino et al, 2011). Strikingly, within 48 h of NeuroD1 induction, many cells exhibited a neuron‐like morphology and expressed the neuron‐specific protein TUJ1 as revealed by immunofluorescence analysis (Fig 1C). These observations were further supported by quantitative expression analysis of several neuronal markers, all of which significantly increased in expression compared with non‐induced cells (Fig 1D). This induction of neuronal markers was accompanied by a downregulation of the pluripotency genes Oct4, Nanog, and Klf4, but not Sox2 (Fig 1E). Based on these observations, we next attempted to characterize the global gene expression changes induced by NeuroD1 in ES cells after 48 h by performing RNA‐sequencing on NeuroD1‐induced (+Dox) and non‐induced (−Dox) cells. After applying stringent criteria for the significance and fold‐change (FC) cutoff values (FDR ≤ 0.05, FC ≥ 1.5), a total of 2,209 upregulated genes (referred to as “URG” from here onwards) and 1,699 downregulated genes (referred to as “DRG” from here onwards) were identified (Fig 1F, Table EV2). Interestingly, GO term analysis of the URG showed enrichment exclusively for neurogenesis‐related ontologies (Fig 1G). KEGG pathway analysis of these genes revealed enrichment for neurogenic pathways (Appendix Fig S1C). Moreover, the highest upregulated genes were the most significant contributors to the neurogenesis‐related GO terms (Appendix Fig S1D). Interestingly, DRG were also downregulated during in vitro neurogenesis (Appendix Fig S1E and F) and were almost exclusively expressed in non‐neuronal lineages (Appendix Fig S1G and H). Furthermore, these genes were most enriched for non‐neuronal GO terms such as metabolic processes and cell adhesion (Appendix Fig S1I). Importantly, NeuroD1 induced the neuronal program despite the presence of pluripotency signals (LIF) and the absence of neuron‐promoting culture media, suggesting that NeuroD1 function is sufficient to override the pluripotent state and promote neuronal commitment. Given the prominent enrichment of neuronal genes among the NeuroD1‐induced transcripts, we questioned whether these genes are also normally induced during neuronal differentiation. Transcriptomic analysis showed that the majority of these genes were upregulated during the transition from neuronal progenitors to neurons both in vitro and in vivo (Fig 1H–K). Furthermore, most URG were considerably more expressed in cortical layers than in tissues of other lineages (Fig 1J and K). Interestingly, the expression of a large number of these genes remained high in terminally differentiated neurons, suggesting that NeuroD1‐induced transcriptional state persists following the brief period of NeuroD1 peaked expression and action during neuronal development (Fig 1H–K). We conclude that the ectopic expression of NeuroD1 is sufficient to induce a neuronal differentiation program that closely recapitulates neuronal development in vivo.
NeuroD1 directly targets regulatory elements of critical neuronal genes to induce their expression
Prompted by our findings, we next investigated whether this function could be directly linked to NeuroD1's DNA binding ability. To identify its genomewide targets, we ectopically expressed NeuroD1 in ES cells for 24 h and then performed a chromatin immunoprecipitation (ChIP) assay for NeuroD1 in combination with next‐generation sequencing (ChIP‐seq). Visual inspection of the genomic regions in these data suggested that NeuroD1 targeted distinct genomic sites including promoters and intergenic regions (Fig 2A and B). A comprehensive analysis revealed that NeuroD1 binding occurred at both promoter and non‐promoter regions (Fig 2C). However, when normalized for the small size promoters constitute in the entire genome, NeuroD1 peaks showed a preferential occurrence at promoters (around 39%, n = 341) (Fig 2C). Given the regulatory roles of promoters and enhancers, we next focused on thoroughly analyzing NeuroD1 occupancy at these target sites. Acetylation of lysine 27 at histone H3 (H3K27ac) is a hallmark of active enhancers (Creyghton et al, 2010; Rada‐Iglesias et al, 2011; Bonn et al, 2012; Zhu et al, 2013; Shlyueva et al, 2014). Therefore, to determine enhancers that are bound by NeuroD1, we obtained H3K27ac ChIP‐seq data from an early stage of neurogenesis in vitro (TN d1), a time point immediate to the highest NeuroD1 expression, and identified NeuroD1‐bound non‐promoter sites enriched for H3K27ac modification. A comparison of genes associated with these non‐promoter sites as well as NeuroD1‐bound promoters with URG revealed that a significant number of genes induced upon NeuroD1 expression were directly bound by NeuroD1 at their regulatory elements (~25%) (Appendix Fig S2A). We further classified the non‐promoter NeuroD1 targets into exonic, intronic, and intergenic enhancers (Appendix Fig S2B). We found that NeuroD1‐bound intronic and exonic enhancers were associated with URG involved in neurogenesis and showed induced expression upon neuronal differentiation in vitro and in vivo (Appendix Fig S2C–L). To avoid influence of genic chromatin landscape and other transcriptional regulatory events such as elongation that occur in gene bodies, we decided to focus on intergenic enhancers for further functional analysis (referred to as “enhancers” from here onwards).
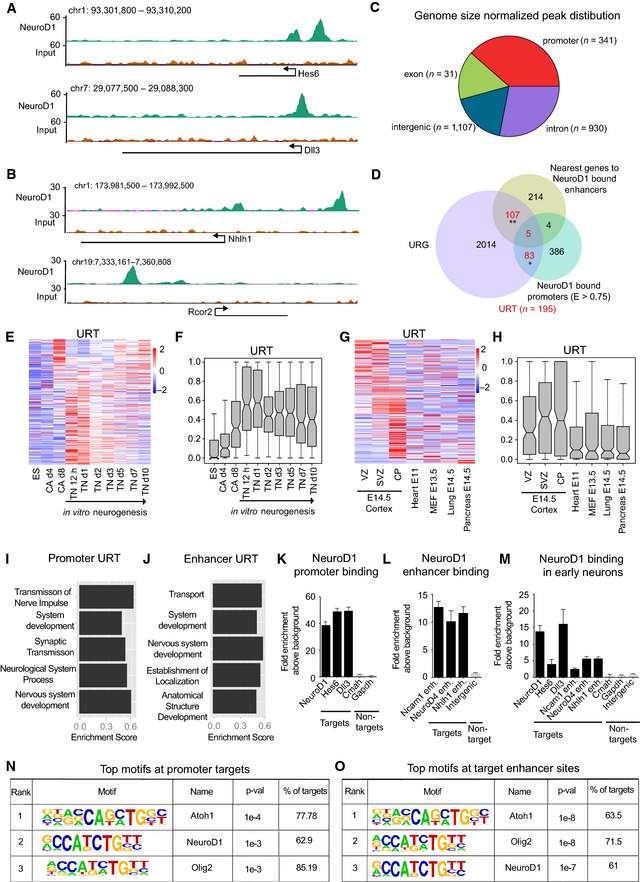
Figure 2. NeuroD1 directly binds the regulatory elements of critical neuronal developmental genes.
-
A, BUCSC genome browser screenshots showing enrichment of NeuroD1 at representative target promoters (A) or target enhancers (B) in ES cells after 24 h of induction. The merged wiggle files were generated from two biological replicates. The genes are displayed as arrows representing the direction of transcription. The baseline on y‐axis represents “0” values.
-
CPie chart depicting the distribution of NeuroD1 peaks (n = 2,409) reproducibly called in two biological replicates for particular genomic classes (promoters, intergenic regions, exons, and introns), normalized by genome size. The absolute number of peaks is shown in the inset. After genome size normalization, ˜39% (absolute number = 341) of total peaks are called at promoters, ˜18% (absolute number = 1,107) of peaks at intergenic, ˜28% (absolute number = 930) at intronic, and ˜16% at exonic (absolute number = 31) regions.
-
DVenn diagram showing the overlap of the URG (n = 2,209) and NeuroD1‐bound promoters (E > 0.75, n = 478) and the genes (n = 330) associated with NeuroD1‐bound enhancers (Top 500 enriched sites). Altogether, 195 URG are bound by NeuroD1 at their regulatory elements (upregulated targets, URT).
-
E, FHeat map (E) showing the RNA‐seq expression of URT in an in vitro neuronal differentiation time course. The same information is presented in (F) as a boxplot.
-
G, HHeat map (G) showing the RNA‐seq expression of URT in various embryonic tissues. The same information is presented in (H) as a boxplot.
-
I, JBar plots showing top GO terms for URT regulated at promoters (I) and enhancers (J). The bar length is based on the enrichment score determined by GSEA.
-
KChIP‐qPCR results for NeuroD1 binding to selected target (black) and control (gray) promoters in ES cells after 24 h of induction.
-
LChIP‐qPCR results for NeuroD1 enrichment at target enhancers (black) and additional intergenic control (gray) in ES cells after 24 h of induction.
-
MChIP‐qPCR results for NeuroD1 enrichment at target promoters and enhancers (black) as well as control regions (gray) in early neurons derived in vitro (TN d1).
-
N, OTables depicting the top three enriched motifs at NeuroD1‐bound promoters (N) and enhancers (O).
Comparing the overlap of NeuroD1‐bound targets with URG, we found that a significant fraction of genes upregulated upon NeuroD1 induction were directly bound by NeuroD1 at their promoters (n = 83), enhancers (n = 107), or both (n = 5) (referred to as “URT” (upregulated targets) from here onwards) (Fig 2D). These URT (n = 195) were significantly higher upregulated as compared to the overall transcriptional induction of URG following NeuroD1 expression (Appendix Fig S3A). Additionally, a significant fraction of our NeuroD1 target enhancers overlapped with previously described E14.5 brain‐ or cortex‐specific enhancers (Appendix Fig S3B) (Shen et al, 2012). Importantly, the majority of URT were upregulated during neurogenesis in vitro (Fig 2E and F) and in vivo (Fig 2G and H) and they were almost exclusively expressed in cortical layers but not in tissues of other lineages (Fig 2G and H). These observations were further supported by the enrichment of neurogenesis‐ and development‐related GO terms among URT (Fig 2I and J, and Appendix Fig S3C and D). We validated a number of these promoter and enhancer target sites using ChIP‐qPCRs (Fig 2K and L, data not shown). Importantly, although these targets were discovered after ectopic expression of NeuroD1 in ES cells, they were also bound by NeuroD1 in early neurons (Fig 2M). To investigate any sequence specificity in NeuroD1 targeting, we performed a motif enrichment analysis of genomic sequences underlying NeuroD1 peaks. Interestingly, the NeuroD1 motif was among the top three enriched motifs at the target promoters (Fig 2N and Appendix Fig S3E) and enhancer elements (Fig 2O and Appendix Fig S3F), suggesting a sequence‐dependent targeting of NeuroD1. A de novo motif prediction further revealed that most NeuroD1 peaks (approximately 95%) exhibit an E‐box motif directly at the peak summit, which is known to be associated with classical bHLH protein family members (Jones, 2004) (Appendix Fig S3G).
To extend our findings to a differentiated cell type, we ectopically expressed NeuroD1 in murine fibroblasts and analyzed its binding at identified target sites by ChIP assay and influence on the expression of their associated genes. Interestingly, NeuroD1 was able to locate and bind its target sequences and induce expression of associated genes (Appendix Fig S4A–G). This was accompanied by an upregulation of the neuronal marker Tubb3 (Appendix Fig S4H), but not of the housekeeper gene Tbp (Appendix Fig S4I). These observations indicate that, irrespective of the cell type, NeuroD1 is able to trigger activation of neuronal development genes by directly binding to their regulatory elements.
NeuroD1 induces the expression of transcription factors involved in neuronal development and migration
Because NeuroD1 expression induces a large number of neuronal genes, many of which are not direct NeuroD1 targets (Fig 2D), we speculated that NeuroD1 activates the expression of additional transcriptional regulators that could then mediate the observed secondary gene expression responses. Indeed, a deeper analysis of URT revealed a number of transcription factors and epigenetic regulators (promoter URT: n = 27/88; enhancer URT: n = 30/112). Interestingly, these factors were induced during neurogenesis in vitro as well as in vivo and were largely repressed in non‐neuronal lineages (Fig 3A–D). Importantly, although this list contained established regulators of neurogenesis (e.g. Hes6, Pou3f2, Sox11), it also harbored a number of factors not previously implicated in neurogenesis (e.g. Zfand5, Rnf182, or Aff3). Analysis of in situ hybridization (ISH) images as well as RNA‐seq datasets from the developing murine cortex validated the expression pattern of many identified NeuroD1 target genes (Fig 3E–J). We also observed, using example of one such target gene Lzts1, that the expression pattern of NeuroD1 target genes during cortical development may closely mimic NeuroD1 (Fig 3K).
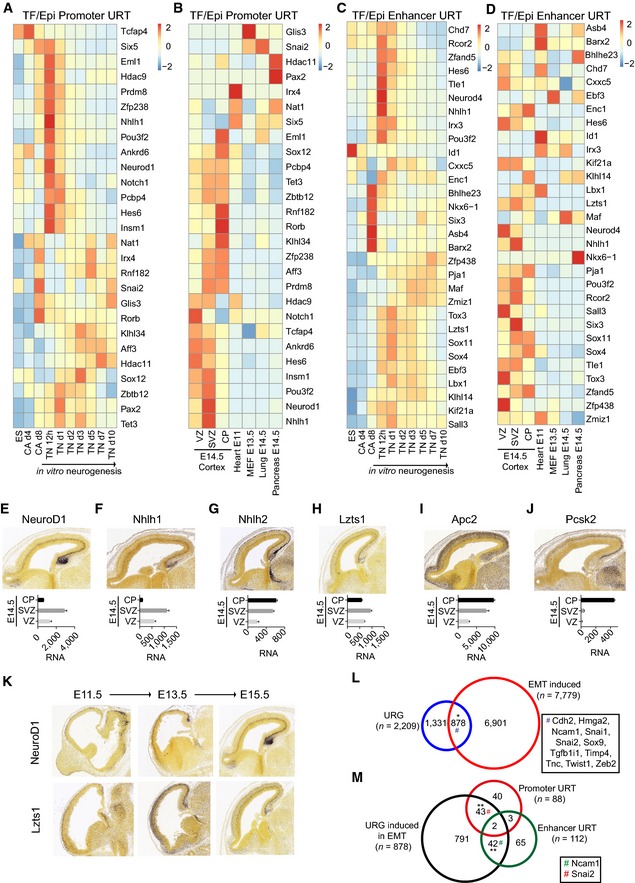
Figure 3. NeuroD1 induces expression of transcription factors that are involved in neurogenesis and the epithelial‐to‐mesenchymal transition.
-
A–DHeat map depicting the expression (RNA‐seq) of promoter URT transcription factors and epigenetic regulators (A, B) or URT regulated at enhancers (C, D) during an in vitro neuronal differentiation time course (A, C) and in various embryonic tissues (B, D).
-
E–JIn situ hybridization images of an antisense probe from the Allen Brain Atlas showing the expression of NeuroD1 (E) and representative targets [Nhlh1 (F), Nhlh2 (G), Lzts1 (H), Apc2 (I), and Pcsk2 (J)] in E15.5 cortex (upper panel). Bar plots depicting normalized tag counts from RNA‐seq expression analysis for the corresponding genes in E14.5 cortical layers (lower panel).
-
KIn situ hybridization of an antisense probe from the Allen Brain Atlas showing the expression of NeuroD1 and Lzts1 during several stages of cortical development.
-
LVenn diagram showing the overlap between genes that are induced during murine EMT (FC > twofold at any stage, n = 7,779) and URG (n = 2,209, overlap with EMT induced genes: ˜40%). Examples of hallmark EMT regulators are shown as inset.
-
MVenn diagram showing the significant overlap (˜10% of URG induced in EMT) between URG that are induced during murine EMT (n = 898) and promoter (n = 88) and enhancer URT (n = 112). Example genes are shown as inset.
NeuroD1 has also been implicated in neuronal migration (Kim, 2013), but the underlying molecular mechanism is largely unknown. Therefore, we next questioned whether classical migration genes involved in epithelial–mesenchymal transition (EMT) are induced following NeuroD1 expression. To address this question, we compared the NeuroD1‐induced genes with genes that we recently identified as upregulated during EMT (Sahu et al, 2015). Interestingly, this analysis showed that URG encompass a large number of genes that are upregulated during EMT (n = 878, ~40%) and include a number of hallmark genes that are known to promote EMT (Fig 3L). Furthermore, a number of these genes exhibit direct binding of NeuroD1 at their regulatory elements (n = 87, ~10%) (Fig 3M). These findings suggest that NeuroD1 may induce neuronal migration by activating the expression of critical EMT genes.
NeuroD1 functions by reprogramming the transcription factor and chromatin landscapes at target gene promoters
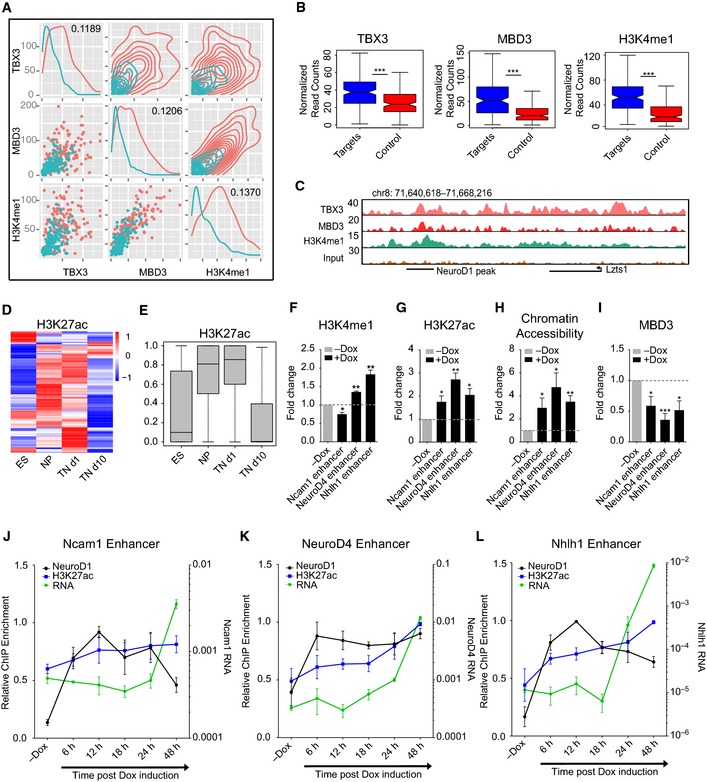
We next investigated whether there are mechanisms that actively repress NeuroD1 target genes in its absence and whether this bHLH factor overrides these silencing programs to induce gene expression. Toward this, we used a comprehensive approach and analyzed ChIP‐seq datasets for a large number of established histone modifications (n = 8) and transcription factors (n = 50) as well as a chromatin accessibility dataset (FAIRE‐seq) for murine embryonic stem cells (Table EV1). Using Bayesian modeling, we probed these datasets for features that were enriched at target promoters and able to significantly distinguish between NeuroD1‐bound and non‐bound promoters among URG (Appendix Fig S5A, Table EV3). The robust quantitative nature of the Bayesian model was able to classify target and control datasets with high accuracy (Appendix Fig S5B). The identified discriminating features included components of the basal transcriptional machinery (such as RNA Pol II and TAF3), which showed reduced enrichment at the NeuroD1 target promoters compared with the non‐targets. Among these features, we also identified the transcription factors TBX3 and UTF1, the histone modifications H3K27ac and H3K27me3 as well as chromatin accessibility as high‐confidence predictors that could significantly distinguish NeuroD1‐target and non‐target URG promoters (Fig 4A and B). The prediction revealed that while TBX3, UTF1, and PcG repressive mark H3K27me3 were enriched at NeuroD1‐target promoters in ES cells, these sites lacked the active histone modification H3K27ac (Fig 4A and B). Interestingly, many of the promoter URT were co‐occupied by UTF1 and TBX3 (Appendix Fig S5C). While UTF1 is an established contributor to the pluripotent state, we were intrigued to notice TBX3 at the repressed neuronal genes, as a recent study implicated TBX3 in the specification of mesoendoderm lineage (Weidgang et al, 2013). Importantly further, the chromatin at NeuroD1 target promoters was substantially less accessible compared with that of non‐target promoters (Fig 4A and B). These findings suggested that in the absence of NeuroD1, its target promoters are repressed by distinct factors and are held in a closed, heterochromatic state by the Polycomb mark H3K27me3 (as exemplified in Fig 4C). We next investigated the dynamics of H3K27ac mark at promoter URT during neuronal differentiation using ChIP‐seq data for this modification for different stages of this differentiation system. Interestingly, upon onset of neurogenesis, a large fraction of these promoter URT become acetylated on H3K27, when NeuroD1 is most highly expressed (Fig 4D and E). Moreover, these promoters lack H3K27ac in non‐neuronal tissues (Appendix Fig S5H and I), where NeuroD1 and its target promoters are also not transcribed (Figs 2G and H and 1A).
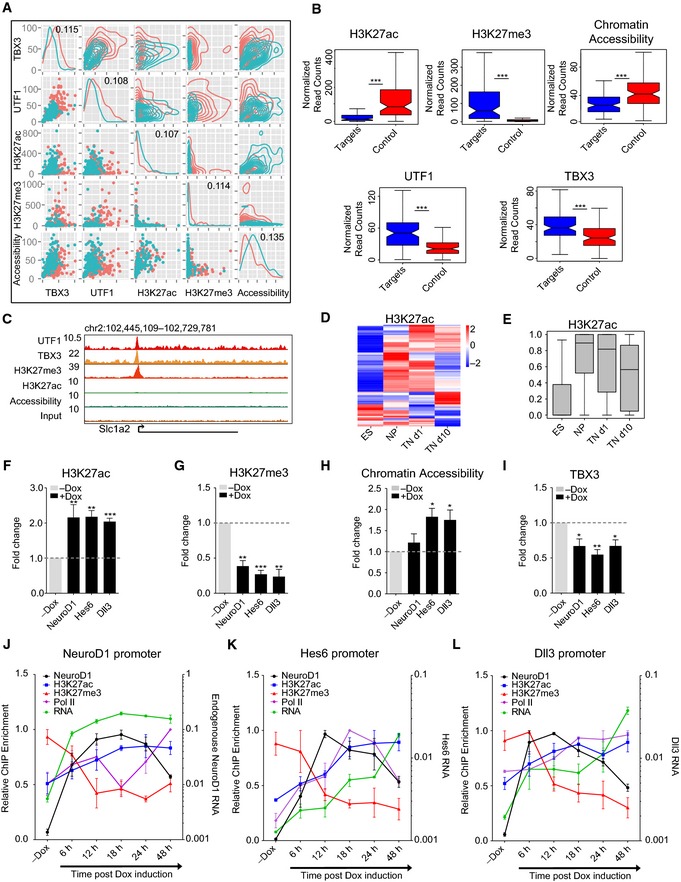
Figure 4. NeuroD1 binding to target promoters remodels the transcription factor landscape and causes a transition from heterochromatin to euchromatin, resulting in gene activation.
-
ADistribution plot depicting how ChIP‐Seq signal strength of the Bayesian model predicted features TBX3, UTF1, H3K27ac, H3K27me3 as well as chromatin accessibility (FAIRE‐seq) correlate at NeuroD1‐bound promoters. NeuroD1 promoter URT are depicted in red, and non‐bound promoter URG are depicted in cyan. Diagonal and top‐right charts group show one and two‐dimensional density plots, respectively. Bottom left charts show scatter plots of ChIP‐seq enrichment. The information gain coefficients for the corresponding features are shown in the diagonal.
-
BBoxplots depicting enrichment of H3K27ac, H3K27me3, chromatin accessibility, UTF1, and TBX3 as normalized read counts at promoter URT (blue) and non‐bound promoters of URG as control (red).
-
CUCSC genome browser screenshot showing H3K27ac enrichment, chromatin accessibility as well as the co‐localization of TBX3, UTF1, and H3K27me3 enrichment at a representative promoter URT. The genes are displayed as arrows representing the direction of transcription. The baseline on y‐axis represents “0” values.
-
D, EHeat map (D) depicting the dynamics of H3K27ac ChIP‐seq enrichment at promoter URT during an in vitro neuronal differentiation time course. The enrichment was calculated from two biological replicates per developmental stage (ES, NP, TN d1, and TN d10). The same information is presented in (E) as a boxplot. ChIP‐seq enrichment values are scaled between 0 and 1 on y‐axis.
-
F–IChIP‐qPCR results for the fold change of H3K27ac enrichment (F), H3K27me3 enrichment (G), chromatin accessibility as determined by FAIRE‐qPCR enrichment (H), and TBX3 enrichment (I) at representative target promoters after 48 h of NeuroD1 between induced (+Dox) and non‐induced ES cells (−Dox).
-
J–LChIP‐qPCR and RNA expression time‐course results [6, 12, 18, 24, and 48 h after induction, as well as in non‐induced ES cells (−Dox)] for the dynamics of enrichment for NeuroD1 (black), H3K27ac (blue), H3K27me3 (red), and RNA Pol II (purple) for three target promoters [NeuroD1 in (J), Hes6 in (K), and Dll3 in (L)] as well as RNA expression (green). The average enrichment of bound DNA normalized to the respective genomic DNA input was further normalized to the highest enrichment for each time‐course replicate and plotted on the y‐axis as relative ChIP enrichment. RNA reflects the relative gene expression normalized to a housekeeping gene (Rpl19) from three biological replicates.
We next tested whether NeuroD1 expression in ES cells induces the neuronal program by remodeling chromatin and changing transcription factor occupancy at these target promoters. To that end, after NeuroD1 was expressed in ES cells for 48 h, we performed a ChIP assay for TBX3, H3K27me3, and H3K27ac, and also measured chromatin accessibility using FAIRE methodology and analyzed the target promoters by qPCRs. These analyses showed that NeuroD1 binding at target gene promoters results in a loss of TBX3 and H3K27me3 and an increase in H3K27ac and chromatin accessibility (Fig 4F–I). Prompted by these observations, we next investigated the kinetics of NeuroD1 action with respect to epigenetic reprogramming at its target promoter sites. Therefore, following the induction of NeuroD1 expression in ES cells, we performed a time‐course analysis for enrichment of NeuroD1, H3K27me3, H3K27ac, and RNA Pol II using ChIP assay as well as expression of the associated target genes. This analysis showed that both the loss of H3K27me3 and the gain of H3K27ac occur after NeuroD1 binding which accompanies RNA Pol II recruitment and transcriptional induction (Fig 4J–L). Together, these findings suggest that NeuroD1 binds its target promoter sites despite their heterochromatic state and triggers their remodeling to euchromatin, thereby inducing gene expression. Furthermore, NeuroD1‐mediated antagonism of neuronal lineage repressors such as TBX3 provides additional competence in neuronal gene activation during neurogenesis.
NeuroD1 targeting to intergenic regions activates enhancers
Having observed that NeuroD1 also targeted a large number of enhancers, we next investigated the chromatin and transcription factor profile of these NeuroD1‐bound enhancers associated with URG. Using the same rigorous Bayesian modeling approach on the large‐scale ChIP‐seq datasets described earlier, we identified three features (two transcription factors—MBD3 and TBX3, and one histone modification—H3K4me1) that were able to discriminate between NeuroD1‐bound and non‐bound enhancers associated with URG with high accuracy (Fig 5A and B, Appendix Fig S6A and B, Table EV4). These transcription factors were co‐enriched at a number of enhancer URT sites (Fig 5C, Appendix Fig S6C). Interestingly, a large fraction of these enhancer URT sites gain H3K27ac during onset of neurogenesis (Fig 5D and E), a stage that is immediate to highest NeuroD1 expression (Fig 1B). In agreement with these changes at these distal regulatory elements, the genes associated with these enhancers gained expression in parallel to NeuroD1 induction during neurogenesis both in vitro and in vivo (Appendix Fig S6D–G). Furthermore, in non‐neuronal tissues, these distal regions were depleted of H3K27ac, suggesting they are inactive in the absence of NeuroD1 (Appendix Fig S6H and I). Similar observations were made for intragenic enhancers associated with URT (Appendix Fig S6J and K). These findings support the idea that, in the absence of NeuroD1, its target enhancers are kept inactive by repressive mechanisms, such as MBD3 occupancy and histone deacetylation.
Figure 5. NeuroD1 binding at distal regions activates enhancers that induce associated gene expression.
-
ADistribution plots depicting how ChIP‐seq signal strength of the Bayesian model predicted features TBX3, MBD3, and H3K4me1 correlates at enhancer URT. Enhancer URT are depicted in red and non‐bound enhancers associated with URG in cyan. Diagonal and top‐right charts group show one‐ and two‐dimensional density plots, respectively. Bottom left charts depict scatter plot of ChIP‐seq enrichment. The information of gain coefficients for the corresponding features is shown in diagonal.
-
BBoxplots depicting ChIP‐seq enrichment of TBX3, MBD3, and H3K4me1 as normalized read counts at enhancer URT (blue) and non‐bound enhancers associated with URG as control (red).
-
CUCSC genome browser screenshot depicting MBD3, TBX3, and H3K4me1 enrichment at a representative enhancer URT.
-
D, EHeat map (D) showing the dynamics of H3K27ac ChIP‐seq enrichment at enhancer URT sites during in vitro neuronal differentiation. The same information is presented in (E) as a boxplot.
-
F–IChIP‐qPCR results for the fold‐change H3K4me1 enrichment (F), H3K27ac enrichment (G), chromatin accessibility as determined by FAIRE‐qPCR enrichment (H), and MBD3 enrichment (I) at representative enhancer URT after 48 h of NeuroD1 induction (+Dox) in comparison with non‐induced ES cells (−Dox).
-
J–LChIP‐qPCR time‐course results [6, 12, 18, 24, and 48 h of induction, as well as in non‐induced ES cells (−Dox)] for the enrichment dynamics of NeuroD1 (black) and H3K27ac (blue) for three target enhancers [Ncam1 in (J), NeuroD4 in (K), and Nhlh1 in (L)] as well as RNA expression levels of associated genes (green). The average enrichment of bound DNA normalized to the respective genomic DNA input was further normalized to the highest enrichment per time‐course replicate and plotted on the y‐axis as relative ChIP enrichment. RNA reflects the relative gene expression normalized to a housekeeping gene (Rpl19) from three biological replicates.
Given the observation that NeuroD1 binds a large number of distal regulatory elements that are active only at specific stages of neurogenesis, we wanted to determine whether NeuroD1 binding at these distal regions creates changes in the regulatory factor and chromatin landscapes. Toward this, we performed ChIP assay using antibodies against MBD3, H3K4me1, and H3K27ac as well as FAIRE assay following NeuroD1 expression in ES cells for 48 h and assessed the target enhancers by qPCRs. Indeed, we found that the binding of NeuroD1 was accompanied by a loss of MBD3 and a gain of H3K4me1, H3K27ac, and chromatin accessibility at these target sites (Fig 5F–I). To determine the dynamics of enhancer activation by NeuroD1 binding, we performed a time‐course analysis for enrichment of NeuroD1 and H3K27ac using ChIP assay as well as expression levels of associated genes. Interestingly, this analysis showed that NeuroD1 binds to its target enhancers within 6 h after its induction and shortly thereafter, these sites show increasing levels of H3K27ac (Fig 5J–L). Interestingly, we also observed that the transcriptional induction of associated target genes was delayed for these enhancer URT as compared to the promoter URT (Fig 4J–L). These observations suggest that NeuroD1 targeting to these distal sites triggers their activation into enhancers that then induce gene expression.
NeuroD1 binds the identified targets in embryonic cortex and induces their euchromatic state and transcription to promote neurogenesis in vivo
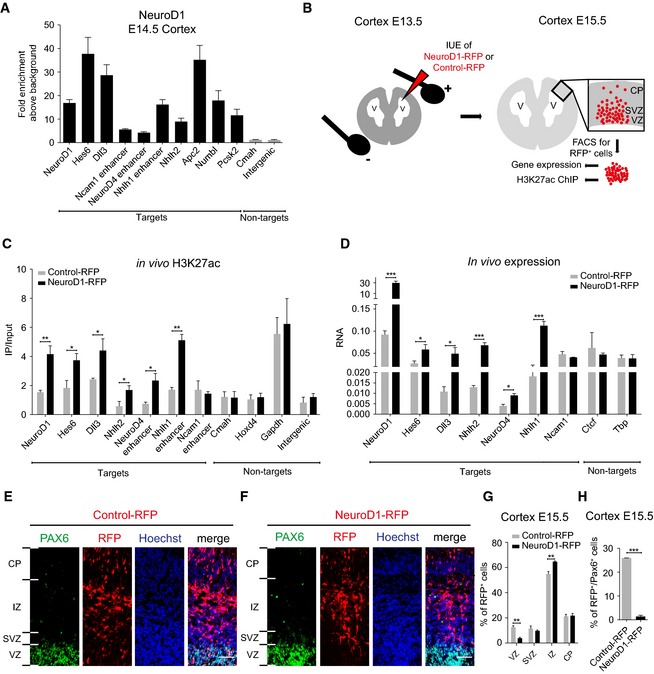
We next attempted to test whether NeuroD1 binds the identified target sites in vivo and whether it could function similarly in transcriptional induction via influencing epigenetic state during cortical development. Toward this, we performed ChIP assay using NeuroD1‐specific antibody in murine E14.5 cortex and tested its binding at the previously identified target sites. This analysis showed that all tested targets (both promoters and enhancers) were indeed occupied by NeuroD1 in the embryonic cortex, arguing that our approach has identified authentic loci bound by NeuroD1 during cortical development (Fig 6A). We next attempted to investigate the impact of NeuroD1 on the epigenetic landscape of its targets in vivo. We therefore performed in utero electroporation (IUE) assay in mouse cortex at E13.5 using either an empty (Control‐IRES‐RFP) or NeuroD1‐expressing (NeuroD1‐IRES‐RFP) plasmid as described previously (Aprea et al, 2013). We sacrificed the animals at E15.5 and isolated RFP‐positive cortical cells for further analysis of chromatin and gene expression changes in the manipulated cell populations (Fig 6B). Toward this, we performed ChIP assay using H3K27ac‐specific antibody under these two conditions and tested previously studied NeuroD1 promoter and enhancer targets (Figs 4F and 5G) for enrichment by qPCRs. Interestingly, such in vivo overexpression of NeuroD1 led to a significant increase in H3K27ac levels at NeuroD1 target sites (both promoters and enhancers) in comparison with the control condition (Fig 6C). Furthermore, this gain of H3K27ac accompanied a significant transcriptional induction of the associated genes (Fig 6D). Furthermore, we also analyzed the spatial distribution of RFP+ cells in the cortical layers under similar experimental conditions. We found that NeuroD1 induced a significant decrease in the proportion of RFP+ cells in the ventricular zone (VZ), the cortical layer that serves as a niche for neural progenitor cells, and a significant increase in the intermediate zone (IZ) (Fig 6E–G). This was further validated by our observations that almost no NeuroD1‐overexpressing cells showed co‐staining with the neural progenitor marker Pax6 (Fig 6H). These findings are in full agreement with our previous observations and establish that NeuroD1 binds and induces euchromatic state at regulatory elements of neuronal development genes during cortical development. As a consequence, NeuroD1 action induces their transcription and promotes neuronal differentiation.
Figure 6. NeuroD1 occupies the identified targets in embryonic cortex and induces their euchromatic state to upregulate transcription of associated genes and promote neurogenesis in vivo .
-
AChIP‐qPCR results showing enrichment of endogenous NeuroD1 at target (black) and control sites (gray) in embryonic cortex E14.5. The y‐axis shows the relative NeuroD1 enrichment plotted as the ratio of precipitated DNA (bound) to input DNA and further normalized to an intergenic control region (background).
-
BScheme depicting the in utero electroporation (IUE) procedure for NeuroD1‐IRES‐RFP or Control‐IRES‐RFP plasmids at E13.5 (left panel). Scheme depicting procedure for isolation of RFP‐positive cortical cells by FACS at E15.5 and indicated downstream applications (right panel).
-
CChIP‐qPCR results for H3K27ac enrichment at NeuroD1 target regulatory sites as well as control regions in E15.5 FAC‐sorted cortical cells 48 h post‐IUE (NeuroD1 OE: black, control: gray). The y‐axis shows the relative H3K27ac enrichment plotted as the ratio of precipitated DNA (bound) to input DNA (IP/Input).
-
DRT–qPCR results for the expression of NeuroD1 targets and non‐targets in E15.5 FAC‐sorted cortical cells 48 h post‐IUE (NeuroD1 OE: black, control: gray). RNA is plotted as the relative gene expression normalized to a housekeeping gene (Rpl19).
-
E, FImmunostaining for PAX6 (neural progenitor marker), RFP (electroporated cells), and Hoechst (nucleus) in a cortical section of E15.5 mouse brain 48 h post‐IUE with Control‐IRES‐RFP vector (E) or with NeuroD1‐IRES‐RFP expression vector (F). Shown is a representative example out of two biological replicates. Scale bar, 50 μm.
-
GQuantifications of the spatial distribution of Control‐ or NeuroD1‐IRES‐RFP‐electroporated cells at E15.5 48 h after IUE.
-
HQuantifications of the RFP and PAX6 double‐positive cells at E15.5 48 h after IUE of control or NeuroD1‐IRES‐RFP expression vectors.
Transient action of NeuroD1 during neuronal differentiation is sufficient to confer stable epigenetic changes at its target sites
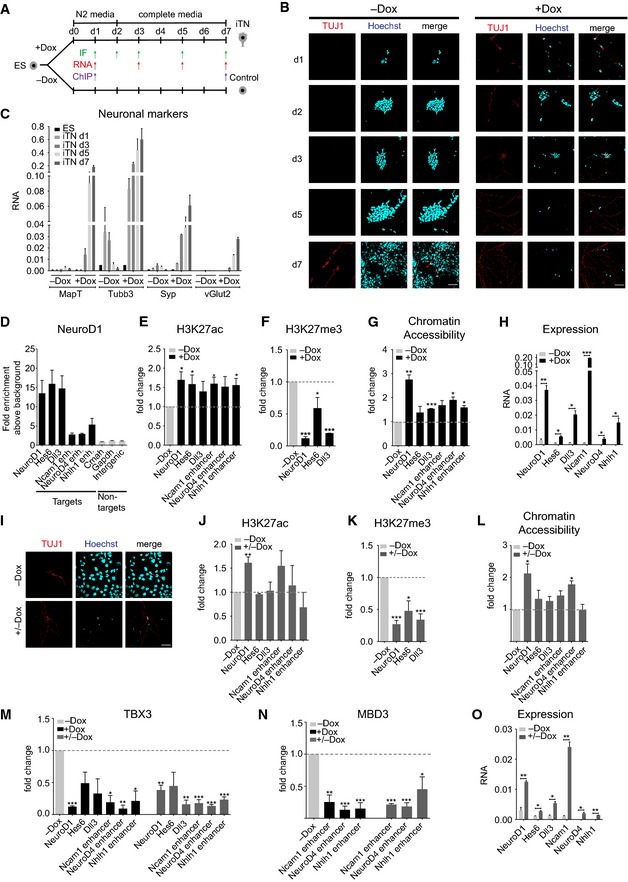
We were next interested in recapitulating our findings in a context where cells are exposed to an environment that promotes neuronal differentiation. Toward this, we tested the possibility of directly differentiating ES cells into neurons by simultaneously removing pluripotency signals, adding neuronal culture medium, and consistent induction of NeuroD1 expression (Fig 7A). Immunofluorescence analysis for the neuronal marker TUJ1 during this time course showed a gradual increase in the number of TUJ1‐positive cells upon NeuroD1 induction, whereas only a few non‐induced cells ever expressed TUJ1, and that expression occurred only at very late time points (Fig 7B).
Figure 7. The effect of the transient action of NeuroD1 persists through epigenetic mechanisms.
-
AScheme depicting the direct ES differentiation protocol to induce terminal neuron (iTN) differentiation after induction of NeuroD1 (+Dox) including control condition (−Dox). Arrows indicate the time points at which experiments were performed (IF, RNA expression, and ChIP). ChIP‐qPCR for ectopic NeuroD1 was performed at d1, and all ChIP‐qPCRs for changes in chromatin and transcription factor landscapes as well as FAIRE‐qPCRs for chromatin accessibility were performed at d7 of iTN formation.
-
BImmunostaining time course for TUJ1 (neuronal marker) and Hoechst (nucleus) during iTN differentiation (+Dox) and in the control condition (−Dox). The lesser number of cells during iTN formation (+Dox) is most likely a result of cells acquiring a post‐mitotic state as part of neurogenesis whereas control cells (−Dox) that lack NeuroD1 induction and efficient neurogenesis continue to proliferate. Scale bar, 50 μm.
-
CRT–qPCR results for the expression of neuronal marker genes during iTN differentiation in induced (+Dox) and control condition (−Dox). Data are derived from two biological replicates.
-
DChIP‐qPCR results for NeuroD1 enrichment at identified regulatory elements 24 h after ectopic NeuroD1 induction.
-
E–GChIP‐qPCR results for fold change of H3K27ac enrichment (E), H3K27me3 enrichment (F), and chromatin accessibility as determined by FAIRE‐qPCR enrichments (G) at target genomic elements at day 7 of iTN formation between induced (+Dox) and non‐induced control cells (−Dox).
-
HRT–qPCR results for the expression of representative URT at day 7 of iTN differentiation in induced (+Dox) and non‐induced control cells (−Dox). Data are derived from two biological replicates.
-
IImmunostaining for TUJ1‐positive cells at day 7 of iTN formation for cells which have been deprived of doxycycline after 48 h (+/−Dox) and control condition (−Dox). Scale bar, 50 μm.
-
J–LChIP‐qPCR results for fold change of H3K27ac enrichment (J), H3K27me3 enrichment (K), and chromatin accessibility as determined by FAIRE‐qPCR enrichments (L) at target genomic elements at day 7 of iTN formation between cells exposed to transient ectopic NeuroD1 induction (+/−Dox) and non‐induced control cells (−Dox).
-
M, NChIP‐qPCR results for the fold change of TBX3 (M) or MBD3 (N) enrichment at target genomic elements at day 7 of iTN formation comparing continuously induced (+Dox) as well as transiently induced (+/−Dox) iTNs with control cells (−Dox).
-
ORT–qPCR results for the expression of representative URT at day 7 of iTN differentiation upon Dox removal after 48 h (+/−Dox) and non‐induced control (−Dox). Data are derived from two biological replicates.
An expression analysis showed that the ectopic NeuroD1 was detected within 24 h of its induction, which was accompanied by upregulation of endogenous NeuroD1 (Appendix Fig S7A); this pattern closely resembled that of NeuroD1 induction in ES cells (Appendix Fig S1A). Under same culture conditions, but without NeuroD1 induction, endogenous NeuroD1 was minimally induced, and its expression was further reduced within a few days (Appendix Fig S7A). Furthermore, compared with the control cells, all core pluripotency markers except Sox2 were rapidly downregulated following NeuroD1 induction (Appendix Fig S7B). Importantly, this repression was accompanied by a drastic and constant upregulation of neuronal markers only in NeuroD1‐induced cells (Fig 7C). Having observed that NeuroD1 can rapidly and efficiently generate neurons under these conditions, we refer to these neurons as “induced terminally differentiated neurons” (“iTN”, Fig 7A). Interestingly further, we observed that the degree of transcriptional induction of neuronal genes was strongly correlated to the ectopic NeuroD1 levels (Appendix Fig S7C–G).
We further tested whether NeuroD1 targets the same promoters and enhancers during iTN differentiation as during in vitro neuronal differentiation of ES cells following NeuroD1 expression. Indeed, a ChIP‐qPCR analysis showed that all tested promoters and enhancers were NeuroD1 occupied within 24 h of its expression (Fig 7D). Importantly, NeuroD1 binding was accompanied by the loss of the repressive mark H3K27me3 from its target promoters, as well as the acquisition of the active chromatin mark H3K27ac and chromatin accessibility at its target promoters and enhancers at day 7 (Fig 7E–G). Such epigenetic remodeling to a euchromatic state was further accompanied by transcriptional activation of associated genes (Fig 7H). These observations further suggest that, regardless of the context, once expressed, NeuroD1 can locate and bind its genomic targets and mediate epigenetic remodeling to confer transcriptional competence.
We had previously observed that while NeuroD1 is only very transiently induced during onset of neurogenesis (Fig 1A and B), a large number of its target genes maintain a transcriptionally active state later during neurogenesis (Fig 2E–H) despite the absence of NeuroD1. We therefore investigated the consequences of transient versus constitutive NeuroD1 expression on iTN formation. Removal of doxycycline after 48 h of induction (+/−Dox) led to the loss of ectopic NeuroD1 expression within 24 h (Appendix Fig S7H). However, despite such transient presence of ectopic NeuroD1, TUJ1‐positive iTN cells were still efficiently generated that maintained their identity days later even when NeuroD1 was no longer present (Fig 7I). Based on the observation that transient NeuroD1 expression still induces neurogenesis, we next investigated whether the NeuroD1‐induced changes in the epigenetic state and gene expression could be maintained after removing NeuroD1 from its target sites. Interestingly, analysis of NeuroD1's target promoters and enhancers showed that while NeuroD1‐induced increase in H3K27ac and chromatin accessibility was maintained only at few targets, the reduction in PcG‐associated repressive H3K27me3 mark was efficiently maintained at all target sites despite the later absence of NeuroD1 (Fig 7J–L).
We then further investigated whether the reorganization of transcription factor landscape observed following ectopic expression of NeuroD1 in ES cells could also be recapitulated during iTN differentiation. Interestingly, ChIP‐qPCR analysis showed that such NeuroD1 targeting to its binding sites further led to a loss in the occupancy of TBX3 and MBD3. Strikingly, such reprogrammed transcription factor landscape was maintained at all target sites even when NeuroD1 was expressed very briefly during the onset of neurogenesis (+/−Dox) (Fig 7M and N). Consistent with such maintenance of the NeuroD1‐induced changes in the epigenetic and transcriptional factor landscape at its target sites, these genes maintained an elevated transcriptional state later during iTN formation despite the removal of NeuroD1 (Fig 7O). Together, these findings suggest that while NeuroD1 functions for a short period during neurogenesis, the changes it induces in the epigenetic state and transcription factor landscape at its target sites might persist which in turn contribute to the sustained gene expression program during neuronal development.
Discussion
The transcriptional program underlying embryonic neurogenesis is regulated by the spatiotemporal expression pattern of critical transcription factors (Guillemot, 2007; Spitz & Furlong, 2012). One such factor, the basic helix‐loop‐helix transcription factor NeuroD1, is required for neurogenesis as well as for the migration of newborn neurons during development (Kim, 2013; Aprea et al, 2014). Here, we found that the ectopic expression of NeuroD1 in ES cells was sufficient to induce a neuronal differentiation program that closely mimics neurogenesis in vivo. Importantly, NeuroD1 was able to override the presence of stimuli for pluripotency, inducing neuronal gene expression and repressing core pluripotency genes (Oct4, Klf4, Nanog). This result is in agreement with those of previous studies that show, for example, NeuroD1's ability to induce terminal neuronal differentiation during olfactory neurogenesis (Boutin et al, 2010) or in reprogramming somatic cells into neurons (Marro et al, 2011; Guo et al, 2014).
We found that NeuroD1‐induced genes were enriched for neuronal ontologies and are dependent on NeuroD1 expression, as supported by their repressed state in other non‐neuronal tissues or in stages of neuronal differentiation when NeuroD1 was not expressed. We then uncovered the relationship between NeuroD1 expression and neuronal gene induction by showing that NeuroD1 directly binds either the promoters or enhancers of a number of upregulated genes. A significant fraction of these direct targets encode gene regulatory proteins, including transcription factors, uncovering how NeuroD1 governs multiple levels of the neurogenic transcription program. Many of these transcription factors (e.g. Zfand5, Rnf182, Aff3) have not been explored in the context of neurogenesis and warrant further investigation. Interestingly, we found that a substantial fraction of NeuroD1‐induced genes is also induced during EMT, a process that is critical for neuronal development and the migration of newborn neurons (Kwan et al, 2012). Importantly, these upregulated genes include several transcription factors that are established EMT markers (e.g. Snai2, Twist1, Zeb2). Interestingly, recent studies have linked NeuroD1 to the regulation of cell motility in neuroendocrine cancers (Huang et al, 2011; Osborne et al, 2013, 2014). Overall, these findings support NeuroD1 as a critical regulator of neuronal development, during which it promotes neurogenesis as well as the migration of newborn neurons by directly regulating the underlying transcriptional program.
The classical definition of a pioneer factor requires the protein to be able to recognize and bind its target sites even if they exist in closed chromatin (Iwafuchi‐Doi & Zaret, 2014). Our findings show that NeuroD1 is one such pioneer factor as it can bind its genomic targets despite their being in a closed, heterochromatic state. These observations further suggested that the DNA sequence itself could be critical in guiding NeuroD1 to its target sites. Indeed, computational analysis revealed that NeuroD1‐bound promoters and enhancers were significantly enriched for the established NeuroD1 motif. Furthermore, a de novo motif analysis supported these observations by showing that most of NeuroD1 peaks (approximately 95%) exhibit the classical E‐box motif, which is known to be the target motif of bHLH proteins (Jones, 2004), exactly at the peak center. Our motif analysis further revealed that, in addition to the NeuroD1 motif, a few other bHLH transcription factor motifs were also present at the NeuroD1 target sites. It has been suggested that the DNA binding efficiency of bHLH transcription factors is improved by their pairing with other bHLH transcription factors (Poulin et al, 2000). It is possible that NeuroD1 binds to its target sites in partnership with other bHLH transcription factors that facilitate or stabilize this binding. In addition to binding the target sequences at regulatory elements following expression in ES cells, NeuroD1 also targeted the same sites upon expression in murine fibroblasts as well as during neurogenesis in vitro and in vivo, resulting in an induced expression of associated genes. Altogether, these findings implicate NeuroD1 as a pioneer factor by being able to recognize and bind its target sequence irrespective of the local chromatin context and cell type to regulate gene expression.
Interestingly, the chromatin and transcription factor landscapes of the induced NeuroD1 direct targets could discriminate them from non‐target sites. This study showed that, in the absence of NeuroD1, its target promoters and enhancers are silenced by distinct combinations of regulatory factors and chromatin marks. When NeuroD1 is induced, it can target these regulatory sites in a sequence‐specific manner and induce another set of changes that confers transcriptional competence. For example, NeuroD1 binding to promoters leads to a loss of the PcG‐associated repressive mark H3K27me3 and increase in both H3K27ac and chromatin accessibility. Similarly, NeuroD1 binding at enhancers results in an increased H3K27ac levels and chromatin accessibility. Consequently, such NeuroD1 targeting to regulatory elements results in the induction of associated genes. Previous studies have shown that non‐promoter H3K27ac mark closely predicts enhancers and has been frequently used to define functional enhancers (Creyghton et al, 2010; Rada‐Iglesias et al, 2011; Bonn et al, 2012; Zhu et al, 2013; Cheng et al, 2014; Kwiatkowski et al, 2014; Shlyueva et al, 2014). Very recently, it was shown that the targeting of acetyltransferase p300 (that acetylates H3 at K27) to enhancers is sufficient to activate enhancers and the associated gene expression (Hilton et al, 2015). Given these studies and our findings that NeuroD1 recruitment to distal regions triggers a gain in their H3K27ac levels and induce gene expression, we propose that NeuroD1 targeting to distal sites is able to activate enhancers. Interestingly, these NeuroD1 target promoters and enhancers show similar chromatin dynamics in response to endogenous NeuroD1 during neuronal differentiation. Using a time‐course analysis following NeuroD1 expression, we also made the interesting observation that genes associated with NeuroD1 promoter targets are induced much earlier as compared to enhancer targets, suggesting a differential regulatory cascade operating at the two sets of NeuroD1 target regulatory elements.
Our approach to identify direct targets of NeuroD1 following its ectopic expression in ES cells identified authentic targets as all tested regions were also occupied by NeuroD1 in the embryonic cortex. Furthermore, we also validated the functional impact of NeuroD1 in vivo by showing that its overexpression during cortical development induces euchromatinization of its target regions, as marked by their increased levels of H3K27ac, which parallels transcriptional induction of associated genes. Such action promotes neuronal fate as evident by the observations that NeuroD1‐overexpressing cells exit neuronal progenitor state and increase in proportion in the upper cortical layers. These findings are also among the first to show epigenetic reprogramming in response to increased levels of a transcription factor during cortical development that in turn impacts upon cell fate decisions.
Our study further shows that NeuroD1 displaced TBX3 from its target sites to induce neuronal gene expression, suggesting that TBX3 functions in suppressing the neuronal lineage. In support of this model, a recent study showed that TBX3 drives cell fate specification toward the mesoendoderm (Weidgang et al, 2013). These observations suggest that TBX3 promotes the mesoendoderm lineage while suppressing the neuronal lineage and that the expression of NeuroD1 during neuronal development overrides TBX3's function. Overall, the NeuroD1‐mediated antagonism of TBX3 appears to be a critical event during neuronal development.
We also found that many inactive neuronal enhancers are bound by MBD3. MBD3 is a subunit of NuRD, a multisubunit complex that possesses nucleosome remodeling and histone deacetylase activities (Zhang et al, 1999). These findings suggest that, in the absence of NeuroD1, MBD3 may contribute to the inactive state of NeuroD1 target enhancers by keeping them in a hypoacetylated state. In line with this hypothesis, we show that NeuroD1 binding can displace MBD3 from these distal regions, leading to an increase in H3K27ac and the activation of the associated neuronal genes.
We recapitulated our observations in an environment that favors neuronal differentiation and showed that NeuroD1 induction strongly enhances the neurogenic potential of uncommitted cells. Under these conditions, NeuroD1 targets the same enhancers and promoters, leading to similar alternations in the epigenetic and transcription factor landscapes and inducing the expression of genes involved in neuronal development. Our observations also show that the induction of target neuronal genes strongly depends on NeuroD1 levels, suggesting that the trigger to a neurogenic cell fate acquisition might only occur once a certain threshold of NeuroD1 level is achieved. Similar behavior has been shown for other bHLH factors such as Ascl1 (Imayoshi & Kageyama, 2014) and implies that this may be common mode of action for bHLH family members during differentiation.
Our study also addressed for the first time how transcription factors that are induced for a brief period during development have potential to orchestrate long‐term transcriptional program by inducing epigenetic memory. NeuroD1 is highly induced very briefly during the onset of neurogenesis, while many of its target genes are kept active for much longer period despite its later absence. We find that a transient expression of NeuroD1 was sufficient to trigger changes at its target sites that ensured a long‐term maintained loss of repressive transcription factor landscape as well as heterochromatin and consequently, a transcriptionally induced state of its targets. These striking findings demonstrate that the brief period of NeuroD1 action can generate epigenetic memory at its target sites that lasts longer than the presence of NeuroD1 itself and contributes to the maintained expression profile and phenotypic state. In combination with our findings of a strong sequence specificity in NeuroD1 recruitment, these observations provide new concepts of how genetic determinants may guide epigenetic memory to ensure stability of distinct transcription programs during development.
Taken together, our findings provide novel insights into the genomic targets of NeuroD1 and the mechanism through which it mediates neurogenesis. Our results suggest a model in which NeuroD1 binds regulatory elements despite them being in a heterochromatic state and initiates a set of events that includes the reprogramming of heterochromatin to euchromatin, causing the activation of neuronal genes (Fig 8). Our findings also provoke for novel concepts of how single neurogenic factors are targeted to their target sites by genetic mechanisms where they reprogram the transcription factor and epigenetic landscapes to favor neurogenesis. This study also suggests that the effect of the transient action of critical transcription factors may persist at their target sites through epigenetic mechanisms. Future work should aim to unravel how the relationship between NeuroD1 and other neurogenic transcription factors contribute to the transcriptional reprogramming that underlies neuronal differentiation during embryonic development.
Figure 8. NeuroD1 reprograms chromatin and transcription factor landscapes to induce the neuronal program.
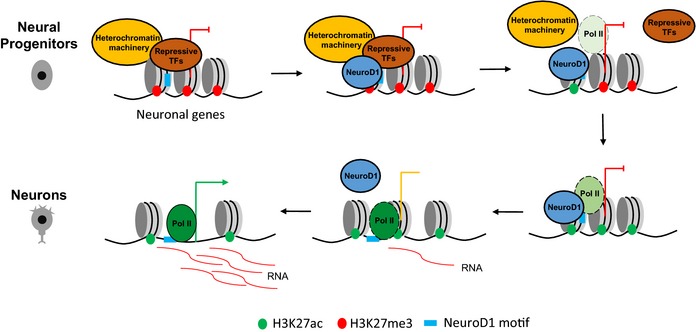
In neural progenitors, NeuroD1 target promoters are embedded in heterochromatic environment. Upon induction, NeuroD1 binds to its target sites by recognizing its sequence motif which is followed by replacement of heterochromatin machinery and repressive transcription factors. The loss of inactive (H3K27me3) and gain of active (H3K27ac) histone marks are accompanied by increased chromatin accessibility, leading to recruitment of RNA polymerase II and gene expression. Similar dynamics is observed at NeuroD1 target enhancers except that H3K27me3 was absent at these sites prior to NeuroD1 binding. Consequently, NeuroD1 induces gene regulatory program that specifies neuronal fate. Despite a transient NeuroD1 action during neurogenesis, the transcriptional induction of target neuronal genes persists for longer term via epigenetic memory.
Materials and Methods
Cell culture
Murine ES cells were cultured at 37°C in 7% CO2 and 88% relative humidity in 8 ml of ES medium [DMEM supplemented with 10% fetal calf serum, 1× MEM NEAA, 2 mM l‐glutamine, and LIF on feeders (inactivated MEFs)]. For experiments, the feeders were removed by splitting the ES cells every 2 days onto tissue culture dishes coated with 0.2% gelatin, and the media was changed daily. Experiments were performed after five passages of the feeder‐free state. In vitro neuronal differentiation was performed as described by Bibel et al (2004, 2007). Similar to this protocol, ES cells were directly plated on PORN/Laminin‐coated tissue culture dishes and cultivated for 2 days in N2 media followed by complete media for iTN formation. Transgenic A2lox ES cells harboring the murine NeuroD1 CDS (NM_010894.2) fused to an N‐terminal HA‐tag under the control of a doxycycline‐inducible promoter were generated according to Iacovino et al (2011). Ectopic induction of NeuroD1 was achieved with 500 ng/ml doxycycline for indicated durations.
Chromatin immunoprecipitation (ChIP) assay
The cells were cross‐linked in medium containing 1% formaldehyde for 10 min at room temperature, neutralized with 0.125 M glycine, scraped off, and rinsed twice with 10 ml of cold 1× PBS. The cells were pelleted by centrifugation for 7 min at 4°C at 600 g. The pellets were resuspended in 10 ml of buffer L1 (50 mM HEPES KOH, pH 7.5, 140 mM NaCl, 1 mM EDTA pH 8.0, 10% glycerol, 5% NP‐40, 0.25% Triton X‐100) and incubated at 4°C for 10 min. This step was followed by centrifugation for 5 min at 4°C at 1,300 g. The pellet was resuspended in 10 ml of buffer L2 (200 mM NaCl, 1 mM EDTA pH 8.0, 0.5 mM EGTA pH 8.0, 10 mM Tris pH 8.0) and incubated at room temperature for 10 min, followed by centrifugation for 5 min at 4°C at 1,300 g. The pellet was resuspended in buffer L3 (1 mM EDTA pH 8.0, 0.5 mM EGTA pH 8.0, 10 mM Tris pH 8.0, 100 mM NaCl, 0.1% Na‐deoxycholate, 0.17 mM N‐lauroyl sarcosine) containing protease inhibitors, sonicated using a Bioruptor Plus (Diagenode), and incubated overnight at 4°C. After clearing the cellular debris by spinning at 14,000 g for 10 min at 4°C, 60 μg of chromatin was incubated overnight at 4°C with the appropriate antibodies after 1 h of preclearing. The mixture was then incubated with 40 μl of protein A‐ or G‐Sepharose beads that had been preblocked with tRNA and BSA for 3 h at 4°C. The beads were washed twice with 1 ml of buffer L3 and once with 1 ml of DOC buffer [10 mM Tris (pH 8.0), 0.25 M LiCl, 0.5% NP‐40, 0.5% Na‐deoxycholate, 1 mM EDTA], and the bound chromatin was eluted in 1% SDS/0.1 M NaHCO3. Next, treatment with RNase A (0.2 mg/ml) was performed for 30 min at 37°C followed by treatment with proteinase K (50 μg/ml) for 2.5 h at 55°C. The cross‐linking was reversed at 65°C overnight with gentle shaking. The DNA was purified by phenol–chloroform extraction followed by ethanol precipitation and was recovered in 40 μl of TE buffer.
For in vivo ChIP assay in E14.5 embryonic cortex, the meninges were removed from extracted cortices and cells resupended in PBS containing 2 mM DSG (Sigma) and cross‐linked for 45 min at room temperature. After four washing steps with PBS, the ChIP assay was performed as described above.
Real‐time PCR on the ChIP material was performed using SYBR Green chemistry (ABI) and ChIP (1:40) or input (1:100) DNA. The sequences of all primers used in this study are provided in Table EV5.
Formaldehyde‐assisted isolation of regulatory elements (FAIRE)
For FAIRE (Giresi et al, 2007; Simon et al, 2012), the cells to be assayed were fixed, lysed, and sonicated as described for ChIP. After clearing the cellular debris by spinning at 14,000 g for 10 min at 4°C, the DNA was isolated by adding an equal volume of phenol:chloroform:isoamyl alcohol (25:24:1), vortexing, and spinning at 12,000 g for 8 min at room temperature. The upper aqueous phase was isolated, followed by a second round of phenol:chloroform:isoamyl alcohol purification. For the subsequent collection of the aqueous phase, an equal volume of chloroform:isoamyl alcohol (24:1) was added, vortexed, and spun at 12,000 g for 8 min at room temperature. The upper aqueous phase was collected, and the DNA was then ethanol precipitated and recovered in 40 μl of TE buffer. The recovered material was treated with RNase for 30 min (0.2 mg/ml), re‐cleaned with phenol followed by chloroform:isoamyl alcohol (24:1), and precipitated with ethanol. The DNA was recovered in 40 μl of TE buffer. To generate the input DNA control, RNase and proteinase K digestion, reverse cross‐linking, and purification of 10% of the input material were performed as described for the ChIP samples as well as real‐time PCR analysis.
Quantitative RT–PCR
Total RNA of cultured cells was prepared using TRIzol reagent (Invitrogen) and reverse‐transcribed with a First Strand cDNA Synthesis kit (Fermentas). The RNA of FAC‐sorted cortical cells was extracted using the RNeasy Micro kit (Qiagen) and reverse‐transcribed with the SuperScript VILO cDNA Synthesis kit (Invitrogen). The transcripts were quantified by qPCR using SYBR® Green PCR MasterMix (ABI) on a ViiA™ 7 Real‐Time PCR System (Life Technologies). Mouse Rpl19 primers were used for normalization of RNA expression, primers amplifying an intergenic region for normalization of ChIP enrichment above background. The sequences of all primers used in this study are provided in Table EV5.
Immunofluorescence assay
Cells were grown on coverslips and fixed with 4% paraformaldehyde in PBS for 15 min at room temperature. The cells were permeabilized and simultaneously blocked with 10% goat serum and 5% FBS in PBS supplemented with 0.2% Triton X‐100 for 1 h at room temperature. Isolated E15.5 embryonic brains were fixed for 24 h in 4% PFA in PBS at 4°C followed by cryoprotection in 10% sucrose for 2 h then in 30% sucrose (in PBS) overnight. Brains were embedded in Tissue‐Tek, stored at −20°C, and cryosectioned in 10 μm. Sections on coverslips were preblocked with 2% BSA, 0.5% Triton (in PBS) for 1 h. Subsequently, the samples were incubated with primary antibodies overnight at 4°C. The coverslips were incubated with fluorochrome‐labeled secondary antibody for 1 h at room temperature. The coverslips were counterstained with Hoechst, mounted with Immu‐Mount, and imaged with a confocal laser‐scanning microscope. The data were processed with ImageJ software.
Immunoblotting
The cells were lysed in RIPA buffer, and the protein concentrations were quantified using Bradford reagent. Equal amounts of protein (30 μg) were boiled in 6× SDS–PAGE loading buffer, run on a polyacrylamide gel, transferred to a PVDF membrane, blocked in 5% milk, and probed with the appropriate antibodies.
Animals
Mice of C57BL/6N background were kept under standard housing conditions, and experiments were carried out according to local regulations.
In utero electroporation (IUE)
Plasmids were generated by inserting the murine NeuroD1 CDS (NM_010894.2) into the pCIDRE vector containing IRES‐RFP (NeuroD1‐IRES‐RFP). The original pCIDRE backbone without insertion of an additional CDS was used as Control‐IRES‐RFP plasmid. IUE at E13.5 was performed as previously described (Artegiani et al, 2012; Aprea et al, 2013). In brief, plasmids were prepped using an EndoFree Plasmid Maxi kit (Quiagen) and plasmid concentration adjusted to 5 μg/μl. Pregnant mice were anaesthetized with isofluorane at E13.5 and ~1.5 μl of plasmid solution injected into the ventricle of embryonic brains. The plasmids were electroporated into the dorsal ventricular zone with nine pulses of 30 V, 50 ms each at 1 s interval delivered through platinum electrodes using a BTX‐830 electroporator (Genetronics).
Fluorescence‐activated cell sorting
FACS of cortical cells was performed as previously described (Aprea et al, 2013). In brief, E15.5 wild‐type electroporated cortices were dissociated using the papain‐based neural dissociation kit (Milteney Biotec) after removal of meninges and ganglionic eminences. For ChIP samples, cells were cross‐linked with 1% formaldehyde in PBS for 10 min at room temperature, neutralized with 0.125 M glycine, and washed two times with PBS. Samples for RNA isolation were immediately processed after dissociation. FACS was performed with a gating strategy for red (561 nm) fluorescence.
FACS of in vitro cultured cells was performed with the BD LSRFortessa Cell Analyzer. NIH3T3 murine fibroblasts were transfected with either NeuroD1‐IRES‐RFP or Control‐IRES‐RFP plasmids using Lipofectamine 2000 (Invitrogen). Cells were trypsinized after 48 h, resupended in PBS, and sorted based on RFP intensity. The sorted cells were immediately processed for RNA extraction.
Reagents and antibodies
The reagents used in this study were as follows: PBS (D8537, Sigma); trypsin (25300‐054, Invitrogen); DMEM (21969‐035, Invitrogen); FBS (10270, Invitrogen); glutamine (25030‐024, Invitrogen); MEM NEAA (100x; 11140‐035, Invitrogen); TRIzol (15596026, Invitrogen); a reverse transcriptase kit (K1612, Fermentas); SYBR® Green PCR MasterMix (4334973, Invitrogen); Bradford reagent (5000205, Bio‐Rad); protease inhibitor cocktail (04693132001, Roche); and Protein A‐/G agarose beads (16‐156, Millipore).
The antibodies used for Western blot analysis were anti‐HA (ab9110, Abcam; 1:6,000), anti‐beta‐actin (sc‐47778, Santa Cruz; 1:1,000), anti‐mouse IgG‐HRP (sc‐2005, Santa Cruz; 1:10,000) and anti‐rabbit IgG‐HRP (sc‐2004, Santa Cruz; 1:10,000).
The antibodies used for immunofluorescence were anti‐TUJ1 (T2200, Sigma; 1:200), anti‐PAX6 (Covance, PRB‐278P‐100; 1:200), and Alexa Fluor 568 goat anti‐rabbit IgG (H+L; A11011, Invitrogen; 1:1,000).
The antibodies used for the ChIP assay were 5 μg of anti‐HA (ab9110, Abcam), NeuroD1 (#4373, Cell Signaling, 1:50; used for in vivo ChIP), 2 μg of anti‐H3K27me3 (39155, Active Motif), 2 μg of anti‐H3K27ac (ab4729, Abcam), 2 μg of anti‐H3K4me1 (ab8895, Abcam), 8 μg of anti‐TBX3 (sc31657, Santa Cruz), and 8 μg of a 1:1 mixture of anti‐MBD3 (ab16057, Abcam), and anti‐MBD3 (A302‐528A, Biomol).
RNA‐seq analysis
An RNA‐seq poly(A) library was generated according to Illumina's instructions using oligo‐dT primers. The RNA‐sequencing output was in FASTQ format. NeuroD1 RNA‐seq datasets derived from ES cells after NeuroD1 induction for 48 h (+Dox) or under non‐induced condition (−Dox) in two biological replicates each. After a quality check using FASTQC v2.6.14 (Andrews), the output was aligned to the mouse genome (mm9) with UCSC's annotations using TopHat v2.0.8 (Trapnell et al, 2009). Only uniquely mapped reads were retained for further analysis. SAMTOOLS v0.1.19 (Li et al, 2009) was used to convert the BAM output to SAM format and to sort the BAM file. The read counts per gene were calculated using the HTSeq program, v0.5.4p1 (Anders et al, 2015). The DESeq package (Oshlack et al, 2010) was used to generate normalized read counts and for differential gene expression analysis. DESeq called differentially expressed genes with FDR cutoff of 0.05 and abs(FC) > 1.5 were considered as significant differentially expressed genes. In vivo RNA‐seq data from various embryonic tissues were normalized together by implementing RPKM normalization from Cufflinks package (Trapnell et al, 2012). GO term analysis was performed using GenePattern GSEAPreranked (Subramanian et al, 2007) and ToppGene (Chen et al, 2009). Gene lists derived from RNA‐seq analysis following NeuroD1 induction in ES cells are supplied in Tables EV2 and EV6.
ChIP‐seq, FAIRE‐seq, and motif analysis
Quality control of the ChIP/FAIRE‐sequencing output was undertaken using FASTQC (Andrews). NeuroD1 ChIP‐seq was generated in ES cells following 24 h NeuroD1 induction in two biological replicates. Bowtie v0.12.9 (Langmead et al, 2010) with default parameters was used to align the reads to the mouse mm9 genome with annotations from UCSC (Karolchik et al, 2014). Each read was aligned to maximally one position in the genome. SAMTOOLS v0.1.19 was used to convert the SAM file into BAM format and to sort and index the BAM file. The peaks were called using MACS2 v2.0.10.20120913 (Zhang et al, 2008) using default parameters. Peaks reproducible across two biological replicates with margin of 100 base pairs were retained. WIG files were generated using the QuasR (Gaidatzis et al, 2015) package and visualized using the UCSC genome browser. The raw read counts that aligned to each genomic feature (promoters, peaks, and enhancers) were calculated using QuasR. Enrichment was calculated after merging biological replicates using the following formula:
where n s is the total number of reads in the sample that align with the genomic feature; N s is the total number of aligned reads in the sample; n b is the total number of reads in the input/background that align with the genomic feature; N b: Total is the number of aligned reads in the input/background; and p is the pseudocount, used to correct enrichments at genomic features with low read counts, which was set to 8. The same protocol was used for FAIRE‐seq analysis.
The enhancers were identified using the above formula and were based on the H3K27ac peaks in TN d1 that were enriched at least 2‐fold over the input. The enhancer regions were defined as −1,000 to +1,000 bases from the H3K27ac peak summit. Enhancers were associated with genes by nearest gene approach excluding promoter regions (−800 to +200 bp from TSS) using annotatePeaks.pl method from HOMER v4.7 (Heinz et al, 2010). Enhancer classification into genomic location subtypes was based on UCSC mm9 genome annotation (Karolchik et al, 2014).
HOMER v4.7 was used to annotate the peaks. Motif analysis of the promoters was performed by submitting the gene list to the HOMER findMotifs.pl program, and the motifs were defined from −800 to +200 nucleotides from the TSS. For motif analysis at the enhancers, the input regions to the findMotifs.pl program were given in BED format. De novo motif was built by sequence analysis using rGADEM (Li, 2009) on enriched (E > 1) NeuroD1 peaks.
Gene lists associated with NeuroD1‐enriched genomic loci are provided in Table EV6.
Bayesian modeling
ChIP‐seq data for 50 transciption factors (TFs) and 8 histone marks (HMs) in ES cells were downloaded from the NCBI GEO database after selection through quality check using FASTQC (Edgar et al, 2002) (Table EV1). After ChIP‐seq processing and analysis (as described above), a matrix of the raw read counts that aligned with promoters as well as enhancers was generated and further normalized for library size using Trimmed Mean of M‐values (TMM) normalization in the edgeR v3.0 package (Robinson et al, 2010). The NaiveBayes module from WEKA v3.6 (Frank et al, 2004) was used for classification. For promoter analysis, targets are defined by NeuroD1‐bound promoters which are upregulated upon its induction, while control dataset was generated from randomly selected equal number of non‐target promoters of induced genes. Similarly, for enhancer analysis, target enhancer sites associated with induced genes were taken as target set while the control set was generated by compiling equal number of randomly selected non‐bound enhancer sites associated with induced genes. Calculations of classification accuracy and area under the curve were performed using ROCR v1.0.5 (Sing et al, 2005). The information gain quotient for the selected features was calculated using infoGainAttributeEval method as provided in WEKA. The set of the most relevant features (transcription factors and histone marks) were selected using Wrapper approach with Naive Bayes as a classification algorithm and Best First as a search method.
Data deposition
All the next‐generation sequencing datasets used in this study have been submitted to GEO and will be publicly available under accession number GSE65072.
Author contributions
AP performed computational analysis, analyzed data, and wrote the manuscript. JJ performed experiments, analyzed data, and wrote the manuscript. PS provided bioinformatics tools and helped with computational analysis. FN performed in utero electroporation and FACS sorting of cortical cells. FC and TS provided critical tools and suggestions. VKT designed the study, analyzed data, and wrote the manuscript. All authors read and approved the final manuscript.
Conflict of interest
The authors declare that they have no conflict of interest.
Supporting information
Appendix
Table EV1
Table EV2
Table EV3
Table EV4
Table EV5
Table EV6
Review Process File
Acknowledgements
We would like to thank members of the Tiwari laboratory for their cooperation and critical feedback during the project. We gratefully acknowledge support from the Core Facilities of the Institute of Molecular Biology (IMB), Mainz, especially from the microscopy, cytometry, genomics, and bioinformatics core facilities. We also thank Michael Kyba (University of Minnesota) for providing the A2Lox.cre ES cells and the p2Lox plasmid. This project was supported by Deutsche Forschungsgemeinschaft (DFG) Grant TI 799/1‐1 to V.K.T.
The EMBO Journal (2016) 35: 24–45
See also: A Glahs & RP Zinzen (January 2016)
References
- Anders S, Pyl PT, Huber W (2015) HTSeq‐a Python framework to work with high‐throughput sequencing data. Bioinformatics 31: 166–169 [DOI] [PMC free article] [PubMed] [Google Scholar]
- Andrews S FastQC a quality control tool for high throughput sequence data.
- Aprea J, Prenninger S, Dori M, Ghosh T, Monasor LS, Wessendorf E, Zocher S, Massalini S, Alexopoulou D, Lesche M, Dahl A, Groszer M, Hiller M, Calegari F (2013) Transcriptome sequencing during mouse brain development identifies long non‐coding RNAs functionally involved in neurogenic commitment. EMBO J 32: 3145–3160 [DOI] [PMC free article] [PubMed] [Google Scholar]
- Aprea J, Nonaka‐Kinoshita M, Calegari F (2014) Generation and characterization of Neurod1‐CreER(T2) mouse lines for the study of embryonic and adult neurogenesis. Genesis 52: 870–878 [DOI] [PubMed] [Google Scholar]
- Artegiani B, Lange C, Calegari F (2012) Expansion of embryonic and adult neural stem cells by in utero electroporation or viral stereotaxic injection. J Vis Exp 68: e4093 [DOI] [PMC free article] [PubMed] [Google Scholar]
- Bibel M, Richter J, Schrenk K, Tucker KL, Staiger V, Korte M, Goetz M, Barde YA (2004) Differentiation of mouse embryonic stem cells into a defined neuronal lineage. Nat Neurosci 7: 1003–1009 [DOI] [PubMed] [Google Scholar]
- Bibel M, Lacroix E, Klein C, May‐Nass R, Perez‐Alcala S, Richter J, Schrenk‐Siemens K (2007) Embryonic stem cell‐derived neurons as a novel cellular model system to study neurodegenerative and neuroregenerative processes in vitro . J Stem Cells Regen Med 2: 62–63 [PubMed] [Google Scholar]
- Bonn S, Zinzen RP, Girardot C, Gustafson EH, Perez‐Gonzalez A, Delhomme N, Ghavi‐Helm Y, Wilczynski B, Riddell A, Furlong EE (2012) Tissue‐specific analysis of chromatin state identifies temporal signatures of enhancer activity during embryonic development. Nat Genet 44: 148–156 [DOI] [PubMed] [Google Scholar]
- Boutin C, Hardt O, de Chevigny A, Core N, Goebbels S, Seidenfaden R, Bosio A, Cremer H (2010) NeuroD1 induces terminal neuronal differentiation in olfactory neurogenesis. Proc Natl Acad Sci USA 107: 1201–1206 [DOI] [PMC free article] [PubMed] [Google Scholar]
- Chen J, Bardes EE, Aronow BJ, Jegga AG (2009) ToppGene Suite for gene list enrichment analysis and candidate gene prioritization. Nucleic Acids Res 37: W305–W311 [DOI] [PMC free article] [PubMed] [Google Scholar]
- Cheng Y, Ma Z, Kim BH, Wu W, Cayting P, Boyle AP, Sundaram V, Xing X, Dogan N, Li J, Euskirchen G, Lin S, Lin Y, Visel A, Kawli T, Yang X, Patacsil D, Keller CA, Giardine B, Mouse EC et al (2014) Principles of regulatory information conservation between mouse and human. Nature 515: 371–375 [DOI] [PMC free article] [PubMed] [Google Scholar]
- Creyghton MP, Cheng AW, Welstead GG, Kooistra T, Carey BW, Steine EJ, Hanna J, Lodato MA, Frampton GM, Sharp PA, Boyer LA, Young RA, Jaenisch R (2010) Histone H3K27ac separates active from poised enhancers and predicts developmental state. Proc Natl Acad Sci USA 107: 21931–21936 [DOI] [PMC free article] [PubMed] [Google Scholar]
- Edgar R, Domrachev M, Lash AE (2002) Gene expression omnibus: NCBI gene expression and hybridization array data repository. Nucleic Acids Res 30: 207–210 [DOI] [PMC free article] [PubMed] [Google Scholar]
- Fietz SA, Lachmann R, Brandl H, Kircher M, Samusik N, Schroder R, Lakshmanaperumal N, Henry I, Vogt J, Riehn A, Distler W, Nitsch R, Enard W, Paabo S, Huttner WB (2012) Transcriptomes of germinal zones of human and mouse fetal neocortex suggest a role of extracellular matrix in progenitor self‐renewal. Proc Natl Acad Sci USA 109: 11836–11841 [DOI] [PMC free article] [PubMed] [Google Scholar]
- Frank E, Hall M, Trigg L, Holmes G, Witten IH (2004) Data mining in bioinformatics using Weka. Bioinformatics 20: 2479–2481 [DOI] [PubMed] [Google Scholar]
- Gaidatzis D, Lerch A, Hahne F, Stadler MB (2015) QuasR: quantification and annotation of short reads in R. Bioinformatics 31: 1130–1132 [DOI] [PMC free article] [PubMed] [Google Scholar]
- Giresi PG, Kim J, McDaniell RM, Iyer VR, Lieb JD (2007) FAIRE (Formaldehyde‐Assisted Isolation of Regulatory Elements) isolates active regulatory elements from human chromatin. Genome Res 17: 877–885 [DOI] [PMC free article] [PubMed] [Google Scholar]
- Guillemot F (2007) Spatial and temporal specification of neural fates by transcription factor codes. Development 134: 3771–3780 [DOI] [PubMed] [Google Scholar]
- Guo Z, Zhang L, Wu Z, Chen Y, Wang F, Chen G (2014) In vivo direct reprogramming of reactive glial cells into functional neurons after brain injury and in an Alzheimer's disease model. Cell Stem Cell 14: 188–202 [DOI] [PMC free article] [PubMed] [Google Scholar]
- Heinz S, Benner C, Spann N, Bertolino E, Lin YC, Laslo P, Cheng JX, Murre C, Singh H, Glass CK (2010) Simple combinations of lineage‐determining transcription factors prime cis‐regulatory elements required for macrophage and B cell identities. Mol Cell 38: 576–589 [DOI] [PMC free article] [PubMed] [Google Scholar]
- Hevner RF, Hodge RD, Daza RA, Englund C (2006) Transcription factors in glutamatergic neurogenesis: conserved programs in neocortex, cerebellum, and adult hippocampus. Neurosci Res 55: 223–233 [DOI] [PubMed] [Google Scholar]
- Hilton IB, D'Ippolito AM, Vockley CM, Thakore PI, Crawford GE, Reddy TE, Gersbach CA (2015) Epigenome editing by a CRISPR‐Cas9‐based acetyltransferase activates genes from promoters and enhancers. Nat Biotechnol 33: 510–517 [DOI] [PMC free article] [PubMed] [Google Scholar]
- Huang P, Kishida S, Cao D, Murakami‐Tonami Y, Mu P, Nakaguro M, Koide N, Takeuchi I, Onishi A, Kadomatsu K (2011) The neuronal differentiation factor NeuroD1 downregulates the neuronal repellent factor Slit2 expression and promotes cell motility and tumor formation of neuroblastoma. Cancer Res 71: 2938–2948 [DOI] [PubMed] [Google Scholar]
- Iacovino M, Bosnakovski D, Fey H, Rux D, Bajwa G, Mahen E, Mitanoska A, Xu Z, Kyba M (2011) Inducible cassette exchange: a rapid and efficient system enabling conditional gene expression in embryonic stem and primary cells. Stem Cells 29: 1580–1588 [DOI] [PMC free article] [PubMed] [Google Scholar]
- Imayoshi I, Kageyama R (2014) bHLH factors in self‐renewal, multipotency, and fate choice of neural progenitor cells. Neuron 82: 9–23 [DOI] [PubMed] [Google Scholar]
- Iwafuchi‐Doi M, Zaret KS (2014) Pioneer transcription factors in cell reprogramming. Genes Dev 28: 2679–2692 [DOI] [PMC free article] [PubMed] [Google Scholar]
- Jones S (2004) An overview of the basic helix‐loop‐helix proteins. Genome Biol 5: 226 [DOI] [PMC free article] [PubMed] [Google Scholar]
- Karolchik D, Barber GP, Casper J, Clawson H, Cline MS, Diekhans M, Dreszer TR, Fujita PA, Guruvadoo L, Haeussler M, Harte RA, Heitner S, Hinrichs AS, Learned K, Lee BT, Li CH, Raney BJ, Rhead B, Rosenbloom KR, Sloan CA et al (2014) The UCSC genome browser database: 2014 update. Nucleic Acids Res 42: D764–D770 [DOI] [PMC free article] [PubMed] [Google Scholar]
- Kim WY (2013) NeuroD regulates neuronal migration. Mol Cells 35: 444–449 [DOI] [PMC free article] [PubMed] [Google Scholar]
- Kriegstein A, Alvarez‐Buylla A (2009) The glial nature of embryonic and adult neural stem cells. Annu Rev Neurosci 32: 149–184 [DOI] [PMC free article] [PubMed] [Google Scholar]
- Kwan KY, Sestan N, Anton ES (2012) Transcriptional co‐regulation of neuronal migration and laminar identity in the neocortex. Development 139: 1535–1546 [DOI] [PMC free article] [PubMed] [Google Scholar]
- Kwiatkowski N, Zhang T, Rahl PB, Abraham BJ, Reddy J, Ficarro SB, Dastur A, Amzallag A, Ramaswamy S, Tesar B, Jenkins CE, Hannett NM, McMillin D, Sanda T, Sim T, Kim ND, Look T, Mitsiades CS, Weng AP, Brown JR et al (2014) Targeting transcription regulation in cancer with a covalent CDK7 inhibitor. Nature 511: 616–620 [DOI] [PMC free article] [PubMed] [Google Scholar]
- Langmead B (2010) Aligning short sequencing reads with Bowtie. Curr Prot Bioinformatics 32: 11.7 [DOI] [PMC free article] [PubMed] [Google Scholar]
- Lee JE, Hollenberg SM, Snider L, Turner DL, Lipnick N, Weintraub H (1995) Conversion of Xenopus ectoderm into neurons by NeuroD, a basic helix‐loop‐helix protein. Science 268: 836–844 [DOI] [PubMed] [Google Scholar]
- Lee JK, Cho JH, Hwang WS, Lee YD, Reu DS, Suh‐Kim H (2000) Expression of neuroD/BETA2 in mitotic and postmitotic neuronal cells during the development of nervous system. Dev Dyn 217: 361–367 [DOI] [PubMed] [Google Scholar]
- Li H, Handsaker B, Wysoker A, Fennell T, Ruan J, Homer N, Marth G, Abecasis G, Durbin R, Genome Project Data Processing S (2009) The sequence alignment/map format and SAMtools. Bioinformatics 25: 2078–2079 [DOI] [PMC free article] [PubMed] [Google Scholar]
- Li L (2009) GADEM: a genetic algorithm guided formation of spaced dyads coupled with an EM algorithm for motif discovery. J Comput Biol 16: 317–329 [DOI] [PMC free article] [PubMed] [Google Scholar]
- Lienert F, Mohn F, Tiwari VK, Baubec T, Roloff TC, Gaidatzis D, Stadler MB, Schubeler D (2011) Genomic prevalence of heterochromatic H3K9me2 and transcription do not discriminate pluripotent from terminally differentiated cells. PLoS Genet 7: e1002090 [DOI] [PMC free article] [PubMed] [Google Scholar]
- Ma Q, Kintner C, Anderson DJ (1996) Identification of neurogenin, a vertebrate neuronal determination gene. Cell 87: 43–52 [DOI] [PubMed] [Google Scholar]
- Magnusdottir E, Gillich A, Grabole N, Surani MA (2012) Combinatorial control of cell fate and reprogramming in the mammalian germline. Curr Opin Genet Dev 22: 466–474 [DOI] [PubMed] [Google Scholar]
- Marro S, Pang ZP, Yang N, Tsai MC, Qu K, Chang HY, Sudhof TC, Wernig M (2011) Direct lineage conversion of terminally differentiated hepatocytes to functional neurons. Cell Stem Cell 9: 374–382 [DOI] [PMC free article] [PubMed] [Google Scholar]
- Mohn F, Weber M, Rebhan M, Roloff TC, Richter J, Stadler MB, Bibel M, Schubeler D (2008) Lineage‐specific polycomb targets and de novo DNA methylation define restriction and potential of neuronal progenitors. Mol Cell 30: 755–766 [DOI] [PubMed] [Google Scholar]
- Osborne JK, Larsen JE, Gonzales JX, Shames DS, Sato M, Wistuba II, Girard L, Minna JD, Cobb MH (2013) NeuroD1 regulation of migration accompanies the differential sensitivity of neuroendocrine carcinomas to TrkB inhibition. Oncogenesis 2: e63 [DOI] [PMC free article] [PubMed] [Google Scholar]
- Osborne JK, Guerra ML, Gonzales JX, McMillan EA, Minna JD, Cobb MH (2014) NeuroD1 mediates nicotine‐induced migration and invasion via regulation of the nicotinic acetylcholine receptor subunits in a subset of neural and neuroendocrine carcinomas. Mol Biol Cell 25: 1782–1792 [DOI] [PMC free article] [PubMed] [Google Scholar]
- Oshlack A, Robinson MD, Young MD (2010) From RNA‐seq reads to differential expression results. Genome Biol 11: 220 [DOI] [PMC free article] [PubMed] [Google Scholar]
- Poulin G, Lebel M, Chamberland M, Paradis FW, Drouin J (2000) Specific protein‐protein interaction between basic helix‐loop‐helix transcription factors and homeoproteins of the Pitx family. Mol Cell Biol 20: 4826–4837 [DOI] [PMC free article] [PubMed] [Google Scholar]
- Rada‐Iglesias A, Bajpai R, Swigut T, Brugmann SA, Flynn RA, Wysocka J (2011) A unique chromatin signature uncovers early developmental enhancers in humans. Nature 470: 279–283 [DOI] [PMC free article] [PubMed] [Google Scholar]
- Robinson MD, McCarthy DJ, Smyth GK (2010) edgeR: a bioconductor package for differential expression analysis of digital gene expression data. Bioinformatics 26: 139–140 [DOI] [PMC free article] [PubMed] [Google Scholar]
- Sahu SK, Garding A, Tiwari N, Thakurela S, Toedling J, Gebhard S, Ortega F, Schmarowski N, Berninger B, Nitsch R, Schmidt M, Tiwari VK (2015) JNK‐dependent gene regulatory circuitry governs mesenchymal fate. EMBO J 34: 2162–2181 [DOI] [PMC free article] [PubMed] [Google Scholar]
- Schwab MH, Druffel‐Augustin S, Gass P, Jung M, Klugmann M, Bartholomae A, Rossner MJ, Nave KA (1998) Neuronal basic helix‐loop‐helix proteins (NEX, neuroD, NDRF): spatiotemporal expression and targeted disruption of the NEX gene in transgenic mice. J Neurosci 18: 1408–1418 [DOI] [PMC free article] [PubMed] [Google Scholar]
- Shen Y, Yue F, McCleary DF, Ye Z, Edsall L, Kuan S, Wagner U, Dixon J, Lee L, Lobanenkov VV, Ren B (2012) A map of the cis‐regulatory sequences in the mouse genome. Nature 488: 116–120 [DOI] [PMC free article] [PubMed] [Google Scholar]
- Shlyueva D, Stampfel G, Stark A (2014) Transcriptional enhancers: from properties to genome‐wide predictions. Nat Rev Genet 15: 272–286 [DOI] [PubMed] [Google Scholar]
- Simon JM, Giresi PG, Davis IJ, Lieb JD (2012) Using formaldehyde‐assisted isolation of regulatory elements (FAIRE) to isolate active regulatory DNA. Nat Protoc 7: 256–267 [DOI] [PMC free article] [PubMed] [Google Scholar]
- Sing T, Sander O, Beerenwinkel N, Lengauer T (2005) ROCR: visualizing classifier performance in R. Bioinformatics 21: 3940–3941 [DOI] [PubMed] [Google Scholar]
- Sommer L, Ma Q, Anderson DJ (1996) neurogenins, a novel family of atonal‐related bHLH transcription factors, are putative mammalian neuronal determination genes that reveal progenitor cell heterogeneity in the developing CNS and PNS. Mol Cell Neurosci 8: 221–241 [DOI] [PubMed] [Google Scholar]
- Spitz F, Furlong EE (2012) Transcription factors: from enhancer binding to developmental control. Nat Rev Genet 13: 613–626 [DOI] [PubMed] [Google Scholar]
- Stadler MB, Murr R, Burger L, Ivanek R, Lienert F, Scholer A, van Nimwegen E, Wirbelauer C, Oakeley EJ, Gaidatzis D, Tiwari VK, Schubeler D (2011) DNA‐binding factors shape the mouse methylome at distal regulatory regions. Nature 480: 490–495 [DOI] [PubMed] [Google Scholar]
- Subramanian A, Kuehn H, Gould J, Tamayo P, Mesirov JP (2007) GSEA‐P: a desktop application for gene set enrichment analysis. Bioinformatics 23: 3251–3253 [DOI] [PubMed] [Google Scholar]
- Taverna E, Gotz M, Huttner WB (2014) The cell biology of neurogenesis: toward an understanding of the development and evolution of the neocortex. Annu Rev Cell Dev Biol 30: 465–502 [DOI] [PubMed] [Google Scholar]
- Thakurela S, Garding A, Jung J, Schubeler D, Burger L, Tiwari VK (2013) Gene regulation and priming by topoisomerase IIalpha in embryonic stem cells. Nat Commun 4: 2478 [DOI] [PubMed] [Google Scholar]
- Tiwari VK, Burger L, Nikoletopoulou V, Deogracias R, Thakurela S, Wirbelauer C, Kaut J, Terranova R, Hoerner L, Mielke C, Boege F, Murr R, Peters AH, Barde YA, Schubeler D (2012a) Target genes of Topoisomerase IIbeta regulate neuronal survival and are defined by their chromatin state. Proc Natl Acad Sci USA 109: E934–E943 [DOI] [PMC free article] [PubMed] [Google Scholar]
- Tiwari VK, Stadler MB, Wirbelauer C, Paro R, Schubeler D, Beisel C (2012b) A chromatin‐modifying function of JNK during stem cell differentiation. Nat Genet 44: 94–100 [DOI] [PubMed] [Google Scholar]
- Trapnell C, Pachter L, Salzberg SL (2009) TopHat: discovering splice junctions with RNA‐Seq. Bioinformatics 25: 1105–1111 [DOI] [PMC free article] [PubMed] [Google Scholar]
- Trapnell C, Roberts A, Goff L, Pertea G, Kim D, Kelley DR, Pimentel H, Salzberg SL, Rinn JL, Pachter L (2012) Differential gene and transcript expression analysis of RNA‐seq experiments with TopHat and Cufflinks. Nat Protoc 7: 562–578 [DOI] [PMC free article] [PubMed] [Google Scholar]
- Vierbuchen T, Ostermeier A, Pang ZP, Kokubu Y, Sudhof TC, Wernig M (2010) Direct conversion of fibroblasts to functional neurons by defined factors. Nature 463: 1035–1041 [DOI] [PMC free article] [PubMed] [Google Scholar]
- Wamstad JA, Alexander JM, Truty RM, Shrikumar A, Li F, Eilertson KE, Ding H, Wylie JN, Pico AR, Capra JA, Erwin G, Kattman SJ, Keller GM, Srivastava D, Levine SS, Pollard KS, Holloway AK, Boyer LA, Bruneau BG (2012) Dynamic and coordinated epigenetic regulation of developmental transitions in the cardiac lineage. Cell 151: 206–220 [DOI] [PMC free article] [PubMed] [Google Scholar]
- Weidgang CE, Russell R, Tata PR, Kuhl SJ, Illing A, Muller M, Lin Q, Brunner C, Boeckers TM, Bauer K, Kartikasari AE, Guo Y, Radenz M, Bernemann C, Weiss M, Seufferlein T, Zenke M, Iacovino M, Kyba M, Scholer HR et al (2013) TBX3 directs cell‐fate decision toward mesendoderm. Stem Cell Rep 1: 248–265 [DOI] [PMC free article] [PubMed] [Google Scholar]
- Xie W, Schultz MD, Lister R, Hou Z, Rajagopal N, Ray P, Whitaker JW, Tian S, Hawkins RD, Leung D, Yang H, Wang T, Lee AY, Swanson SA, Zhang J, Zhu Y, Kim A, Nery JR, Urich MA, Kuan S et al (2013) Epigenomic analysis of multilineage differentiation of human embryonic stem cells. Cell 153: 1134–1148 [DOI] [PMC free article] [PubMed] [Google Scholar]
- Yue F, Cheng Y, Breschi A, Vierstra J, Wu W, Ryba T, Sandstrom R, Ma Z, Davis C, Pope BD, Shen Y, Pervouchine DD, Djebali S, Thurman RE, Kaul R, Rynes E, Kirilusha A, Marinov GK, Williams BA, Trout D et al (2014) A comparative encyclopedia of DNA elements in the mouse genome. Nature 515: 355–364 [DOI] [PMC free article] [PubMed] [Google Scholar]
- Zhang Y, Ng HH, Erdjument‐Bromage H, Tempst P, Bird A, Reinberg D (1999) Analysis of the NuRD subunits reveals a histone deacetylase core complex and a connection with DNA methylation. Genes Dev 13: 1924–1935 [DOI] [PMC free article] [PubMed] [Google Scholar]
- Zhang Y, Liu T, Meyer CA, Eeckhoute J, Johnson DS, Bernstein BE, Nusbaum C, Myers RM, Brown M, Li W, Liu XS (2008) Model‐based analysis of ChIP‐Seq (MACS). Genome Biol 9: R137 [DOI] [PMC free article] [PubMed] [Google Scholar]
- Zhu Y, Sun L, Chen Z, Whitaker JW, Wang T, Wang W (2013) Predicting enhancer transcription and activity from chromatin modifications. Nucleic Acids Res 41: 10032–10043 [DOI] [PMC free article] [PubMed] [Google Scholar]
Associated Data
This section collects any data citations, data availability statements, or supplementary materials included in this article.
Supplementary Materials
Appendix
Table EV1
Table EV2
Table EV3
Table EV4
Table EV5
Table EV6
Review Process File