

Abstract
Hypoxia is an intensively investigated condition with profound effects on cell metabolism, migration, and angiogenesis during development and disease. Physiologically, hypoxia is linked to tissue homeostasis and maintenance of pluripotency. Hypoxia also contributes to pathologies including cardiovascular diseases and cancer. Despite its importance, microscopic visualization of hypoxia is largely restricted to the detection of reductively activated probes by immunostaining. Here, we describe a novel family of genetically encoded fluorescent sensors that detect the activation of HIF transcription factors reported by the oxygen‐independent fluorescent protein UnaG. It comprises sensors with different switching and memory behavior and combination sensors that allow the distinction of hypoxic and reoxygenated cells. We tested these sensors on orthotopically transplanted glioma cell lines. Using a cranial window, we could visualize hypoxia intravitally at cellular resolution. In tissue samples, sensor activity was detected in regions, which were largely devoid of blood vessels, correlated with HIF‐1α stabilization, and were highly heterogeneous at a cellular level. Frequently, we detected recently reoxygenated cells outside hypoxic areas in the proximity of blood vessels, suggestive of hypoxia‐promoted cell migration.
Keywords: fluorescent protein, hypoxia, microscopy, sensor, UnaG
Subject Categories: Vascular Biology & Angiogenesis
Introduction
Hypoxia, a dysbalance between oxygen supply and consumption, plays a crucial role in developmental, regenerative, and pathological processes (Span & Bussink, 2015). A hypoxic niche supports pluripotency of stem cells in bone marrow (Mathieu et al, 2013; Muz et al, 2014; Spencer et al, 2014), and hypoxia causes the recruitment of inflammatory cells, promotes the progression of tumors to a more aggressive phenotype, mediates radio resistance, and enhances metastatic spread (Hockel & Vaupel, 2001; Chan & Giaccia, 2007; Semenza, 2012).
While incipient angiogenesis in small tumors may occur independently of hypoxia (Cao et al, 2005), growing tumors will at some point inevitably experience inadequate nutrient and oxygen supply (Hendriksen et al, 2009). This deprivation triggers an angiogenic switch, which is associated with reduced sensitivity to cytotoxic and genotoxic treatment and more aggressive metastatic behavior (Hanahan & Folkman, 1996). Therefore, precise knowledge of the hypoxic state of a tumor not only provides a valuable entry point to understanding tumor progression, but also holds considerable prognostic value (Bussink et al, 2003).
A collection of techniques are available to assess hypoxia in living tissues or tissue preparations (Kiyose et al, 2010; Cui et al, 2011). Assays that rely on tissue disaggregation or invasive polarographic needle and fluorescence‐based fiber‐optic probe measurements suffer from their inability to provide information on hypoxia and tissue architecture (Raleigh et al, 1996). When applied in vivo, nitroimidazole derivatives in the absence of oxygen reductively form tissue adducts (Kizaka‐Kondoh & Konse‐Nagasawa, 2009). For optical imaging, these adducts are stained with monoclonal antibodies postmortem. Labeling of hypoxia‐targeting molecules with positron‐emitting radionuclides allows non‐invasive live imaging, which provides the spatial distribution of the probe, however not at cellular resolution (Apte et al, 2011). Intravital determination of the partial oxygen pressure in the microvasculature has been achieved using multiphoton enhanced phosphorescent nanoprobes (Lecoq et al, 2011; Roussakis et al, 2014; Spencer et al, 2014). However, these rely on tissue perfusion as they are systemically applied via the circulation.
Central to the cellular hypoxia response is the hypoxia‐inducible factor (HIF) family of basic helix‐loop‐helix transcription factors that act on a wide array of hypoxia‐inducible genes (Fandrey et al, 2006; Semenza, 2011). HIFs act as heterodimers and are comprised of the oxygen‐independent β‐subunit (also called aryl hydrocarbon receptor nuclear translocator, ARNT) and an oxygen‐labile α‐subunit, which is rapidly degraded under normoxia or upon reoxygenation from a previously hypoxic state (Salceda & Caro, 1997). Proteasomal degradation is triggered by hydroxylation of two proline residues, which provides docking sites for the von Hippel–Lindau (VHL) tumor suppressor E3 ubiquitin ligase (Srinivas et al, 1999). The Fe(II)‐dependent HIF prolyl hydroxylases (PHD1‐3) are efficiently inhibited by transition metals such as Co2+ or iron chelators, and their target prolines are central to the oxygen‐dependent degradation domain (ODDD) in HIF‐α (Yuan et al, 2003; Fandrey et al, 2006; Cho et al, 2013). Additional hydroxylation of an Asn residue in the transactivation domain by the factor inhibiting HIF (FIH) results in suppressed transcriptional activity (Lando et al, 2002). Abating PHD and FIH activity due to reduced O2 tension results in HIF‐α stabilization, translocation into the nucleus, and binding to HIF‐β. The HIF‐α/β heterodimer then activates transcription from promoter regions of genes that contain hypoxia‐responsive elements (HREs: 5′‐RCGTG‐3′ with R=A,G), including the genes for vascular endothelial growth factor (VEGF‐A), carbonic anhydrase IX (CA9), the glucose transporters (Glut‐1 and Glut‐3), and erythropoietin (Wenger et al, 2005).
Given the existence of positively hypoxia‐responsive promoter elements, but also specific oxygen‐dependent destruction domains, it should be possible to design genetically encoded hypoxia reporters, with the promise of tissue‐wide hypoxia visualization at cellular resolution (Harada et al, 2007; Fomicheva et al, 2008). While seemingly straightforward, a combination of these regulatory elements with fluorescent GFP or RFP proteins is ill‐fated, because both of these protein families must undergo an essential maturation process comprising torsional rearrangement, cyclization, and oxidation that requires molecular oxygen, to adopt their fluorescent state (Heim et al, 1994; Coralli et al, 2001; Shaner et al, 2005; Remington, 2006; Cecic et al, 2007).
Here, we describe a novel family of genetically encoded hypoxia sensors, which are based on a recently identified, fluorescent protein from Japanese freshwater eel, UnaG (Kumagai et al, 2013). In contrast to the GFP and RFP fluorescent protein families, UnaG does not rely on molecular oxygen to adopt the fluorescent state. In these sensors, the combination of genetically and protein‐encoded regulatory elements confers hypoxia‐mediated expression. Through constitutive or hypoxia‐mediated degradation sensitivity, memory and switching behavior of these reporter constructs were tuned to suit various intravital applications. Further, the combination of oxygen‐sensitive fluorescent proteins with UnaG results in hypoxia and reoxygenation reporters that unequivocally document the recent hypoxia history of cells in vivo in a dynamic fashion.
Results
UnaG‐based sensors allow efficient hypoxia sensing at cellular level
To avoid the limitations imposed by oxygen‐dependent maturation of GFP and RFP, we designed a UnaG‐based, genetically encoded hypoxia sensor for light microscopy (Fig 1A), which uses an established hypoxia‐responsive promoter (Semenza et al, 1991). Five copies of a 35‐bp hypoxia‐responsive element (HRE) derived from the enhancer region of the human VEGFA gene (Shibata et al, 2000) confer oxygen sensitivity to a minimal human cytomegalovirus (CMV) promoter, which drives UnaG expression. To enhance protein turnover and hence dynamic behavior, a PEST (Rogers et al, 1986; Li et al, 1998) sequence motif was fused in‐frame to the C‐terminus of UnaG. All constructs in this study share the same vector backbone. For simplicity, we refer to them by a combination of the fluorescent protein name and the destabilization sequence (except for the hypoxia–reoxygenation reporter dUnOHR).
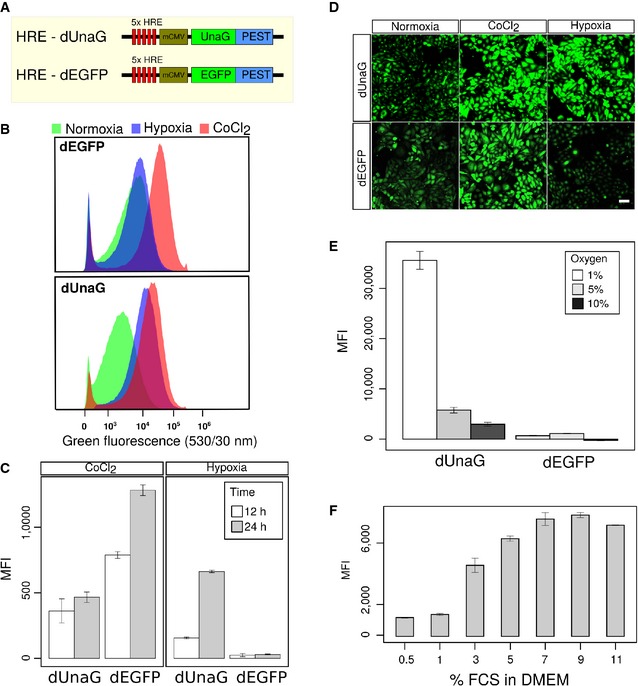
Figure 1. An UnaG‐based hypoxia sensor efficiently indicates hypoxic growth conditions in CHO cells.
-
ASchematic representation of sensor constructs for the hypoxia‐inducible expression of fluorescent proteins. Five HRE sequence motifs derived from the enhancer region of the VEGFA gene confer hypoxia‐specific activity upon the CMV minimal (mCMV) promoter. Fluorescent proteins are destabilized by in‐frame fusion of a PEST sequence from mouse ornithine carboxylase gene. The EGFP‐encoding construct was obtained from Addgene (#46926).
-
B–DComparative characterization of CHO cell bulk transfection cultures, selected for stable expression of the dUnaG‐ or dEGFP‐encoding reporter constructs. Flow cytometry (B) revealed an efficient induction of green fluorescence, after the treatment of both dUnaG‐ and dEGFP‐expressing CHO bulk cultures with CoCl2, while growth under hypoxia (1% oxygen) for 12 h selectively induced green fluorescence only in dUnaG‐expressing cells. Under normoxia (21% oxygen), only background fluorescence was observed. (C) Assessment of the mean fluorescence intensity (MFI) to determine the activity of the 5x HRE‐CMV promoter after 12 and 24 h. Fluorescence intensity increased between 12 and 24 h. (D) Representative images of dUnaG‐ or dEGFP‐expressing CHO cells grown under either normoxia (21% oxygen), CoCl2 treatment, or hypoxia (1% oxygen) for 12 h. Scale bars, 50 μm.
-
EFluorescence intensity in dUnaG‐ or dEGFP‐expressing CHO cell bulks grown under increasingly hypoxic conditions of 10%, 5%, and 1% oxygen for 24 h indicated an efficient induction of the dUnaG sensor at oxygen concentrations below 5%.
-
FMaximal fluorescence of the dUnaG‐based hypoxia reporter in CHO cells grown at 1% oxygen for 24 h was only observed at serum concentrations of 5% FCS or higher, reflecting the dependence of UnaG on its serum cofactor bilirubin.
We tested the efficiency of the UnaG‐based sensor by comparing it to an available variant, which in the same vector backbone harbors dEGFP instead of dUnaG (Vordermark et al, 2001). To avoid the effects of clonal variation, we used CHO bulk cultures, stably transfected with the indicated constructs, throughout this study. In the presence of 25 mM of the hypoxia‐mimetic CoCl2, which resulted in robust HIF‐1α stabilization (Fig EV1A), intense fluorescence was induced in both dUnaG‐ and dEGFP‐expressing cells, demonstrating the functionality of the sensor constructs (Fig 1B). In clear contrast, only the UnaG‐based sensor displayed an induction of fluorescence under hypoxia, which was induced in cultures that were grown at 1% oxygen.
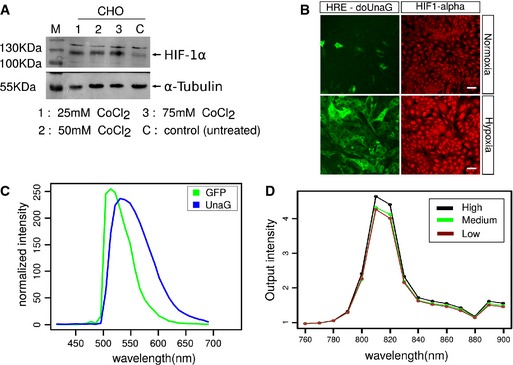
Figure EV1. Induction of HIF‐1α in CHO cells and spectral properties of UnaG.
-
ACulture in the presence of the hypoxia‐mimetic CoCl2 resulted in an efficient induction of HIF‐1α stabilization in CHO cells. CHO cells were plated in 5‐cm round bottom dishes at 60% confluency, and CoCl2 was added to the dishes at the indicated concentrations. 24 h after the treatment, cells were harvested and lysed and HIF‐1α expression was analyzed by Western blotting. M, molecular mass marker.
-
BStabilization of HIF‐1α correlated with the induction of doUnaG fluorescence in cells cultured for 24 h in the presence of 1% oxygen. HIF‐1α was visualized by immunostaining. Scale bar, 50 μm.
-
C, DCharacterization of the spectral properties of dUnaG expressed in CHO cells. (C) Comparison of the fluorescence properties of EGFP and UnaG expressed in CHO cells in single photon microscopy. CHO cell bulk cultures expressing either dUnaG or dEGFP were plated in IBIDI chambers and incubated for 24 h under hypoxia (1% oxygen) before imaging. Cultures expressing either fluorescent protein were then excited at 488‐nm wavelength and emission fluorescence was recorded using the lambda scan mode on a Zeiss LSM780 confocal microscope. Plotted is the normalized fluorescence output for dEGFP and dUnaG, showing the wider fluorescence spectrum of dUnaG as compared to dEGFP. (D) dUnaG is efficiently excited at 810 nm in multiphoton microscopy. Excitation wavelength scan of dUnaG‐expressing CHO cells previously kept under hypoxia for 24 h using a multiphoton microscope. The wavelength of excitation light produced by a titanium sapphire laser was increased from 760 to 900 nm, and a single image was acquired at 10‐nm step width using the wavelength scan mode of the LaVision Biotech Imspector Pro software. Relative fluorescence values were normalized to the square of the laser output. Three cells with high, low, and medium expression of UnaG were selected for analysis.
In both cases, culture in the presence of 25 mM CoCl2 or at 1% oxygen, we noted an increase in the mean fluorescence intensity between 12 and 24 h of incubation, suggesting that only after 24 h, the system had reached an equilibrium between synthesis and degradation (Fig 1C). Consistent with our previous results, dEGFP failed to show fluorescence enhancement under hypoxia. The spectral properties of dEGFP and dUnaG were largely comparable, with dUnaG displaying a wider emission spectrum (Fig EV1C). We were therefore able to observe dUnaG‐ and dEGFP‐expressing cells side by side in different wells of the same chamber slide, which allowed us to use the same acquisition settings and readily replicated the flow cytometric analysis using live cell microscopy (Fig 1D).
In cultures grown under increasing oxygen tension, we observed decreasing dUnaG activation when the oxygen concentration was raised to 5%, while again dEGFP did not provide an enhanced fluorescence signal at all the oxygen concentrations tested (Fig 1E). UnaG fluorescence depends on non‐covalent binding to its cofactor bilirubin (Kumagai et al, 2013). In tissue culture, bilirubin is supplied as a serum constituent in the medium, in our culture conditions at 2 μg/ml. We assessed UnaG fluorescence under different serum concentrations ranging from 0.5% to 11% (v/v) of the culture medium. After 24‐h culture under hypoxia, UnaG fluorescence showed no further increase at serum concentrations higher than 5% (v/v) FCS, which corresponds to a 3.5 μM concentration of bilirubin (Fig 1F). In summary, our results demonstrate the usability of a destabilized version of UnaG to design an efficient genetically encodable hypoxia sensor.
Tuning of UnaG destabilization generates kinetically diverse sensors
Kinetic properties of a fluorescent sensor are essentially determined by the lifetime of the fluorescent protein. To design hypoxia sensors with different properties, we created variants of the basic UnaG sensor, in which UnaG is destabilized by fusion to a PEST sequence, the oxygen‐dependent degradation domain (ODDD) of HIF‐1α or both (Fig 2A). We compared the behavior of these sensor variants in long‐term live cell imaging experiments, in which we acquired image stacks every 5 min, under hypoxia followed by normoxia (Fig 2B).
Figure 2. UnaG‐based hypoxia sensor kinetics can be tuned by fusion to different protein destabilization domains.
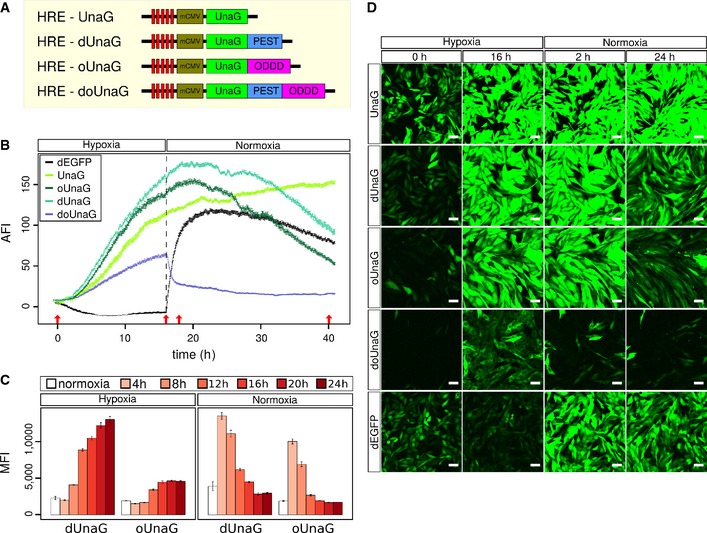
- Schematic representation of the different variants of UnaG used in the four indicated hypoxia reporter constructs. dUnaG is identical to Fig 1A, oUnaG is destabilized by in‐frame fusion with the oxygen‐dependent degradation domain sequence (ODDD) from HIF‐1α (aa 338–608), and doUnaG is destabilized by both degradation motifs.
- Microscopic assessment of the averaged fluorescence intensity (AFI) of CHO cell bulk cultures stably expressing the indicated UnaG variants or destabilized EGFP. Expression under hypoxia was induced by incubation in 1% oxygen for 16 h, and then, culture was continued for 24 h under normoxia. Fluorescence hysteresis after switching to normoxia was markedly reduced in the singly destabilized UnaG variants, while the doubly destabilized doUnaG displayed the most rapid switching behavior, but the least brightness. To reduce phototoxicity, illumination intensity was kept minimal. Data points represent one viewfield of 425 μm2 ± SEM.
- Flow cytometric analysis of the induction and decay kinetics of the fluorescence intensity in CHO cells stably expressing either dUnaG or oUnaG. Open bars represent control cultures grown under normoxia. Solid bars indicate culture for 4, 8, 12, 16, 20, or 24 h under hypoxia (1% oxygen). To assess deactivation, cultures previously kept under hypoxia (1% oxygen) for 24 h were shifted to normoxia (21% oxygen) for the indicated times. Error bars represent SE.
- Representative maximum intensity projections (MIPs) from the life cell cultures depicted in (B). Cells were grown for the indicated times at hypoxic (1% oxygen) conditions and subsequently switched for the indicated times to normoxia (21% oxygen) (red arrows in B) to illustrate the dynamics of the different UnaG‐based hypoxia sensors. Increasing destabilization is associated with reduced brightness but also reduced background and improved switching behavior. Scale bars, 50 μm.
Native UnaG (without any destabilization sequence) displayed a higher background fluorescence compared to destabilized forms, reflecting the protein half‐life and leakiness of the 5x HRE‐mCMV promoter (Fig 2D). In addition, fluorescence intensity was mildly increased even after reoxygenation, due to its high protein stability (Fig 2B and D). We determined a half‐life of approximately 20.0 h for UnaG after shift to normoxic conditions (Fig EV2A). In comparison, background fluorescence was significantly lower for dUnaG and further reduced for the oUnaG sensor, where ODDD‐mediated destabilization is driven by oxygen (Fig 2B). Background fluorescence was undetectable for the doubly destabilized doUnaG sensor. In the same order, the proteins showed an increasingly shorter lifetime after reoxygenation with a half‐life of 7.8 h for dUnaG, 5.5 h for oUnaG, and 30 min for doUnaG (Figs 2B and C, and EV2B). As expected, the switching kinetics were faster for the stronger destabilized UnaG versions. The very fast switching of doUnaG is, however, achieved at the cost of a rather less bright sensor (Video EV1).
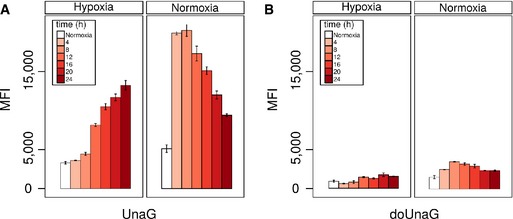
Figure EV2. Cytometric analysis of the expression kinetics of the two UnaG‐based hypoxia sensor variants HRE‐UnaG and HRE‐doUnaG.
-
A, BFlow cytometric analysis of the induction and decay kinetics of the fluorescence of UnaG (A) and doUnaG (B) in CHO cells stably expressing either variant. Open bars represent control cultures grown under normoxia. Solid bars indicate cultures grown for 4, 8, 12, 16, 20, or 24 h under hypoxia (1% oxygen) to activate the sensor or for the same time under normoxia (21% oxygen) to deactivate the sensor. Deactivation was initiated after the cells were grown under hypoxia (1% oxygen) for 24 h. Error bars represent SE.
Under the same conditions, the dEGFP sensor showed a decay of fluorescence under hypoxia, which likely reflected the degradation of mature protein that formed under normoxic conditions due to promoter leakiness. At the same time, newly synthesized protein accumulated, but failed to complete the oxidation step of maturation, which was then instantaneously initiated after reoxygenation, resulting in a steep fluorescence increase, followed by fluorescence decline due to the combined effect of promoter shutdown and proteolytic degradation.
Our results show that by varying the protein stability of UnaG, hypoxia sensors with different switching kinetics can be produced, which will retain memory of hypoxia in a designable fashion.
The hypoxia sensor dUnaG faithfully marks cells with stabilized, nuclear HIF‐1α in vivo
We wondered whether the UnaG‐based hypoxia sensors were applicable in vivo. To test their suitability to visualize hypoxia in tumor tissue, we stably transfected mCherry‐expressing Gli36 human glioblastoma cells with the dUnaG sensor construct. We recovered the developing tumors and surrounding cortex 10 days after orthotopic transplantation into SCID mice and prepared thick (30‐μm) sections for analysis. We identified blood vessels by PECAM‐1 staining (Fig 3A). Within the tumor tissue that was sharply demarked by mCherry expression, the green fluorescence of dUnaG was readily detected without the need for additional immunostaining. We were positively surprised by the brightness of dUnaG in sections, which exceeded the fluorescence intensities, we had observed in vitro. As expected, UnaG was preferentially clustered in poorly vascularized areas (Fig 3A and B). Of note, we frequently observed individual dUnaG‐expressing cells in close proximity to blood vessels, which we interpreted as an indication of cells relocating from hypoxic areas (Fig 3B).
Figure 3. An UnaG‐based hypoxia sensor faithfully marks areas of HIF‐1α stabilization in a mouse model of glioblastoma growth.
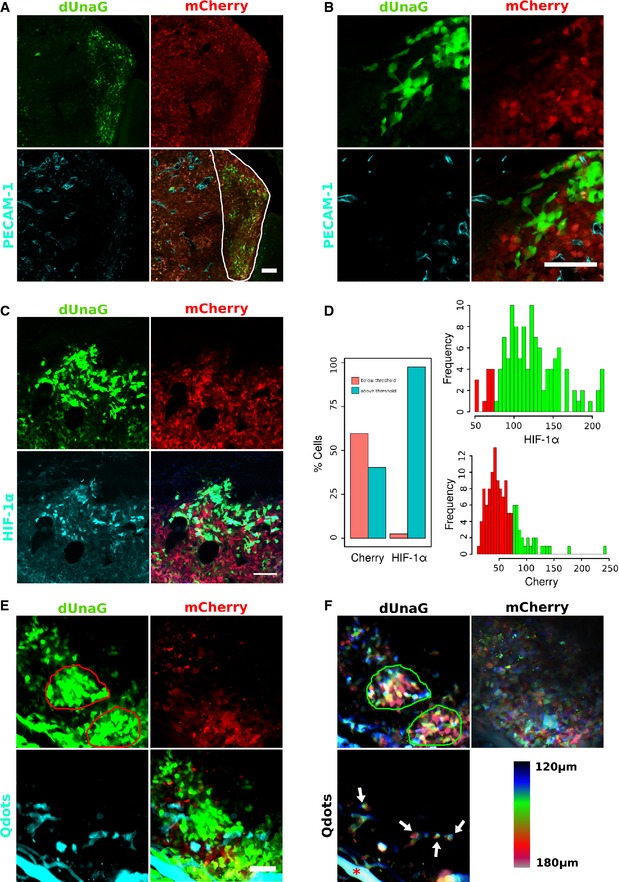
- UnaG‐based hypoxia sensing is applicable in vivo as shown here using the human Gli36 glioblastoma model. Five hundred Gli36 glioblastoma cells, constitutively expressing mCherry and stably transfected with the HRE‐dUnaG sensor construct, were stereotactically transplanted into the cortex of a SCID mouse. Shown is a 30‐μm cryosection of a growing tumor 10 days after transplantation. Tumor cells are distinguished from the surrounding cortex by mCherry expression. Blood vessels were contrasted by immunostaining against PECAM‐1. Expression of dUnaG was visualized by its green fluorescence and predominates in areas with reduced vascular density (outlined by white line in the composite panel, bottom right).
- Representative area from the tumor shown in (A), which is located outside the viewfield in (A) positioned more closely to the tumor border. Also at the tumor border UnaG‐expressing cells are preferentially observed at a distance to PECAM‐1+ vessels.
- Areas of dUnaG expression correlate well with HIF‐1α stabilization. Immunostaining for HIF‐1α (cyan) revealed the predominantly nuclear localization of stabilized HIF‐1α in the cells that were also dUnaG positive (green).
- Analysis of dUnaG‐expressing cells in (C) for mCherry fluorescence and HIF‐1α stabilization. dUnaG‐positive cells were classified according to their average fluorescence intensity into background level and above background level expression for mCherry and HIF‐1α. The threshold was set in either case to channel 70 of 256 intensity channels. Using this classification, > 60% of UnaG‐positive cells displayed only background level of mCherry fluorescence. On the other hand, > 98% of the UnaG‐expressing cells also expressed HIF‐1α, which together suggests that here UnaG acts preferentially as a hypoxia sensor in vivo.
- The dUnaG‐based senor was efficiently applied in intravital microscopy. One hundred Gli36 glioblastoma cells stably expressing mCherry and harboring the dUnaG sensor construct were positioned at 200 μm depth subcortically in a SCID mouse and observed 4 days later through a cranial window using multiphoton microscopy. We noted two distinct areas of intense UnaG fluorescence (red lines). Shown is a MIP of a 60‐μm z‐stack. The vasculature was contrasted by intravenous injection of non‐functionalized Qdots.
- Depth color coding of the MIP shown in (E) revealed the spatial relation between the vasculature (contrasted by Qdots), areas of increased dUnaG expression (bordered by green lines), and tumor cells expressing residual levels of mCherry. The hypoxic areas were located toward the top of the imaged tissue cube and therefore at different levels compared to the large vessel at the lower left corner (red asterisk) and the smaller vessels with a more axial orientation (white arrows).
Immunostaining confirmed the expected preferential nuclear localization of stabilized HIF‐1α and revealed that > 95% of the dUnaG‐expressing cells also stained for nuclear HIF‐1α (Fig 3C and D). We noted that cells expressing dUnaG to a large fraction (> 60%) displayed reduced mCherry fluorescence at or below background level, which we interpreted as the consequence of impaired mCherry maturation due to a hypoxic environment (Fig 3C and D).
Being genetically encoded, the dUnaG reporter should be perfectly suited for intravital imaging. To test its principal applicability, we recorded the multiphoton excitation spectrum of dUnaG in stably transfected CHO cells and determined the optimal wavelength of excitation to be between 800 and 820 nm (Fig EV1C and D). Having established the parameters for multiphoton imaging, we orthotopically transplanted Gli36 cells stably transfected with a mCherry expression vector and dUnaG into SCID mice, to which a cranial window had been applied.
In accordance with the postmortem analysis, dUnaG‐expressing cells were readily detected as clusters in sparsely vascularized tumor regions (note hypoxic islands bounded by red line in Fig 3E). In maximum intensity projections (MIPs) (Fig 3E, bottom right panel), we noted an apparent overlap between sites of hypoxia and blood vessels. To resolve this aspect, we performed depth color coding, which revealed a significant axial distance between vessels and hypoxic cell clusters. In Fig 3F, both hypoxic islands are located toward the top of the imaged tissue volume, indicated by the predominance of purple, red, and yellow‐green colors in the depth color coding. The two large, perfused vessels at lower edge (see Fig 3E Qdots, depicted in turquoise) are located at the bottom of the imaged tissue cube (indicated by preferentially dark blue and azure depth coding). The depth color coding also showed that the mCherry‐positive cells within the bounded hypoxic region at the bottom right are located at the bottom of the imaged tissue cube (indicated by preferentially dark blue depth coding). Hence, these tumor cells reside underneath the hypoxic cap and are flanked by a large perfused vessel, which likely provides sufficient oxygen to upkeep the residual mCherry signal.
Taken together, we demonstrate here the applicability on the dUnaG sensor in vivo and provide evidence that this sensor marks hypoxic areas in progressing tumors.
A d(UnaG‐mOrange) fusion protein can be employed as a hypoxia–reoxygenation sensor to reveal cells with a recent hypoxic history
We hypothesized that a combination of the unique oxygen‐independent and oxygen‐dependent maturation properties of UnaG and mOrange should allow the design of a sensor that reports the recent hypoxic history of cells and displays oxygen levels at cellular resolution. To this end, we designed and evaluated a number of sensor constructs (Figs 4 and EV3). Here, we describe the characterization and application of the sensor construct dUnOHR, comprising an in‐frame fusion protein of UnaG and mOrange, which is destabilized by an ornithine decarboxylase PEST sequence (Fig 4A). The nomenclature dUnOHR indicates the fusion of UnaG and mOrange as well as the intended use of this construct under hypoxia–reoxygenation conditions.
Figure 4. Retrospective assessment of the recent HIF‐1 activity in individual cells by an UnaG‐mOrange hypoxia–reoxygenation fusion sensor.
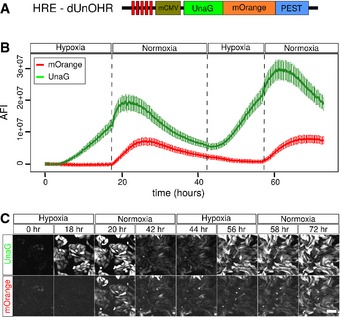
- Schematic representation of the dUnOHR hypoxia–reoxygenation sensor. A PEST‐destabilized fusion protein of UnaG and mOrange is expressed from the hypoxia‐sensitive HRE‐mCMV promoter. Under hypoxic conditions, only the UnaG component of the fusion protein is capable of adopting the fluorescent state, while mOrange is expressed and folds, but fails to mature, which requires higher oxygen concentrations.
- Microscopic assessment of the averaged fluorescence intensity (AFI) in CHO cells stably transfected with the dUnOHR sensor. Hypoxia was induced by incubation in 1% oxygen for 18 h, and then, the culture was switched to normoxia for 24 h, followed by another 14‐h hypoxia and finally normoxia again. As expected, UnaG fluorescence is efficiently induced under hypoxia, while mOrange fluorescence appears after the switch to normoxia only. The increase in both green and orange fluorescence is limited under normoxia by the subsiding HRE‐mCMV promoter activity. This behavior is repeated in subsequent hypoxia–normoxia cycles. The increase in absolute fluorescence intensity is due to the proliferation during the 72‐h culture period. Plotted is the average of the mean ± SEM.
- Visualization of the fluorescence of the dUnOHR reporter during alternating hypoxia– normoxia cycles as described in (B). MIPs of life cell cultures stably transfected with the dUnOHR sensor construct illustrate the temporally asynchronous fluorescence of UnaG and mOrange. Scale bars, 100 μm.
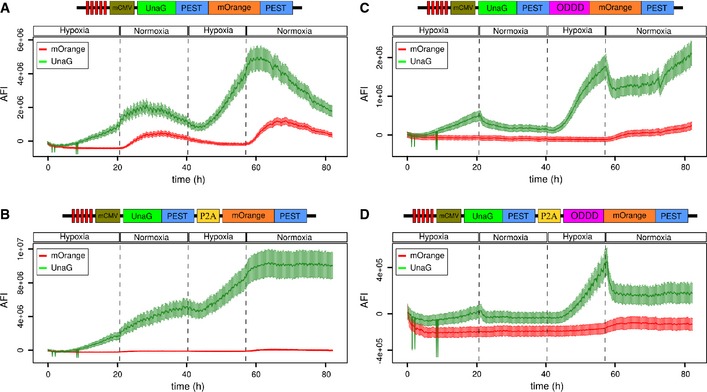
Figure EV3. Characterization of several variants of a destabilized UnaG‐mOrange hypoxia–reoxygenation combination sensor.
-
AThe UnaG‐PEST‐mOrange‐PEST fusion in‐frame protein is induced under hypoxia, while mOrange fluorescence becomes detectable after switch to normoxia. This construct behaved similar to the dUnOHR (UnaG‐mOrange‐PEST) sensor. The increase in both green and orange fluorescence was limited under normoxia by the subsiding promoter activity. This behavior was repeated in subsequent hypoxia–normoxia cycles.
-
BThe UnaG‐PEST‐P2A‐mOrange‐PEST sensor was induced under hypoxia, but failed to decay under normoxia; simultaneously, orange fluorescence failed to become detectable. UnaG fluorescence further increased during the subsequent hypoxia cycle and then plateaued, while orange remained undetectable; hence, this sensor was not followed further.
-
C, DUnaG was induced in both UnaG‐PEST‐ODDD‐mOrange‐PEST and UnaG‐PEST‐P2A‐ODDD‐mOrange‐PEST, was reduced under normoxia, and fluorescence kinetics were similar to the UnaG‐PEST‐ODDD (doUnaG) fusion protein (Fig 2B). In both sensors, orange fluorescence remained largely undetectable, severely limiting their applicability.
We confirmed the expected behavior of dUnOHR in live cell imaging experiments, in which we recorded both UnaG and mOrange fluorescence. To minimize phototoxicity during the long‐term measurement, we used the minimal possible excitation light intensity, which precluded the use of online fingerprinting. Because of the broad emission spectrum of UnaG, we excited mOrange at 561 nm and only collected fluorescence emission at wavelengths > 600 nm. This minimized bleed through from UnaG, but sacrificed a considerable amount of mOrange signal. In cultures grown under normoxia, where the promoter is inactive, dUnOHR produced virtually no background signal (Fig 4B and C, Video EV2). During repetitive hypoxia–normoxia cycles, we observed the expected increase in the UnaG signal under hypoxia, while fluorescence of the mOrange moiety remained undetectable. Following reoxygenation, a limited increase in UnaG fluorescence preceded promoter shutdown and decay. Simultaneously, the mOrange chromophore matured and mOrange fluorescence became detectable and subsequently also decayed. This behavior repeated in a subsequent hypoxia–reoxygenation cycle (Fig 4B and C, Video EV2). The higher signal increase in the second reoxygenation cycle in comparison with the first one is due to the proliferation of cells in the live cell culture.
The unique properties of the dUnOHR sensor allow the discrimination of hypoxic and reoxygenated cells. Hypoxic cells display only UnaG fluorescence, while recently reoxygenated cells display the both UnaG and mOrange fluorescence.
Visualization of the oxygenation history with dUnOHR suggests frequent movement of cells from hypoxic to reoxygenated areas
To take advantage of the unique properties of dUnOHR in vivo, we orthotopically transplanted Gli36 cells stably transfected with this sensor into SCID mice. We recovered the developing tumors and adjacent tissue 10 days later and generated 30‐μm sections for analysis. As previously observed for the dUnaG sensor, the dUnOHR sensor marked clusters of cells in hypovascularized areas, which were identified by sparse or absent PECAM‐1 immunostaining (Fig 5A–C). The majority of these cells only displayed UnaG fluorescence. A fraction of cells in addition expressed mOrange, and very frequently, such cells were found at the border of UnaG‐positive cluster, often seen in proximity to the nearest blood vessels. We interpreted these observations as a sign of recent relocation into the reoxygenation zone at the border of the hypoxic area. This may suggest that a fraction of hypoxic cells display a tendency to emigrate from the hypoxic environment toward areas of higher oxygen tension (Fig 5B and C).
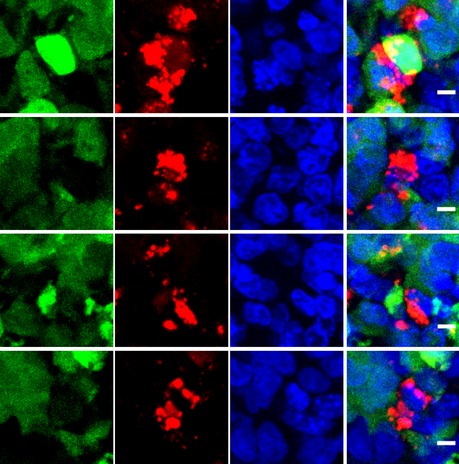
Figure 5. Preferential localization of cells that have undergone recent reoxygenation to the edge of hypoxic areas.
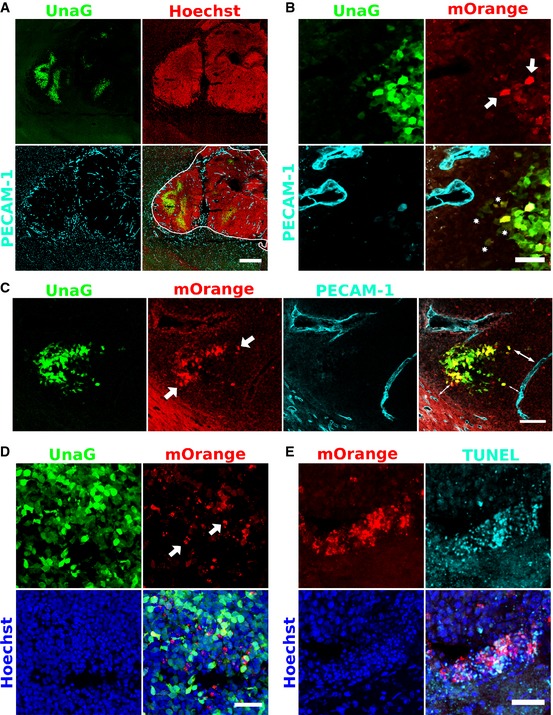
- Overview of a tumor induced by deep cortical deposition of approximately 500 Gli36 cells stably transfected with the dUnOHR sensor construct. The perimeter of the developing tumor (white line in the merged picture, lower right panel) was delineated by Hoechst 33342 staining. As observed for dUnaG, the reoxygenation sensor was expressed in compact areas with low vascular density. Vascular endothelium was identified by PECAM‐1 staining. 30‐μm thick cryosection. Scale bar, 500 μm.
- Details of the tumor shown in (A). Sparse, distinct cells are characterized by intense green and orange fluorescence (shown as yellow in the merged panel) and are located preferentially to the edge of the hypoxic phalanx (white arrows). A number of cells in close proximity of the nearest blood vessel display weak green and orange fluorescence (asterisks), indicative of previously hypoxic environment and subsequent reoxygenation. Scale bar, 50 μm.
- Recently reoxygenated cells (arrows) cluster at the edge of hypoxic areas and are often detected in the proximity of vessels with a homogeneous caliber (double arrows). Scale bar, 100 μm.
- Previously hypoxic cells frequently undergo apoptosis after reoxygenation. We noted an accumulation of intensely orange fluorescing spots (white arrows) at the edges of compact UnaG‐positive areas. Scale bar, 50 μm.
- TUNEL staining of tumor sections revealed that the tissue areas rich in intense mOrange aggregates colocalized with areas of increased apoptosis. Scale bar, 50 μm.
At the edges of hypoxic clusters, we frequently observed intensely fluorescing mOrange spots. Imaging at high resolution revealed that cells, which harbor these spots, also displayed signs of nuclear and cytoplasmic fragmentation indicative of an apoptotic fate (Figs 5D and EV4). To confirm this assumption, we performed TUNEL staining on tissue sections and found a pronounced colocalization between cells rich in orange spots and TUNEL‐positive cells (Fig 5E).
Figure EV4. Increased cell fragmentation of reoxygenated cells.
High‐resolution imaging of a tumor formed by intracranial injection of 500 Gli36 cells stably transfected with the dUnOHR sensor. Tissue was counterstained by Hoechst 33342. Intense mOrange‐containing aggregates were observed preferentially in the cells that displayed signs of nuclear and cytoplasmic fragmentation indicative of apoptotic decay and located at the edge of hypoxic areas. Scale bar, 5 μm.
Taken together, we demonstrate here that the dUnOHR sensor can be used in vivo and allows, in addition to a visualization of hypoxic cells, the identification of cells that were recently reoxygenated.
Discussion
We describe here a novel family of sensor constructs for the visualization of tissue hypoxia in light microscopy. These sensors are based on a HIF‐inducible minimal CMV promoter driving the expression of destabilized versions of the fluorescent protein UnaG, which does not rely on molecular oxygen for its fluorescent maturation (Kumagai et al, 2013; Mishin et al, 2015). These sensor constructs are genetically encodable and hence do not rely on the administration or tissue penetration of reagents. Because the spectral properties of UnaG are very close to those of the widely used Aequorea GFP, this sensor family is compatible with existing widefield fluorescent microscopes and is also applicable for intravital approaches using multiphoton microscopy.
Through tuned destabilization of the lifetime of the fluorescent reporter UnaG, switching kinetics were adjusted, which allows the design of reporters for various tasks, ranging from constructs with long memory to rapid visualization of changing tissue oxygen levels.
Two observations made us rather confident that this reporter approach truly detects hypoxic cells in vivo. First, activation of our reporter constructs coincided with the stabilization of nuclear HIF‐1α in vitro and in vivo. Second, cells that expressed the reporter displayed a significantly reduced fluorescence of coexpressed mCherry, indicative of impaired chromophore stabilization due to an insufficient oxygen tension. While hypoxia‐independent activation of HIF‐1α signaling has been described, orchestration of the hypoxia response appears to be the central and by far predominant function of this transcription factor family.
In tissue culture, our sensor constructs became first detectable around 5% oxygen and reached full activity at 1% oxygen, which corresponds to 7.5 mm Hg and coincides well with the reported threshold of 10 mm Hg for the induction of a tissue hypoxia response (Hockel & Vaupel, 2001; Span & Bussink, 2015).
Acquisition of the fluorescent state of UnaG depends on non‐covalent binding of its cofactor bilirubin (Kumagai et al, 2013). In tissue culture, bilirubin is supplied as a constituent of fetal calf serum (FCS). In the absence of bilirubin‐depleted serum, we varied the FCS concentration in the growth medium and consequently the bilirubin concentration. UnaG fluorescence remained stable from 5% or higher FCS reconstitution. We cannot preclude an influence of serum concentrations less than 5% on UnaG biosynthesis, due to the overall reduced cellular activity. However, increasing serum concentrations beyond 5% FCS did not result in a proportional increase in UnaG fluorescence, suggesting that a concentration of 5% FCS that corresponding to 3.5 μM bilirubin suffices for maximal UnaG fluorescence.
In our in vivo experiments, we readily detected UnaG fluorescence in glioblastoma samples without enhancement by immunostaining or provision of exogenous cofactor, suggesting that despite the blood–brain barrier, sufficient bilirubin is ubiquitously provided by the circulation or locally.
Sensors combining oxygen‐dependent and oxygen‐independent proteins will allow the design of probes with enhanced functionalities, like ratiometric sensors to measure absolute oxygen levels in tissue. We have taken a first step in this direction with the design of dUnOHR, which reports the recent hypoxic history of cells. Our observations suggest that upon reoxygenation previously hypoxic tumor cells display a propensity to undergo apoptotic cell death. Hypoxia‐induced apoptosis is well described and has previously been reported to rely on HIF‐1‐dependent, but also HIF‐1‐independent genes (Carmeliet et al, 1998; Malhotra et al, 2001).
We frequently observed a small fraction of reoxygenated cells in proximity to blood vessels, indicative of their migration from a hypoxic zone. This interpretation is supported by previous reports demonstrating that hypoxia enhances the metastatic potential of breast cancer cells into bone marrow and HIF‐1α downregulation by siRNA reduces glioma cell invasiveness in various tumor models (Fujiwara et al, 2007). The speed of slowly migrating large polarized cells in 3D matrices was determined to be around 0.5 μm/min (Friedl et al, 1998). Given the maximum mOrange fluorescence in our reoxygenation reporter being observed around 4–6 h after reoxygenation (Fig 4B), this would amount to a migration distance of 120–180 μm, which fits well to the distances observed in Fig 5B and C. Interestingly, hypoxia has also been suggested to induce vascular remodeling by promoting the migration of vascular smooth muscle cells (Revuelta‐Lopez et al, 2013). An alternative interpretation for the presence of the reoxygenated cells in proximity to the blood vessels would be due to the transient vessel occlusion (Janssen et al, 2002).
The importance of hypoxia as a driving force in tumor vascularization and likely tumor metastatic spread is well accepted. We believe that the possibility to directly visualize tissue hypoxia at cellular level by light microscopy will be a valuable addition to the existing possibilities to investigate the role of hypoxia not only in tumors but also in other important tissues and biological processes.
Many of the central questions concerning the fate of hypoxic cells and their migratory behavior now become accessible through intravital microscopy. Transgenic mouse models expressing UnaG‐based hypoxia sensors in an organ‐specific or inducible fashion should become invaluable tools for these investigations.
Materials and Methods
Plasmid design
Plasmid containing 5 HRE sequences in tandem to a minimal CMV promoter was obtained from Addgene (#46926) (Vordermark et al, 2001). This plasmid was digested with NcoI and NotI enzymes (NEB) to release the d2EGFP insert fragment. UnaG was PCR‐amplified with overhang primers that contain a MCS in its N‐terminal and inserted into the HRE‐containing vector using the NcoI and NotI sites. PEST sequence was amplified from d2EGFP (Addgene #26164). ODDD region from HIF‐1α (Addgene #18949) was amplified (AA338‐608) (Chan et al, 2005), so as to contain prolines 402 & 564. mOrange was amplified from pcDNA3.1‐mOrange plasmid. The P2A sequence (GGCAGTGGAGAGGGCAGAGGAAGTCTGCTAACATGCGGTGACGTCGAGGAGAATCCTGGCCCA) was amplified from plasmids made for other works. All the PCR‐amplified products were restriction‐digested and cloned sequentially into the MCS region.
Cell lines
Stable cells lines were made in CHO and Gli36 cells. Cells were cultured at 37°C with 10% CO2 in DMEM supplemented with 10% FCS (Biowest Cat.# S1800), 100 μg/ml penicillin and streptomycin, and 2 mM glutamine. For experiments requiring 1% oxygen (hypoxia), cells were placed in an oxygen‐regulated incubator (HeraCell‐150, Thermo scientific). For hypoxia experiments on the microscope, a gas mixer was used to pump gas with 1% oxygen, 10% CO2, and rest of nitrogen to the sample‐holding chamber. NanoJuice transfection kit (Millipore‐71902) was used for transfections. All transfections were done according to the NanoJuice manufacturer protocol. A day after the transfection, cells were placed under selection with G418 sulfate (GIBCO) for two weeks, after which they were sorted based on UnaG fluorescence.
Cytometry
BD FACS Canto was used for cell analysis, and BD FACS Aria was used for cell sorting. In the process of making stable cells, the sensor‐transfected cells were sorted following chemical selection. Chemically selected cells were placed in 1% oxygen for 12 h prior to sorting. Cells were trypsinized and resuspended in DMEM supplemented with 10% FCS and antibiotic. All UnaG‐positive cells (FITC positive) were sorted into a collection tube with 2 ml of media. For cell analysis, cells were trypsinized and resuspended in PBS with 3% FCS. Flow cytometry data were exported as FCS files and analyzed using FlowJo software.
Microscopy
Zeiss LSM 780 microscope was used for live cell time‐lapse imaging and imaging of immunostained samples. The microscope is equipped with a humidified incubation chamber attached with a gas mixer. To enable better quantification when comparing different sensor constructs, cell lines were plated in different wells of the same IBIDI Treat (80826) 8‐well chamber slide. Position scanning module was used to acquire various sensor variants in the 8‐well slide. UnaG was excited at 488 nm, and mOrange was excited at 561 nm. The excitation laser intensity was always kept low to avoid photodamage to the cells. For time series experiments, images were acquired at an interval of 5 min. For in vivo imaging via cranial window, a LaVision Biotech multiphoton microscope (TriMScope) was used. This system is equipped with two tunable modelocked Chameleon XR Ti:Sapphire lasers. One of the lasers is used to pump an optical parametric oscillator (OPO) that generates wavelengths greater than 1,000 nm. UnaG was excited at 820 nm and mCherry was excited at 1,100 nm simultaneously. Mice were anesthetized and placed on a heated chamber while imaging. Blood vessels were visualized by Qtracker 705 Vascular Labels (Life technologies—Q21061MP), injected via tail vein prior to imaging. The Qtracker labels were excited at 820 nm.
Cranial window & intracranial injection
Fifteen‐week‐old male SCID mice were used for all in vivo experiments. Cranial window was done as described earlier (Holtmaat et al, 2009), with one additional tumor cell injection step done before closing the window. Stable sensor‐transfected Gli36 cells were used for injections. Cells were trypsinized and resuspended in DMEM without FCS at the concentration of 50,000 cells/ml. Two microliters of this cell suspension was injected using a Hamilton microneedle, before sealing the cranial windows with a glass coverslip. The mice were imaged every day following injection. Tumor cells could be seen starting 3 days after injection. For obtaining tissue for immunostainings, tumor cells were intracranially injected into SCID mice as described earlier (Baumann et al, 2012). Two weeks after the injection, mice were euthanized following PFA perfusion. Subsequently, the brain was explanted and cryosectioned to obtain tissue slides.
Immunohistochemistry
A proprietary PECAM antibody was used to stain blood vessels. HIF‐1α was obtained from GeneTex, Inc (Gene Tex‐GTX127309). The tissue sections were washed in PBS (3×) for 10 min. The slides were permeabilized with 0.1% Triton X‐100 in 1% BSA/PBS for 1 h. Primary antibody was allowed to bind in 1% BSA/PBS for 2 h, followed by washing with block buffer for (3×) 10 min. Secondary antibody was incubated for 30 min. The tissue sections were sealed with a glass coverslip using mounting media. TUNEL staining was done using Click‐iT® TUNEL Alexa Fluor® 647 kit according to the manufacturer protocol.
Image analysis
All image analysis was done using Fiji. For processing the live cell time‐lapse data, the time series analyzer plugin was used. The z‐stacks obtained from the time series were combined using the maximum intensity projection function. The entire image was divided into 25 rectangular regions using a custom ImageJ plugin, and the intensity across the time was obtained from all ROIs using time series analyzer. The data were saved in a csv file and analyzed by R. All the immunostained images were z‐projected with a maximum intensity for presentation. When required, to reduce the noise, mean filtering with a filter radius of 2 was applied.
Statistical analysis
Statistical programming software R was used for data processing and plotting. All plots were done with ggplot2 graphics package. Standard deviation or error was plotted as indicated in the figures. Standard deviation was calculated using the sd function from the base package, and the standard error was calculated using the standard error from the plotrix package. Curve fitting tool box from Matlab was used to fit exponential distribution and calculate the half‐lives.
Author contributions
RE and FK designed the experiments, evaluated the results, and wrote the manuscript. RE performed all the experiments and analysis. VVB and MS provided reagents and support during the project.
Conflict of interest
The authors declare that they have no conflict of interest.
Supporting information
Expanded View Figures PDF
Video EV1
Video EV2
Review Process File
Acknowledgements
We thank Martin Stehling for the support and discussion with regard to flow cytometry. We thank Andreas Jacobs for providing the Gli36 cell line, Roger Tsien for the generous gift of mOrange and Atsushi Miyawaki for the UnaG‐encoding cDNA. We gratefully acknowledge funding by the Deutsche Forschungsgemeinschaft (DFG), Collaborative Research Centers SFB‐629 and SFB‐656 to F.K, Max Planck Society to F.K., Cells In Motion—Cluster of Excellence (DFG EXC 1003) Flexible Funding (CIM FF 2015‐04) to F.K. and R.E., the International Max Planck Research School (IMPRS) to R.E and the Russian Science Foundation grant 14‐14‐00747 to V.V.B.
The EMBO Journal (2016) 35: 102–113
References
- Apte S, Chin FT, Graves EE (2011) Molecular Imaging of Hypoxia: strategies for Probe Design and Application. Curr Org Synth 8: 593–603 [DOI] [PMC free article] [PubMed] [Google Scholar]
- Baumann BC, Dorsey JF, Benci JL, Joh DY, Kao GD (2012) Stereotactic intracranial implantation and in vivo bioluminescent imaging of tumor xenografts in a mouse model system of glioblastoma multiforme. J Vis Exp 67: 4089 [DOI] [PMC free article] [PubMed] [Google Scholar]
- Bussink J, Kaanders JH, van der Kogel AJ (2003) Tumor hypoxia at the micro‐regional level: clinical relevance and predictive value of exogenous and endogenous hypoxic cell markers. Radiother Oncol 67: 3–15 [DOI] [PubMed] [Google Scholar]
- Cao Y, Li CY, Moeller BJ, Yu D, Zhao Y, Dreher MR, Shan S, Dewhirst MW (2005) Observation of incipient tumor angiogenesis that is independent of hypoxia and hypoxia inducible factor‐1 activation. Cancer Res 65: 5498–5505 [DOI] [PubMed] [Google Scholar]
- Carmeliet P, Dor Y, Herbert JM, Fukumura D, Brusselmans K, Dewerchin M, Neeman M, Bono F, Abramovitch R, Maxwell P, Koch CJ, Ratcliffe P, Moons L, Jain RK, Collen D, Keshert E (1998) Role of HIF‐1alpha in hypoxia‐mediated apoptosis, cell proliferation and tumour angiogenesis. Nature 394: 485–490 [DOI] [PubMed] [Google Scholar]
- Cecic I, Chan DA, Sutphin PD, Ray P, Gambhir SS, Giaccia AJ, Graves EE (2007) Oxygen sensitivity of reporter genes: implications for preclinical imaging of tumor hypoxia. Mol Imaging 6: 219–228 [PubMed] [Google Scholar]
- Chan DA, Giaccia AJ (2007) Hypoxia, gene expression, and metastasis. Cancer Metastasis Rev 26: 333–339 [DOI] [PubMed] [Google Scholar]
- Chan DA, Sutphin PD, Yen SE, Giaccia AJ (2005) Coordinate regulation of the oxygen‐dependent degradation domains of hypoxia‐inducible factor 1 alpha. Mol Cell Biol 25: 6415–6426 [DOI] [PMC free article] [PubMed] [Google Scholar]
- Cho EA, Song HK, Lee SH, Chung BH, Lim HM, Lee MK (2013) Differential in vitro and cellular effects of iron chelators for hypoxia inducible factor hydroxylases. J Cell Biochem 114: 864–873 [DOI] [PubMed] [Google Scholar]
- Coralli C, Cemazar M, Kanthou C, Tozer GM, Dachs GU (2001) Limitations of the reporter green fluorescent protein under simulated tumor conditions. Cancer Res 61: 4784–4790 [PubMed] [Google Scholar]
- Cui L, Zhong Y, Zhu W, Xu Y, Du Q, Wang X, Qian X, Xiao Y (2011) A new prodrug‐derived ratiometric fluorescent probe for hypoxia: high selectivity of nitroreductase and imaging in tumor cell. Org Lett 13: 928–931 [DOI] [PubMed] [Google Scholar]
- Fandrey J, Gorr TA, Gassmann M (2006) Regulating cellular oxygen sensing by hydroxylation. Cardiovasc Res 71: 642–651 [DOI] [PubMed] [Google Scholar]
- Fomicheva EV, Turner II, Edwards TG, Hoff J, Arden E, D'Alecy LG, Metzger JM (2008) Double oxygen‐sensing vector system for robust hypoxia/ischemia‐regulated gene induction in cardiac muscle in vitro and in vivo. Mol Ther 16: 1594–1601 [DOI] [PMC free article] [PubMed] [Google Scholar]
- Friedl P, Zanker KS, Brocker EB (1998) Cell migration strategies in 3‐D extracellular matrix: differences in morphology, cell matrix interactions, and integrin function. Microsc Res Tech 43: 369–378 [DOI] [PubMed] [Google Scholar]
- Fujiwara S, Nakagawa K, Harada H, Nagato S, Furukawa K, Teraoka M, Seno T, Oka K, Iwata S, Ohnishi T (2007) Silencing hypoxia‐inducible factor‐1alpha inhibits cell migration and invasion under hypoxic environment in malignant gliomas. Int J Oncol 30: 793–802 [PubMed] [Google Scholar]
- Hanahan D, Folkman J (1996) Patterns and emerging mechanisms of the angiogenic switch during tumorigenesis. Cell 86: 353–364 [DOI] [PubMed] [Google Scholar]
- Harada H, Kizaka‐Kondoh S, Itasaka S, Shibuya K, Morinibu A, Shinomiya K, Hiraoka M (2007) The combination of hypoxia‐response enhancers and an oxygen‐dependent proteolytic motif enables real‐time imaging of absolute HIF‐1 activity in tumor xenografts. Biochem Biophys Res Commun 360: 791–796 [DOI] [PubMed] [Google Scholar]
- Heim R, Prasher DC, Tsien RY (1994) Wavelength mutations and posttranslational autoxidation of green fluorescent protein. Proc Natl Acad Sci USA 91: 12501–12504 [DOI] [PMC free article] [PubMed] [Google Scholar]
- Hendriksen EM, Span PN, Schuuring J, Peters JP, Sweep FC, van der Kogel AJ, Bussink J (2009) Angiogenesis, hypoxia and VEGF expression during tumour growth in a human xenograft tumour model. Microvasc Res 77: 96–103 [DOI] [PubMed] [Google Scholar]
- Hockel M, Vaupel P (2001) Tumor hypoxia: definitions and current clinical, biologic, and molecular aspects. J Natl Cancer Inst 93: 266–276 [DOI] [PubMed] [Google Scholar]
- Holtmaat A, Bonhoeffer T, Chow DK, Chuckowree J, De Paola V, Hofer SB, Hubener M, Keck T, Knott G, Lee WC, Mostany R, Mrsic‐Flogel TD, Nedivi E, Portera‐Cailliau C, Svoboda K, Trachtenberg JT, Wilbrecht L (2009) Long‐term, high‐resolution imaging in the mouse neocortex through a chronic cranial window. Nat Protoc 4: 1128–1144 [DOI] [PMC free article] [PubMed] [Google Scholar]
- Janssen HL, Haustermans KM, Sprong D, Blommestijn G, Hofland I, Hoebers FJ, Blijweert E, Raleigh JA, Semenza GL, Varia MA, Balm AJ, van Velthuysen ML, Delaere P, Sciot R, Begg AC (2002) HIF‐1A, pimonidazole, and iododeoxyuridine to estimate hypoxia and perfusion in human head‐and‐neck tumors. Int J Radiat Oncol Biol Phys 54: 1537–1549 [DOI] [PubMed] [Google Scholar]
- Kiyose K, Hanaoka K, Oushiki D, Nakamura T, Kajimura M, Suematsu M, Nishimatsu H, Yamane T, Terai T, Hirata Y, Nagano T (2010) Hypoxia‐sensitive fluorescent probes for in vivo real‐time fluorescence imaging of acute ischemia. J Am Chem Soc 132: 15846–15848 [DOI] [PubMed] [Google Scholar]
- Kizaka‐Kondoh S, Konse‐Nagasawa H (2009) Significance of nitroimidazole compounds and hypoxia‐inducible factor‐1 for imaging tumor hypoxia. Cancer Sci 100: 1366–1373 [DOI] [PMC free article] [PubMed] [Google Scholar]
- Kumagai A, Ando R, Miyatake H, Greimel P, Kobayashi T, Hirabayashi Y, Shimogori T, Miyawaki A (2013) A bilirubin‐inducible fluorescent protein from eel muscle. Cell 153: 1602–1611 [DOI] [PubMed] [Google Scholar]
- Lando D, Peet DJ, Gorman JJ, Whelan DA, Whitelaw ML, Bruick RK (2002) FIH‐1 is an asparaginyl hydroxylase enzyme that regulates the transcriptional activity of hypoxia‐inducible factor. Genes Dev 16: 1466–1471 [DOI] [PMC free article] [PubMed] [Google Scholar]
- Lecoq J, Parpaleix A, Roussakis E, Ducros M, Goulam HY, Vinogradov SA, Charpak S (2011) Simultaneous two‐photon imaging of oxygen and blood flow in deep cerebral vessels. Nat Med 17: 893–898 [DOI] [PMC free article] [PubMed] [Google Scholar]
- Li X, Zhao X, Fang Y, Jiang X, Duong T, Fan C, Huang CC, Kain SR (1998) Generation of destabilized green fluorescent protein as a transcription reporter. J Biol Chem 273: 34970–34975 [DOI] [PubMed] [Google Scholar]
- Malhotra R, Lin Z, Vincenz C, Brosius FC III (2001) Hypoxia induces apoptosis via two independent pathways in Jurkat cells: differential regulation by glucose. Am J Physiol Cell Physiol 281: C1596–C1603 [DOI] [PubMed] [Google Scholar]
- Mathieu J, Zhang Z, Nelson A, Lamba DA, Reh TA, Ware C, Ruohola‐Baker H (2013) Hypoxia induces re‐entry of committed cells into pluripotency. Stem Cells 31: 1737–1748 [DOI] [PMC free article] [PubMed] [Google Scholar]
- Mishin AS, Belousov VV, Solntsev KM, Lukyanov KA (2015) Novel uses of fluorescent proteins. Curr Opin Chem Biol 27: 1–9 [DOI] [PubMed] [Google Scholar]
- Muz B, de la Puente P, Azab F, Luderer M, Azab AK (2014) Hypoxia promotes stem cell‐like phenotype in multiple myeloma cells. Blood Cancer J 4: e262 [DOI] [PMC free article] [PubMed] [Google Scholar]
- Raleigh JA, Dewhirst MW, Thrall DE (1996) Measuring tumor hypoxia. Semin Radiat Oncol 6: 37–45 [DOI] [PubMed] [Google Scholar]
- Remington SJ (2006) Fluorescent proteins: maturation, photochemistry and photophysics. Curr Opin Struct Biol 16: 714–721 [DOI] [PubMed] [Google Scholar]
- Revuelta‐Lopez E, Castellano J, Roura S, Galvez‐Monton C, Nasarre L, Benitez S, Bayes‐Genis A, Badimon L, Llorente‐Cortes V (2013) Hypoxia induces metalloproteinase‐9 activation and human vascular smooth muscle cell migration through low‐density lipoprotein receptor‐related protein 1‐mediated Pyk2 phosphorylation. Arterioscler Thromb Vasc Biol 33: 2877–2887 [DOI] [PubMed] [Google Scholar]
- Rogers S, Wells R, Rechsteiner M (1986) Amino acid sequences common to rapidly degraded proteins: the PEST hypothesis. Science 234: 364–368 [DOI] [PubMed] [Google Scholar]
- Roussakis E, Spencer JA, Lin CP, Vinogradov SA (2014) Two‐photon antenna‐core oxygen probe with enhanced performance. Anal Chem 86: 5937–5945 [DOI] [PMC free article] [PubMed] [Google Scholar]
- Salceda S, Caro J (1997) Hypoxia‐inducible factor 1alpha (HIF‐1alpha) protein is rapidly degraded by the ubiquitin‐proteasome system under normoxic conditions. Its stabilization by hypoxia depends on redox‐induced changes. J Biol Chem 272: 22642–22647 [DOI] [PubMed] [Google Scholar]
- Semenza GL (2011) Oxygen sensing, homeostasis, and disease. N Engl J Med 365: 537–547 [DOI] [PubMed] [Google Scholar]
- Semenza GL (2012) Hypoxia‐inducible factors: mediators of cancer progression and targets for cancer therapy. Trends Pharmacol Sci 33: 207–214 [DOI] [PMC free article] [PubMed] [Google Scholar]
- Semenza GL, Nejfelt MK, Chi SM, Antonarakis SE (1991) Hypoxia‐inducible nuclear factors bind to an enhancer element located 3′ to the human erythropoietin gene. Proc Natl Acad Sci USA 88: 5680–5684 [DOI] [PMC free article] [PubMed] [Google Scholar]
- Shaner NC, Steinbach PA, Tsien RY (2005) A guide to choosing fluorescent proteins. Nat Methods 2: 905–909 [DOI] [PubMed] [Google Scholar]
- Shibata T, Giaccia AJ, Brown JM (2000) Development of a hypoxia‐responsive vector for tumor‐specific gene therapy. Gene Ther 7: 493–498 [DOI] [PubMed] [Google Scholar]
- Span PN, Bussink J (2015) Biology of hypoxia. Semin Nucl Med 45: 101–109 [DOI] [PubMed] [Google Scholar]
- Spencer JA, Ferraro F, Roussakis E, Klein A, Wu J, Runnels JM, Zaher W, Mortensen LJ, Alt C, Turcotte R, Yusuf R, Cote D, Vinogradov SA, Scadden DT, Lin CP (2014) Direct measurement of local oxygen concentration in the bone marrow of live animals. Nature 508: 269–273 [DOI] [PMC free article] [PubMed] [Google Scholar]
- Srinivas V, Zhang LP, Zhu XH, Caro J (1999) Characterization of an oxygen/redox‐dependent degradation domain of hypoxia‐inducible factor alpha (HIF‐alpha) proteins. Biochem Biophys Res Commun 260: 557–561 [DOI] [PubMed] [Google Scholar]
- Vordermark D, Shibata T, Brown JM (2001) Green fluorescent protein is a suitable reporter of tumor hypoxia despite an oxygen requirement for chromophore formation. Neoplasia 3: 527–534 [DOI] [PMC free article] [PubMed] [Google Scholar]
- Wenger RH, Stiehl DP, Camenisch G (2005) Integration of oxygen signaling at the consensus HRE. Sci STKE 2005: re12 [DOI] [PubMed] [Google Scholar]
- Yuan Y, Hilliard G, Ferguson T, Millhorn DE (2003) Cobalt inhibits the interaction between hypoxia‐inducible factor‐alpha and von Hippel‐Lindau protein by direct binding to hypoxia‐inducible factor‐alpha. J Biol Chem 278: 15911–15916 [DOI] [PubMed] [Google Scholar]
Associated Data
This section collects any data citations, data availability statements, or supplementary materials included in this article.
Supplementary Materials
Expanded View Figures PDF
Video EV1
Video EV2
Review Process File